
Abstract
Introduction
Diabetes is one of the leading causes of death and disability worldwide. According to various sources, including the International Diabetes Federation and the World Health Organization, the global prevalence of diabetes in adults was estimated to be 10.5% in 2019, corresponding to approximately 463 million adults worldwide. This number is projected to increase to 578 million by 2030 and 700 million by 2045. 1 Data from 2023 indicated that more than half a billion people are living with diabetes worldwide, regardless of country, age group, or sex, and that number is projected to more than double to 1.3 billion people in the next 30 years. 2
Diabetes remains a substantial public health issue. Type 2 diabetes mellitus (T2DM), which makes up the bulk of diabetes cases, is largely preventable and, in some cases, potentially reversible if identified and managed early in the disease course. However, all evidence indicates that diabetes prevalence is increasing worldwide, primarily due to a rise in obesity caused by multiple factors. Preventing and controlling T2DM remains an ongoing challenge. 2 Hyperglycemia in diabetes can generate excess reactive oxygen species, which can cause oxidative stress and damage various cellular components, including lipids, proteins, and deoxyribonucleic acid (DNA). This plays a central role in the pathogenesis of micro- and macro-vascular diseases. 3 The main goal of hyperglycemia treatment in diabetes is to prevent or delay the onset of diabetic complications that typically involve a combination of lifestyle changes, such as regular physical activity and a healthy diet, and medication may also be prescribed to help manage blood sugar levels. 4
Medicinal plants have been used for centuries as a traditional treatment for various health conditions, including diabetes mellitus (DM), and continue to be an essential source of drugs. 5 Many of these plants contain phytochemicals that can act by inhibiting enzymes involved in the absorption of carbohydrates, improving insulin sensitivity, and reducing oxidative stress to help manage DM. 6 D. orientalis A. (Georgian pink), or kiwi in Kurdish, is a perennial wild species belonging to the Dianthus genus found in Iraq. 7 The Dianthus (carnations and pinks) genus belongs to the Caryophyllaceae family, which has over 300 species. 8 The major bioactive compounds plants in this family are polyphenols, flavonoids, saponins, phytoecdysteroids, lignans, peptides, anthraquinones, phenylpropanoids, phytoecdysteroids, amides, essential oils, alkaloids, vitamins, and cyclic peptides, which contributes to their pharmacological properties. 9
Using natural products or antioxidant supplements can help target oxidative stress and improve outcomes in diabetes while reducing the risk of complications. 10 Oxidative stress can damage cells and tissues, impair insulin signaling and glucose uptake, and promote inflammation, which can contribute to the development and progression of diabetes. 11 Specific parameters support the antidiabetic effects of medicinal plants, including lowering blood glucose concentrations and lipid levels. The antioxidant properties possess the potential to reduce oxidative stress and inflammation associated with diabetes. Some medicinal plants and their bioactive constituents have also demonstrated antidiabetic properties by regulating microribonuclic acid (miRNA) expression. 12
miRNAs act by binding to complementary sequences on the 3′-UTRs of miRNA, resulting in messenger ribonucleic acid (mRNA) degradation or mRNA inhibition. By regulating the expression of genes, miRNAs play a crucial role in diverse physiological and pathological processes, including cell differentiation, proliferation, apoptosis, and metabolism. 13 Dysregulation of miRNAs is observed in type 1 diabetes mellitus (T1DM) pathogenesis, and restoring these miRNAs to normal levels or using miRNA mimics or inhibitors could improve the production and secretion of insulin, as well as insulin sensitivity. 14 Thus, this study aimed to find the antidiabetic effects of D. orientalis Adams leaf extract (DOAE) on dyslipidemia, oxidative stress, and dysregulation of miR-21, miR-24, and miR-126 in diabetic rats.
Materials and Methods
Study Design
This experimental study was conducted at the Animal House of the College of Medicine, University of Sulaimani, Sulaimaniyah, Iraq, from August 2021 to April 2023.
D. orientalis A. Collection and Identification
The leaves of DOA were collected from July to August 2021 from the Penjween district, Sulaimaniyah, Kurdistan region of Iraq. A certified taxonomist made proper identification and authentication at the Herbarium Department, Kurdistan Botanical Foundation, American University of Iraq Sulaimani (AUIS). A voucher (No. 265-12-02-2021-AUIS) was deposited at the AUIS campus herbarium.
D. orientalis A. Extraction
The harvested leaves were dried in a shaded area for 2 weeks and powdered at the Biochemistry Laboratory, College of Medicine, University of Sulaimani, Sulaimaniyah, Iraq. Then, 100 g of the dried powder was macerated with methanol (1 : 10; weight : volume) for 72 h at room temperature with constant shaking. The extracts were filtered using the Whatman No. 1 filter paper. The filtrates were concentrated by evaporating the solvents and were used to prepare the samples for further analysis. The yield product percentage of the crude extracts was calculated as the weight of natural extract/weight of fresh plant × 100. Finally, we extracted 10.2 g of crude DOA from each 100 g of the plant leaf powder. All sections were stored at 4 °C until needed.
In-Vivo Antidiabetic Study
Animals
Thirty adult male Sprague Dawley rats (weighed 150 ± 20 g and aged 6-8 weeks) were obtained from the Animal House of the College of Medicine, University of Sulaimani, Iraq and placed at 25 ± 3 °C for 12 h light and 12 h dark cycle. They were provided DW and a standard rat chow containing crude protein, fiber, fat, minerals, vitamins, and salt (Golden Coin, Malaysia). Animals were acclimatized for 7 days before the experiment.
Induction of Diabetes
Streptozotocin (STZ) (Sigma, St. Louis, MO, USA) was dissolved in 0.1 mM citrate buffer (pH 4.5), and then it was used (50 mg/kg) to induce diabetes in a rat model by single intraperitoneal dose. 15 Afterwards, rats were allowed access to 10% glucose water to enhance hyperglycemia. After 72 h, a glucometer measured the random blood glucose (RBG) level through a tail vein puncture (Bayer Contour Blood Glucose Meter). RBG values of ≥300 mg/dL were considered as diabetes.
Animals Grouping and Dose Administration
Rats were divided into 5 groups of 6 animals each. Group 1 was control negative (CN) rats who received DW only. Group 2 was diabetic control (DC) rats and received DW also, while Group 3 was control positive (CP) diabetic rats given glibenclamide (GLB) (Sigma Aldrich, St Louis, MO, USA) as the reference drug (0.6 mg/kg). 16 Group 4 consisted of diabetic rats given low-doses (LD) of DOAE (100 mg/kg), and Group 5 rats received high-doses (HD) of DOAE (200 mg/kg). Three days after the confirmed diabetes, treatments were given orally using a force-feeding needle for exactly 4 consecutive weeks.
Determination of Blood Glucose
Blood glucose was measured once a week throughout the experiment with a Bayer Contour blood glucose meter and test strips using an enzymatic reflectance photometric assay. Briefly, one drop of fresh venous blood was applied to the reagent area of a test strip, and the strip was inserted into the glucose meter test chamber that directed light onto the test area. The glucose in the sample reacts with the reagents in the strip pad, causing a colour change. The amount of light reflected from the coloured test area was proportional to the concentration of glucose measured by the photometer and was converted into a digital readout.
Body Weight Measurements
The rats’ body weight was measured using a specialized balance on days 0, 7, 14, 21, and 28 of the experiment.
Biochemical Parameters
At the end of the experiment, all rats were fasted for about 12 h, and then they were sacrificed under deep anesthesia using a mixture of xylazine and ketamine (0.2 mL). The blood sample was collected through cardiac puncture and centrifuged at 3000 rounds per minute for 10 min to separate the serum. Then, glucose, total bilirubin, aspartate aminotransferase (AST), alanine transaminase (ALT), alkaline phosphatase (ALP), urea, creatinine, total cholesterol (TC), triglyceride (TG), low-density lipoprotein (LDL), high-density lipoprotein (HDL), and very low-density lipoprotein (VLDL) were estimated.
Total Antioxidant Capacity
Total antioxidant capacity (TAC) was measured colourimetrically with a TAC Kit (Sigma-Aldrich, Cat. No. MAK187). The combination of both small molecule and protein antioxidants was determined by converting cupric ion (Cu2+) to cuprous ion (Cu+). The reduced Cu+ ion chelates with a colourimetric probe, giving a broad absorbance peak at 570 nm, proportional to the TAC. The values obtained from the appropriate Trolox Standards were used to plot a standard curve. All samples and standards were run in duplicate. The concentration of antioxidant (Trolox equivalents) in the sample was determined as
Histopathological Examination
After rats were sacrificed on day 29th of the experiment, samples of the pancreas, liver, and kidneys were collected for histopathological analysis. Briefly, collected tissues were rinsed in phosphate buffer saline, fixed and preserved in 10% neutral buffered formalin for at least 2 days, processed using various concentrations of ethanol, trimmed using microtome, embedded in paraffin, sectioned to a thickness of approximately 5.0 µm, stained with hematoxylin and eosin, mounted using a mixture of distyrene, a plasticizer, and xylene (DPX), dried on a hot plate, then examined under ordinary light microscope (Leica, Japan) and photos were captured.
Molecular Study
miRNA Extraction
RNA was extracted using the miRNeasy Serum/Plasma Kit (Qiagen, Catalog No. 217184, Germany) per the manufacturer's instruction. The miRNeasy Serum/Plasma Spike-In Control was reconstituted by adding 300 μL RNase-free water per tube to obtain 2.0 × 10¹⁰ copies/μL stock. For the working solution, 4.0 μL of 2.0 × 10¹⁰ copies/μL stock was added to 16 μL RNase-free water to obtain 4.0 × 10⁹ copies/μL (Table 1).
Serum/Plasma Spike-in Control Dilutions.

RNA Extraction and Quantification
The extraction process comprised 4 main steps: lysis, RNA binding to the column, washing, and RNA elution per manufacturing company. Then, RNA measurement was performed using a NanoDrop-Spectrophotometer (Thermo Fisher, USA). Briefly, 1.0 μL of the sample was pipetted and placed into Nanodrop after washing it with RNAase/DNase-free water and absorbance was measured at 260 and 280 nm. A 260/280 ratio was used to evaluate the purity of RNA. Sample quality ranged from 1.7 to 2.0, and total RNA concentrations of >.5 ng/μL were used for downstream application.
Set up the Complementary Deoxyribonucleic Acid Synthesis Reaction
Reverse transcriptase (RT) and other necessary reagents for complementary deoxyribonucleic acid (cDNA) synthesis were subsequently added to convert the miRNAs into first-strand cDNA to be analyzed by quantitative polymerase chain reaction (qPCR). After sealing each reaction tube, it was gently vortexed to mix contents and centrifuged to collect the components. Then, in an RNase-free 0.2 mL tube, the reagents were combined, placed in a thermal cycler for 1 h at 37 °C, and then termination was done at 85 °C for 5 min to inactivate the enzymes. Finally, 90 μL of double distilled water (ddH2O) was added to bring the total volume to 100 μL (Table 2), and the cDNA was stored at −80 °C until further analysis.
cDNA Synthesis Reaction.

Real-Time TB Green RT-qPCR Amplification of miRNAs
For each RT-qPCR reaction (master mix), the components in Table 3 were mixed carefully, and then miR-21, miR24, and miR-126 primers were used as miRNA-specific 5′ primers. The 3′ Primer for qPCR was the mRQ 3′ Primer supplied with the kit. PCR program involved initial denaturation at 95 °C for 1.0 min, then 40 cycles of denaturation at 94 °C for 40 s, annealing at 55 °C for 40 s, extension at 55 °C for 30 s, and a final extension at 95 °C for 30 s using a thermal cycler (Qiagen, Germany). The Pfaffl method (2−ΔΔCtΔ) was used to determine the fold change expression for each gene as Delta cycle threshold (ΔCt) = ΔCt Sample − ΔCt Control.
Sample Preparation for qPCR Reaction.

Ethical Considerations
The proposal and study protocol were revised and approved by the Scientific and Ethical Committees of the College of Medicine, University of Sulaimani, Iraq (No. 215/17/10/2021). Measures were taken to minimize pain and discomfort, and experiments followed the ARRIVE Guidelines for animal ethics.
Statistical Analysis
The results were expressed as mean ± SD and analyzed using a Statistical Package for the Social Sciences (SPSS, IBM, Chicago, USA, version 27), including Shapiro–Wilk and Kolmogorov–Smirnov tests to determine the normal distribution of the data. The studied groups were compared using an independent sample t-test and Mann–Whitney U-test. Probability values of less than .05 were considered significant. The distribution of miRNA expression was analyzed by GraphPad Prism software 8 (Inc.; San Diego, CA, USA).
Results
Body Weight Analysis
Rats in the DC group showed a significant reduction in body weight compared with the baseline data. Conversely, the animals in the CN, CP (treated with GLB), and HD (200 mg/kg) of DOAE showed a significantly increased body weight compared to the baseline data (Table 4).
Body Weight of Nondiabetic and Diabetic Rats Treated With Various Agents.

Abbreviations: CN, control negative; DC, diabetic control; DOA, Dianthus orientalis Adams; GLB, glibenclamide; HD, high dose; LD, low dose.
Significant difference using independent samples T-test.
P < .05 when compared to zero-day.
Blood Glucose Estimation
The animals in the CP (GLB) and a HD group (200 mg/kg) showed a significant reduction in blood glucose compared to the baseline data. Furthermore, the DC reported a substantial increase in blood glucose levels when compared to the CN group. Meanwhile, CP and groups treated with DOAE reported a significant decrease in blood glucose compared to DC (Table 5).
Blood Glucose Levels (mg/dl) of Nondiabetic and Diabetic Rats Treated With Various Agents.

Abbreviations: CN, control negative; DC, diabetic control; DOA, Dianthus orientalis Adams; GLB, glibenclamide; HD, high dose; LD, low dose.
Significant difference using independent samples T-test.
P < .05 when compared to the diabetic control group.
P < .05 compared with the negative control group.
Biochemical Analysis
Rats in the DC group showed a significant increase in ALT, AST, ALP, and urea compared to the CN group. Meanwhile, diabetic rats treated with GLB and DOAE (100 and 200 mg/kg) showed a significant decrease in ALT, AST, and ALP compared to the DC group (Table 6).
Liver Biochemical Tests and Renal Function Testes of the Experimental Groups.
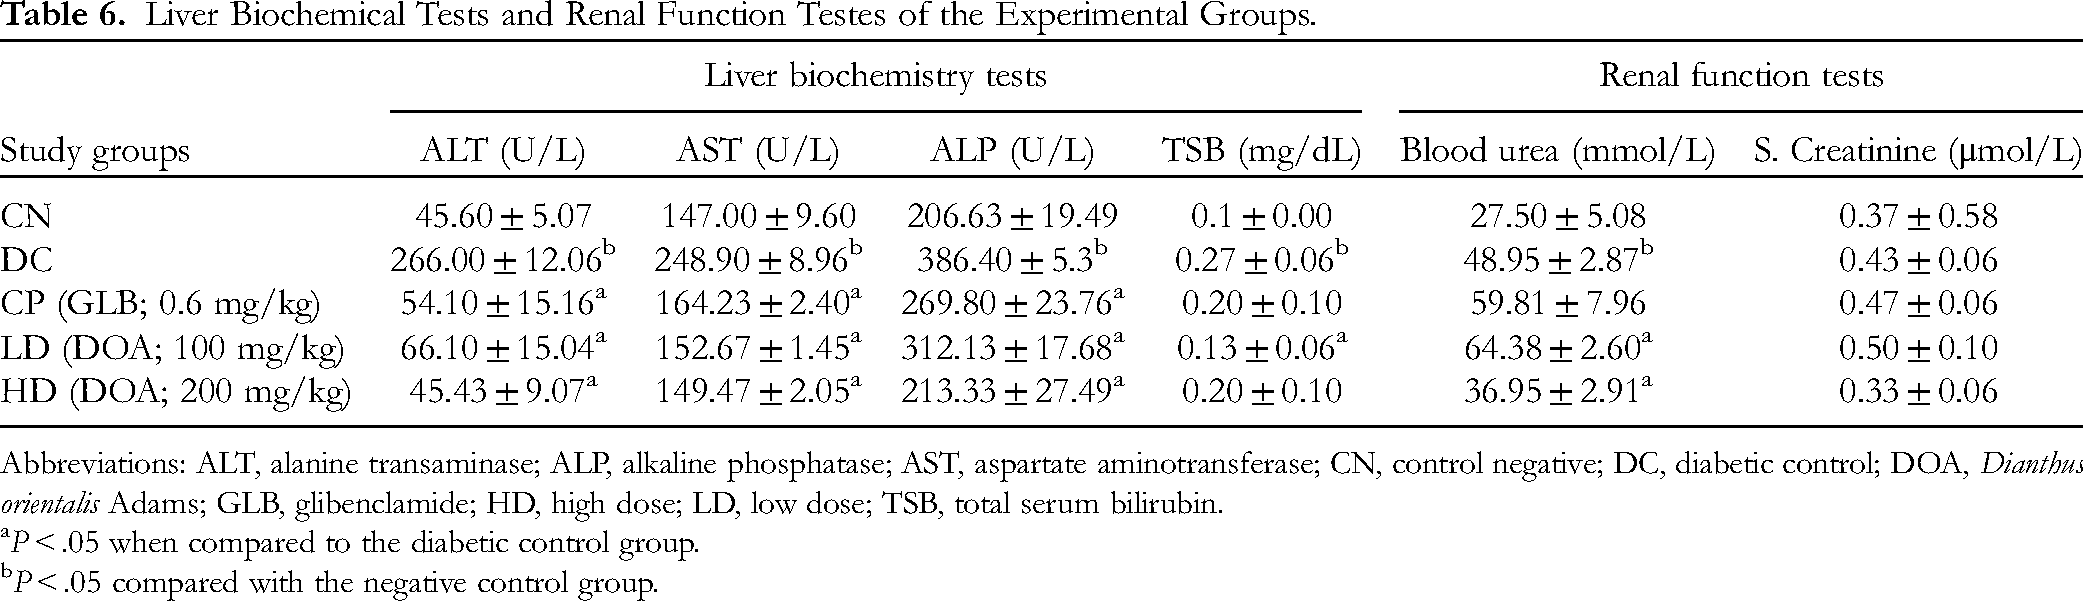
Abbreviations: ALT, alanine transaminase; ALP, alkaline phosphatase; AST, aspartate aminotransferase; CN, control negative; DC, diabetic control; DOA, Dianthus orientalis Adams; GLB, glibenclamide; HD, high dose; LD, low dose; TSB, total serum bilirubin.
P < .05 when compared to the diabetic control group.
P < .05 compared with the negative control group.
Effect of DOA on Lipid Profile
Rats in the DC group showed a significant increase in serum TC, TG, VLDL, and LDL and a decrease in HDL concentrations compared to the CN group. The groups treated with DOAE and GLB significantly reduced the levels of TC, TG, VLDL, and LDL compared with the DC group. Furthermore, HDL concentration increased in the HD DOAE (200 mg/kg) and GLB groups compared with the DC rats (Table 7).
Lipid Profile Values (mg/dL) Among the Experimental Groups.

Abbreviations: CN, control negative; DC, diabetic control; DOA, Dianthus orientalis Adams; GLB, glibenclamide; HD, high dose; LD, low dose; TC, total cholesterol; TG, triglyceride; HDL, high-density lipoprotein; LDL, low-density lipoprotein; VLDL, very low-density lipoprotein.
P < .05 when compared to the diabetic control group.
P < .05 compared with the negative control group.
Effect of DOA on TAC
The concentration of antioxidants is expressed as Trolox equivalent antioxidant capacity (TEAC). Since TEAC quantifies the effective antioxidant activity of the methanolic extract of DOAE in diabetic rats, a higher TEAC would imply more excellent antioxidant activity in the samples. Groups treated with DOAE (100 and 200 mg/kg) and GLB significantly showed increased antioxidant levels compared to the DC group. Meanwhile, the DC group showed a significant decrease in antioxidants when compared to the CN group (Table 8).
Total Antioxidant Capacity of DOA Among the Experimental Groups.

Abbreviations: CN, control negative; DC, diabetic control; DOA, Dianthus orientalis Adams; GLB, glibenclamide; HD, high dose; LD, low dose.
P < .05 when compared to the diabetic control group.
P < .05 compared with the negative control group.
Histopathological Findings
The liver section from the CN group shows no noticeable morphological changes, which is evident in a typically organized radiated column of hepatocytes around the central vein, typically appearing sinusoidal capillaries and mild Kupffer cell distribution. Liver tissue from the DC group demonstrates critical and significant vacuolar degenerations apparent by granular cytoplasmic changes. Moreover, some affected hepatocytes show features of cellular necrosis, and other hepatocytes reveal prominent and clear vacuoles in the cytoplasm. In addition, most sinusoidal capillaries disappeared due to the severe cellular swelling, with a slightly dilated central vein. The liver section from the CP group shows mild to moderate vacuolar degeneration within the given hepatocytes, and most hepatocytes display typical centrilobular arrangement with no noticeable morphological changes. Furthermore, most sinusoidal capillaries appear typically fixed with mild Kupffer cell infiltration and are usually fitted in the central vein. Liver section from LD DOAE reveals significant cellular necrosis manifest by the ghost and fragmented nuclei, together with severe vacuolar degeneration within the cytoplasm of the hepatocytes, which shows eosinophilic granular morphology. Furthermore, the central vein appears dilated with significant narrowing of the sinusoidal capillaries. Liver tissues from HD DOAE demonstrate a significant reduction in cellular necrosis among the given hepatocytes, reduced numbers of vacuolar degenerative cells, and a moderate degree of Kupffer cell distribution. The central vein is still dilated with no apparent congestion (Figure 1).

Photomicrograph of the liver from the negative control group (CN) shows no noticeable morphological changes in the hepatic tissues, evident with typically organized radiated column of hepatocytes (HP) around the central vein (CV) with normally appeared sinusoidal capillaries (SC), together with mild Kupffer cells distribution (yellow arrow). The liver from the diabetic control group (DC) demonstrates critical and significant vacuolar degenerations (VD) apparent by granular cytoplasmic changes. Moreover, some affected hepatocytes show features of cellular necrosis (yellow arrows), and other HP reveals prominent and clear vacuoles within their cytoplasm. In addition, most of the sinusoidal capillaries disappeared due to severe cellular swelling, with a slightly dilated CV. The liver from the control positive group (CP) shows mild to moderate VD within the given hepatocytes. On the other hand, most of the HP display typical centrilobular arrangement with no noticeable morphological changes. Furthermore, most sinusoidal capillaries (yellow arrows) appear typically fixed with mild Kupffer's cell infiltration and typically fitted CV. Liver from low dose group (LD) reveals the presence of significant cellular necrosis (yellow arrows) manifest by the appearance of ghost and fragmented nuclei, together with severe VD within the HP cytoplasm, which shows eosinophilic granular morphology. Furthermore, CV appears dilated with significant narrowing of the sinusoidal capillaries. The liver from the high-dose group (HD) demonstrates a substantial reduction in cellular necrosis among the given HP, reduced numbers of VD, and a moderate degree of Kupffer cell distribution (yellow arrows). The CV is still dilated with no apparent congestion.
Renal tissue from the CN group displays no noticeable histopathological changes, explicit with distinctive glomerular morphology together with no significant lesions within the renal tubules except for mild and non-significant cellular granular swelling, with the mild infiltration of some eosinophilic protein materials within the tubular lumina. The kidney section from the DC group demonstrates significant interstitial infiltration of inflammatory cells, severe cloudy cellular swelling within the renal tubular epithelia, and significant glomerular atrophy concomitant with severe glomerular degeneration. Glomerular Bowman's capsules and spaces appear severely distorted. Kidney tissues from CP demonstrate mild to moderate glomerular atrophy and slight vacuolar degeneration within the renal tubular epithelia. Kidney tissues from LD DOAE reveal significant cellular swelling and vacuolar degeneration within the renal tubular epithelium, with visible vascular dilation and perivascular inflammatory cell distribution. Moreover, the glomeruli appear slightly atrophied. Finally, renal tissues from the group with HDs typically appear to have a glomerular structure at the upper standard with glomerular atrophy at the lower section. Some renal tubules reveal significant cellular swelling with apparent narrowing in their lumina; other tubular epithelia demonstrate visible cellular necrosis. Moreover, most of the renal tubules had no prominent lesions, while some tubules revealed the presence of acidophilic proteinaceous hyaline cast within their lumina. The sections also demonstrate morphological glomeruli with no visible lesions (Figure 2).
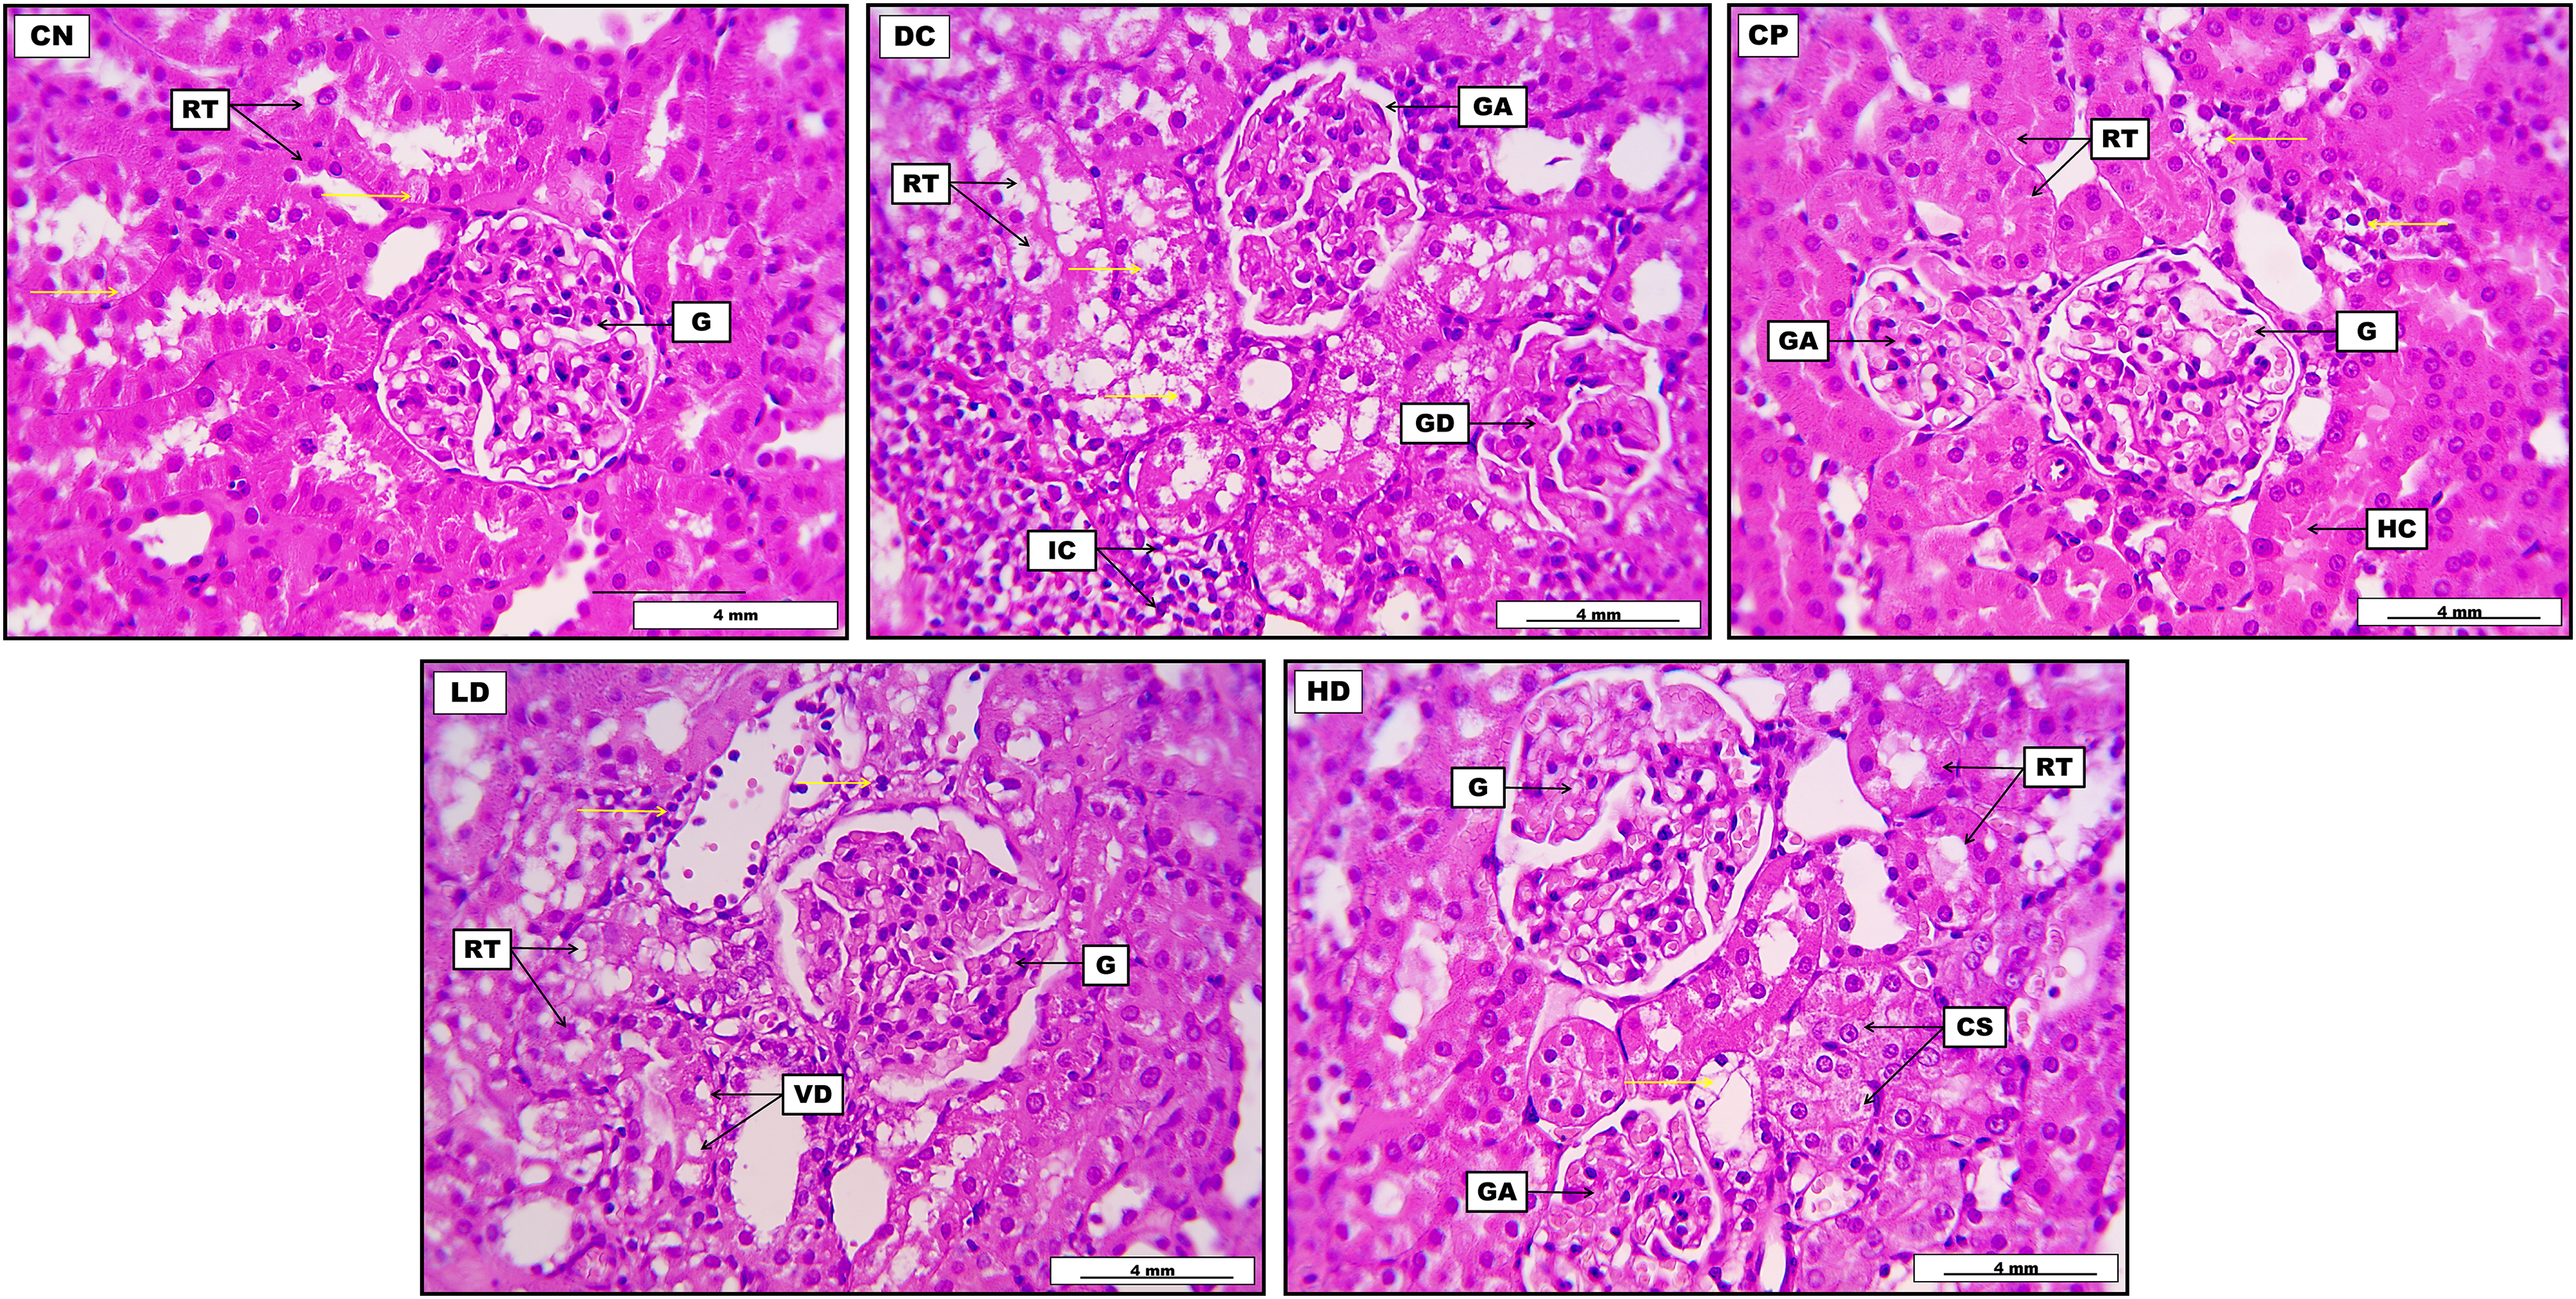
Photomicrograph of the kidney from the control negative group (CN) displays no noticeable histopathological changes, explicit with distinctive glomerular morphology (G), together with no significant lesions within the renal tubules (RT) except for mild and non-significant cellular granular swelling (yellow arrows), with the mild infiltration of some eosinophilic protein materials within the tubular lumina. Kidney from diabetic control group (DC) demonstrates significant interstitial infiltration of inflammatory cells (IC) together with severe cloudy cellular swelling (yellow arrows) within the RT epithelia, in addition to the presence of significant glomerular atrophy (GA) concomitant with severe glomerular degeneration (GD). Kidney from control positive (CP) demonstrates mild to moderate GA and slight vacuolar degeneration within the renal tubular epithelia (yellow arrows). Moreover, most of the RT in the given section appeared morphologically typical with no prominent lesions. Some renal tubules reveal the presence of acidophilic proteinaceous hyaline cast (HC) within their lumina. Glomerular Bowman's capsules and spaces appear severely distorted. A kidney from the low-dose group (LD) reveals the presence of significant cellular swelling and vacuolar degeneration (VD) within the RT epithelium, together with visible vascular dilation and perivascular inflammatory cell distribution (yellow arrows). Moreover, the glomeruli appear slightly atrophied. A kidney from the high-dose group (HD) normally shows glomerular structure (G) generally at the upper section and GA at the lower section. Some RT in the given section reveals significant cellular swelling (CS) with apparent narrowing in their lumina; other tubular epithelia demonstrate visible cellular necrosis (yellow arrow). The sections also demonstrate current morphological glomeruli with no visible lesions (H&E), with a scale bar of 4 mm.
Pancreatic tissue from the CN group demonstrates the standard morphological appearance of pancreatic acini, and the typically placed Islet of Langerhans, which is evident by regular cellular arrangement. It also elucidates typical pancreatic ducts with pinkish secretion in lumina, together with some blood vessels. The pancreatic section from the DC group shows significant and severe fatty degeneration distributed widely within the pancreatic acinar cells. Furthermore, most pancreatic acini display clear fatty vacuoles within their lining epithelial cells. It also reveals a clear pancreatic duct. The pancreatic section from the CP group shows significant morphological regeneration in the pancreatic Islets of Langerhans with mild fatty degenerative changes within their cellular construction. It also displays typical pancreatic acini with clear and regular pancreatic ducts. Pancreatic tissues from LD DOAE show apparent fatty degeneration within the endocrine cellular structure, distributed throughout Langerhans, with the focally accumulated endocrine cells. Moreover, the section demonstrates no evident lesions within the pancreatic acinar cells. Ultimately, the pancreas from HD DOAE reveals significant widening in some pancreatic ducts, together with the standard morphological structure of most pancreatic acini. On the other hand, pancreatic Islets of Langerhans show acidophilic degenerative changes within their endocrine cells, which appear focally aggregated (Figure 3).
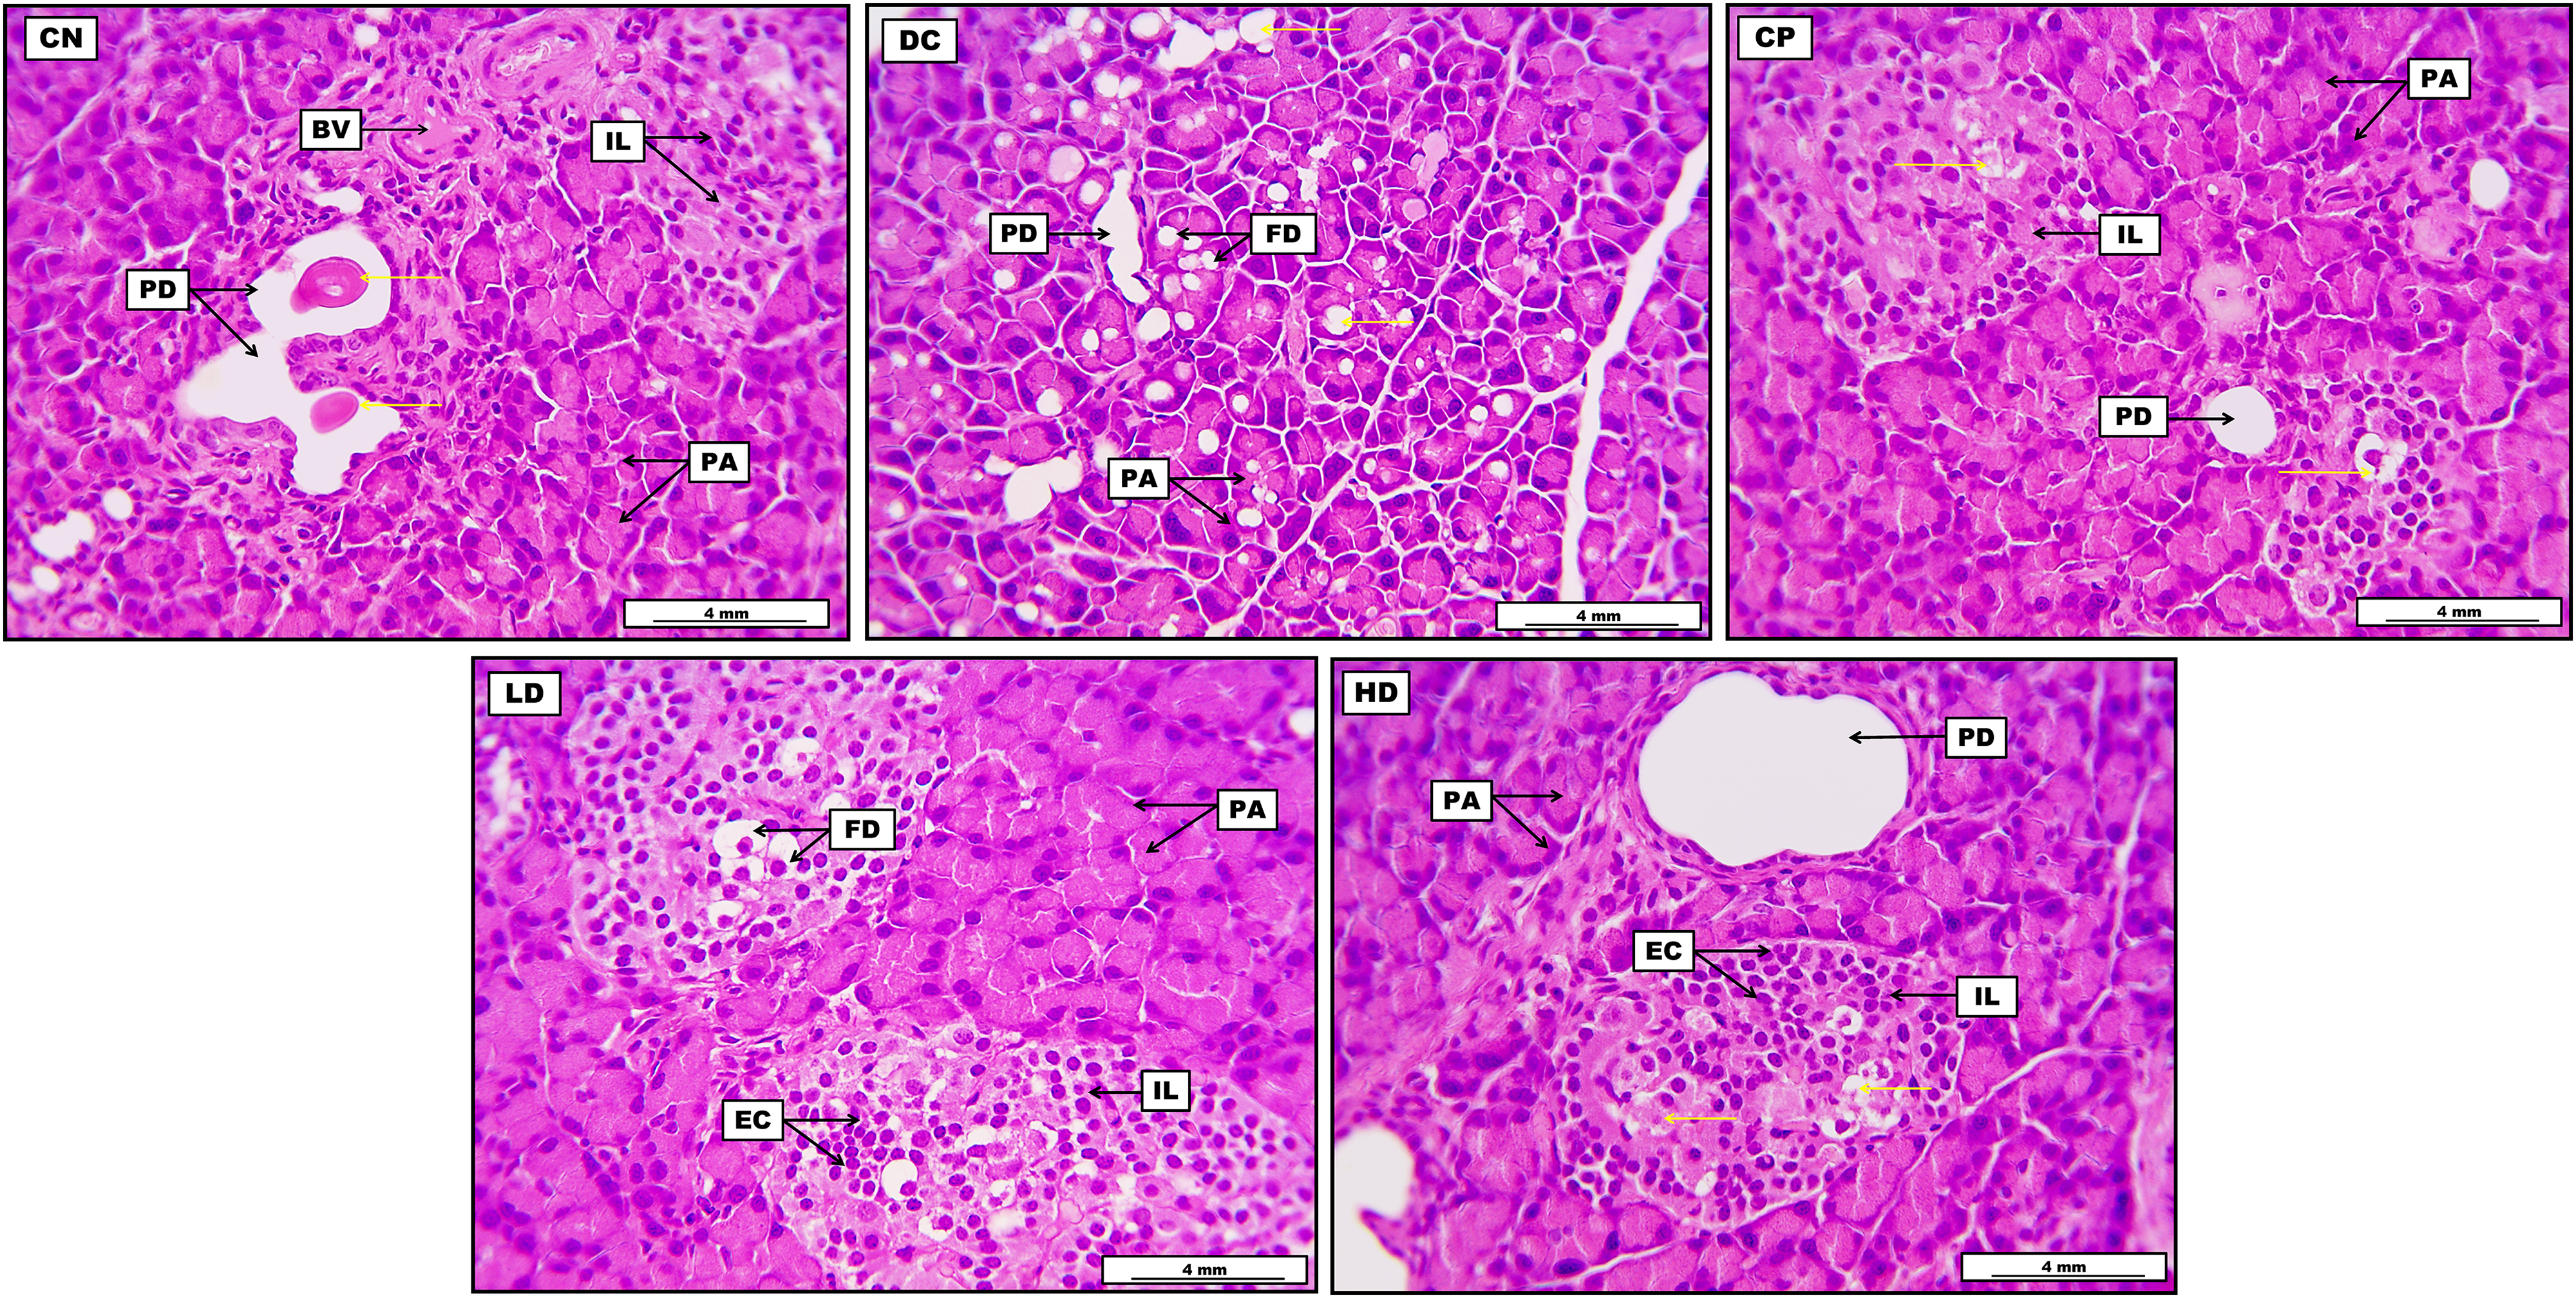
Photomicrograph of the pancreas from the control negative group (CN) demonstrates the standard morphological appearance of pancreatic acini (PA), together with typically placed Islet of Langerhans (IL) evident by regular cellular arrangement. The image also elucidates the presence of cross-sectional structures of typical pancreatic ducts (PD) with pinkish secretion in their lumina (yellow arrows), together with some blood vessels (BV). The pancreas from the diabetic control group (DC) shows significant and severe fatty degeneration (FD) distributed widely within the pancreatic acinar cells (yellow arrows). Furthermore, most of the PA in the given section display clear fatty vacuoles within their lining epithelial cells. The section also reveals the presence of clear PD. The pancreas from the control positive group (CP) shows significant morphological regeneration in the pancreatic IL with the presence of mild fatty degenerative changes (yellow arrows) within their cellular construction. Furthermore, the section also displays typical morphological histology of the PA with clear and regular pancreatic duct. The low-dose group (LD) pancreas shows clear FD within the endocrine cellular structure, distributed throughout the IL, with the focally accumulated endocrine cells (EC). Moreover, the section demonstrates no evident lesions within the pancreatic acinar cells. Pancreas from the high-dose group (HD) reveals significant widening in some PD and the standard morphological structure of most PA in the given section. On the other hand, pancreatic IL shows acidophilic degenerative changes (yellow arrows) within their endocrine cells, which appear focally aggregated.
Expression of miR-21, miR-24, and miR-126
The serum of diabetic rats showed significant up-regulation (increase) of miR-21 and down-regulation (decrease) of miR-24 and miR-126 compared to normal control rats. Diabetic rats treated with DOAE (100 and 200 mg/kg) or GLB showed a significant decrease in the expression levels of miR-21 and an increase in the levels of miR-24 compared to DC rats (Figures 4 to 6).

Expression of serum miR-21 in control negative (CN), diabetic control (DC), control positive (CP) and methanolic extract of Dianthus orientalis Adams (100 and 200 mg/kg). miR-21 was upregulated in the DC group.

Expression of serum miR-24 in control negative (CN), diabetic control (DC), control positive (CP), and methanolic extract of Dianthus orientalis Adams (100 and 200 mg/kg). miR-24 was downregulated in the diabetic control group.

Expression of serum miR126 in control negative (CN), diabetic control (DC), control positive (CP) and methanolic extract of Dianthus orientalis Adams (100 and 200 mg/kg). miR126 was downregulated in the diabetic control group.
Discussion
Medicinal plants can be used as alternatives to synthetic medications in treating DM. Their antidiabetic mechanisms include vital targets such as α-glucosidase, α-amylase, dipeptidyl peptidase-4 (DPP-4), glitazone (PPAR-γ), protein tyrosine phosphatase 1B (PTP1B), and insulin-dependent protein–glucose transporter (GLUT4). Additionally, some herbaceous plants improve hyperglycemia and insulin resistance through the adenosine monophosphate-activated protein kinase (AMPK) signaling pathway. 17 Thus, this study aimed to investigate the antidiabetic effect of DOAE in a rat model of hyperglycemia using various parameters.
Consequently, the present study findings suggested that methanolic extract of both DOAE treatments positively affected body weights in diabetic rats. This protective effect may be through inhibiting hepatic gluconeogenesis and glucose output from the liver, which is accompanied by suppressing lipolysis in adipose tissue. 18 This result is consistent with another study,7,9 which reported increased body weights of diabetic rats treated with ethanol extract from Ginkgo biloba, Momordica charantia, and Pterocarpus santalinoides, respectively. A gradual increase in body weights of GLB-treated groups was done by increasing endogenous insulin levels. The anabolic impacts of insulin can enhance the synthesis of proteins while suppressing both lipolysis and proteolysis, leading to an increase in lean body mass.19,20 Meanwhile, the body weight of the untreated diabetic group was reduced significantly, possibly due to the breakdown of tissue proteins and muscle wasting in diabetic rats. 21
Additionally, DOAE (100 and 200 mg/kg) and GLB in diabetic rats significantly reduced blood glucose levels compared to DC rats, which agrees with the findings of another study. 22 This action shows that DOAE can prevent the development of diabetes-associated complications. There are various mechanisms for the hypoglycemic activity of medicinal plants, including improvement of insulin sensitivity of target cells, enhanced insulin secretion stimulating the regeneration of β-cells of Islets of Langerhans in the pancreas, 23 inhibition of glucose absorption from the intestine and glucose production from hepatocytes. 24
This study observed decreased levels of antioxidants in diabetic rats compared to CN rats. The reduction of antioxidant activity reflects the oxidative stress in diabetic rats that may be due to the generation of free radicals by the polyol pathway, 25 auto-oxidation of glucose, 26 glycosylation in hyperglycemic conditions, 27 as well as STZ-mediated generation of ROS by its nitrogen oxide (NO) donor property to the intracellular molecules. 28 Also, DOAE possesses phytochemicals with antioxidant and free radical scavenging effects, which agree with previous studies on Dianthus to exhibit potent antioxidative properties.29,30 This could be due to bioactive compounds in crude extracts that can mop up free radicals and modulate the expression of genes involved in the antioxidant defense system, leading to increased activity of antioxidant enzymes. 31 This property was also found in D. caryophyllus, which contained specific compounds such as phenols and flavonoids.32,33 Thus, phenolic compounds are the main antioxidant substances that neutralize ROS by scavenging free radicals. Meanwhile, flavonoids prevent oxidative stress development by inhibiting enzymes producing free radicals. 34
The outcome of this research has further verified the increases in plasma TG, TC, VLDL, and LDL, and the decrease in HDL indicated significant dyslipidemia in DC rats. Dyslipidemia is a common feature of diabetes, regardless of whether they have insufficient insulin or insulin resistance. 35 In diabetes, a reduction in lipoprotein lipase activity, an enzyme responsible for breaking down TG and VLDL, occurs due to insulin deficiency. This diminished lipoprotein lipase activity is associated with increased plasma TG and decreased HDL, leading to elevated levels of TC and LDL. 36 These alterations in lipid profiles increase the risk of coronary heart disease in patients with DM. 37 The lipid profile of the rats treated with DOAE showed a significant decrease in TG, LDL, VLDL, and TC and a substantial increase in HDL, especially in HDs, compared to the DC group. The antihyperlipidemic efficacy of a DOAE may be attributed to the inhibition of HMG-CoA reductase and pancreatic lipase. 38 Hydrolyzing TG by pancreatic lipase into glycerol and fatty acids is a crucial step for absorption through the lining of the intestine, and inhibition of pancreatic lipase can prevent the development of hyperlipidemia by decreasing the absorption of dietary fat.39,40 HMG-CoA reductase is the first and critical rate-limiting enzyme in the mevalonate pathway, and its inhibition is a primary step in treating hyperlipidemia through decreasing endogenous cholesterol synthesis. Controlling hyperlipidemia is essential for preventing diabetic complications, microangiopathy, and macroangiopathy. 41
The levels of TSB, ALT, AST, and ALP in the serum of diabetic rats and urea in DOAE-treated groups were significantly lower when compared with DC rats (P < .05). These results indicate the hepato- and nephroprotective effect of plant extracts. Our outcomes aligned with those of Ahmad et al who discovered that DOA leaves aqueous extract in rabbits has hepato- and nephroprotective capabilities. 30 The decreasing trend in the serum levels of the above enzymes to average values following treatment with plant extract may be due to cell membrane stability and cellular regeneration. 9
Vital organs (liver, kidney and pancreas) are the target organs for diabetic complications. In this study, the histopathological examination of the pancreas, liver, and kidney sections from the DC group showed massive pathological changes compared to the standard structure observed in the CN group. These outcomes are also found in another study. 42 At the same time, treatments with DOAE in diabetic rats were found to be quite effective in partially restoring the disturbed histopathologic profile of rats towards normal conditions. This study shows the antidiabetic potential of DOAE and strengthens the idea of using this plant as an adjuvant therapy/supplement against diabetes. Until now, there has been no research in the literature regarding the histopathological effect of any species of Dianthus in diabetic rats. Thus, we could not compare our results to any other study. However, the antidiabetic effects and partial restoration of damaged tissues in animals treated with various plant products at multiple doses and periods were reported in different studies. 9 All these findings indicate that natural plant products have regenerative effects and can preserve vital tissue damage, and consequently, prophylactic administration of DOA could mitigate DM complications.
Recent research has suggested that alterations in the expression of miRNAs play a critical role in the pathogenesis of diabetes and its related complications, including diabetic retinopathy, diabetic nephropathy, diabetic cardiomyopathy, and diabetic neuropathy. 9 In the current study, miRNA-21 level was significantly upregulated in the serum of the DC rats. Many studies have reported that miR21 is frequently upregulated in all types of diabetes. 9 miRNA-21 regulates various biological processes, including cell proliferation, apoptosis, differentiation, and migration. 43 Overexpression of miR-21 was reported to increase β-cell apoptosis during diabetes development in T1DM animal models. 44 The current study reported a significant reduction in the expression levels of miR-24 in DC rats compared to CN rats. These results were further confirmed in another study, which found that hyperglycemia is associated with decreased levels of miR-24 in diabetic humans, mouse blood samples, and cultured endothelial cells. 45 Additionally, many studies reported that the downregulation of miR-24 is associated with diabetes and its related complications. 9 Another study suggested that the downregulation of miR-24 in diabetes increases the risk of diabetic thrombotic and vascular complications. 46 Hyperglycemia-induced repression of miR-24 increases Von Willebrand factor (VWF) expression and secretion in DM, which is associated with an increased risk of thrombotic cardiovascular events. 45 VWF is a glycoprotein crucial to primary hemostasis, the initial stage of blood clot formation following injury to blood vessels. It promotes platelet adhesion to the subendothelial collagen exposed at the site of vascular injury, which is crucial to forming a platelet plug to stop bleeding. 47
Moreover, in the present study, we demonstrated a reduction in the expression levels of miR-126 in DC rats compared to CN rats. Studies have shown that decreased levels of miR-126 are associated with diabetes and its related complications. 9 miR-126 is a crucial regulator of angiogenesis and maintains vascular homeostasis. 48 The downregulation of miR-126 has been observed in serum, plasma, and aqueous humor of diabetic retinopathy in humans and animal models. 49 miR-126 contributes to the pathogenesis of diabetic retinopathy and involves multiple processes, including cell viability, cell proliferation, neovascularization, and angiogenesis. 50
The limitation of this study was that it did not have a well-equipped laboratory and research facilities to conduct more parameters such as microarray and protein profiling. Also, the late receiving of materials and chemicals from reputable companies overseas was another obstacle.
Conclusions
The methanolic extract of DOA’s leaves exerted significant antihyperglycemic, anti-dyslipidemia and hepato-renal protective effects in STZ-induced diabetic rats. miR-21, miR-24, and miR-126 are common diabetic blood biomarkers in rat models of hyperglycemia. The crude extracts could be a promising natural antioxidant agent in managing oxidative stress diseases. More research is required to be directed to measure the pharmacokinetics, pharmacodynamics, and beneficial effects of DOAE in vivo to authorize its effectiveness for biomedical applications.
Footnotes
Acknowledgments
The authors thank the College of Medicine and the University of Sulaimani authorities for supporting and assisting this study.
Author Contributions
VAA: methodology, data collection, prepared tables and figures, writing the original manuscript. HSR: conceptualization, supervision, study registration, written the original manuscript. MOMR: supervision, resources, study administration, edition, revision, and correction of the original manuscript. HHO: histopathological analysis, written in the original manuscript. MA: methodology, data analysis, writing the original manuscript. KHI: methodology, data analysis. All authors agreed to submit the manuscript.
Data Availability
The datasets used and analyzed during the current study are all provided in the manuscript.
Declaration of Conflicting Interests
The authors declared no potential conflicts of interest with respect to the research, authorship, and/or publication of this article.
Funding
The authors disclosed receipt of the following financial support for the research, authorship, and/or publication of this article: The authors would like to appreciate the Deanship of Scientific Research at Imam Mohammad Ibn Saud Islamic University (IMSIU), which supported and funded this work (Grant No. IMSIU-RP23103).