
Abstract
Coronary microvascular disease poses significant clinical harm and is closely associated with major cardiovascular adverse events. Existing research has highlighted coronary microvascular embolism (CME) as an important factor. Previous studies have utilized microspheres to construct a mouse model of CME, which can partially simulate coronary microvascular disease. However, there are notable discrepancies from the clinical reality. Shexiang Tongxin Dropping Pill (SXDP), a traditional Chinese patent medicine, is widely used in Chinese hospitals for treating coronary heart disease. Our preliminary research has indicated that SXDP effectively alleviates chest pain symptoms and improves coronary thrombolysis in myocardial infarction (TIMI) blood flow in patients with angina pectoris. Nonetheless, the specific mechanism remains unclear. To address this, the current study aimed to explore the size and concentration of autologous thrombotic particles to construct a CME mouse model, taking reference from previous studies on microsphere parameters (size: 9 µm; concentration: 500 000/50 µl). Additionally, we aimed to observe the effect of SXDP on coronary microvascular blood flow in this model. The experiments revealed that the average size of 400-mesh thrombus particles closely approximated 9 µm, and the concentration suspension at a ratio of 1 : 0.15, with a volume of 50 µl, contained approximately 500 000 particles. Concurrently, we observed that 400-mesh blood clot particles induced T-wave elevation in the electrocardiogram, decreased region of interest value in laser speckle examination, downregulated CD31 and Lectin in vascular endothelium, caused thrombosis in coronary microvessels, and led to myocardial infarction. Moreover, a decrease in serum nitric oxide levels and an increase in endothelin-1 (ET-1) were observed. Furthermore, we investigated the effects of SXDP on this animal model and identified potential mechanisms underlying its ability to reverse the aforementioned pathological changes. The research findings suggest that 400-mesh blood clot particles can successfully establish a CME mouse model, and SXDP can improve coronary microvascular blood perfusion, potentially through the improvement of endothelial function.
Keywords
Introduction
Coronary microembolization is usually caused by the spontaneous rupture of atherosclerotic plaques or the formation of microthrombi during coronary revascularization.1 These microthrombi are more frequently found at autopsy in patients with plaque erosion who have died suddenly than in those with plaque rupture.2 Microthrombi may induce regional myocardial no-reflow or slow flow phenomena during the treatment of acute coronary syndrome with percutaneous coronary intervention.3 Coronary microvascular embolism (CME) can lead to coronary microvascular dysfunction, myocardial microinfarction, contractile dysfunction, arrhythmias, and even sudden cardiac death.4 Therefore, CME is closely related to major adverse cardiovascular events.5 Despite advancements in treatment protocols, there is currently no optimal therapeutic method for CME.
The mechanism of CME is much more complex and requires more experimental evidence; however, an ideal animal model of CME has not emerged so far. Embolization by intracoronary infusion of microspheres into the coronary microcirculation has been used in large laboratory animals, including dogs and swine.6–8 This procedure requires special equipment and high technical capability, which is not universally feasible. In addition, another mouse model of CME was established by injecting polystyrene microspheres into the left ventricular chamber during a 15-s occlusion of the ascending aorta.9 Despite the low cost of this procedure, myocardial infarction caused by microspheres significantly differs from the pathophysiological processes associated with clinical thrombosis.10 The CME model caused by autologous blood clot particles will closely resemble the actual clinical pathophysiological characteristics.
Shexiang Tongxin Dropping Pill (SXDP) is an herbal formulation of Chinese Medicine, which consists of 7 components: Salvia miltiorrhiza Bunge, Moschus, Bovis calculus artifactus, Bufonis venenum, Borneolum syntheticum, total ginsenoside of ginseng stems and leaves, and Fel Ursi. It is widely used in China for the treatment of cardiovascular diseases.11 A study has demonstrated that SXDP protects against chronic heart failure in mice by inhibiting the ERK/MAPK and TGF-β signaling pathways.12 Meanwhile, SXDP prevents ischemia in rat myocardium through the inhibition of apoptosis of myocardial cells.13 Furthermore, a recent study indicated that SXDP pretreatment improved coronary microvascular dysfunction (CMD) induced by sodium laurate via anti-inflammatory, anti-apoptosis, and antioxidant mechanisms.14 Despite the broad applications of SXDP in treating angina pectoris in Chinese hospitals, there is limited research on its effectiveness in treating CME. The present study investigates the role of SXDP in improving coronary microvascular blood flow using a CME mouse model based on autologous thrombotic particles.
Results
The Average Particle Size of 400-Mesh Autologous Blood Clots Is About 9 µm
Using 9 µm microspheres (Figure 1A) as a standard control, the particle sizes of 400-, 800-, and 1000-mesh blood clots (Figure 1D) were measured by fully automatic flow cytometry. The results showed that both microspheres and 400-mesh blood clots were close to 9 µm in size (Figure 1B, C, and E). Further analysis using the Novocyte Flow cytometer to determine FSC-A and FSC-H of particles also indicated that 400-mesh blood clot particles had similar parameters to 9 µm microspheres (Figure 1G-L).

Screening of blood clot particle parameters (A) physical image of 9 µm microspheres. (B) Histogram showing particle sizes and quantities in 1 µl of 50 mg/ml 9 µm microspheres determined by fully automatic flow cytometry. (C) The average diameter of 1 µl of 50 mg/ml 9 µm microspheres and suspensions of blood clots with different particle sizes determined by fully automatic flow cytometry, along with the statistical analysis (n = 6). Values represent the mean ± SD. ns: P > .05 versus the microsphere group; ***P < .001 versus the microsphere group. (D) Physical image of 400-mesh autologous blood clot particles and a 1 : 0.15 suspension. (E) Histogram showing particle sizes and quantities in 1 µl of 1:0.15 400-mesh particles determined by automatic flow cytometry. (F) The particle numbers in 1 µl of 50 mg/ml 9 µm microspheres and 1 µl of different concentrations of 400-mesh particles determined by automatic flow cytometry, along with the statistical analysis (n = 6). Values represent the mean ± SD. ns: P > .05 versus the microsphere group; *P < .05 versus the 1:0.15 concentration group. (G-J) Scatter plots of FSC-A and FSC-H of 9 µm microspheres and blood clot particles of different sizes measured by flow cytometry. From top to bottom, they are the microsphere group, 400-mesh particle group, 800-mesh particle group, and 1000-mesh particle group. (K) The value of FSC-A statistical analysis in 9 µm microspheres and blood clot particles of different sizes (n = 6). Values represent the mean ± SD. ns: P > .05 versus the microsphere group; ***P < .001 versus the microsphere group. (L) The value of FSC-H statistical analysis in 9 µm microspheres and blood clot particles of different sizes (n = 6). Values represent the mean ± SD. ns: P > .05 versus the microsphere group; ***P < .001 versus the microsphere group.
The Particle Number at a Concentration of 1:0.15 Is Close to 105/10 µl
To determine the concentration of the blood clot particulate suspension, 400-mesh blood clot particles were prepared at concentrations of 1:0.1, 1:0.15, 1:0.2, 1:0.25, and 1:0.5, respectively. The number of particles in a 10 µl suspension was measured by fully automatic flow cytometry. The results showed that the number of particles in a concentration of 1:0.15 suspension was closest to 10^5/10 µl (Figure 1F).
The T-Wave Amplitude of the Electrocardiogram Significantly Increased in the 400-Mesh Particle Model
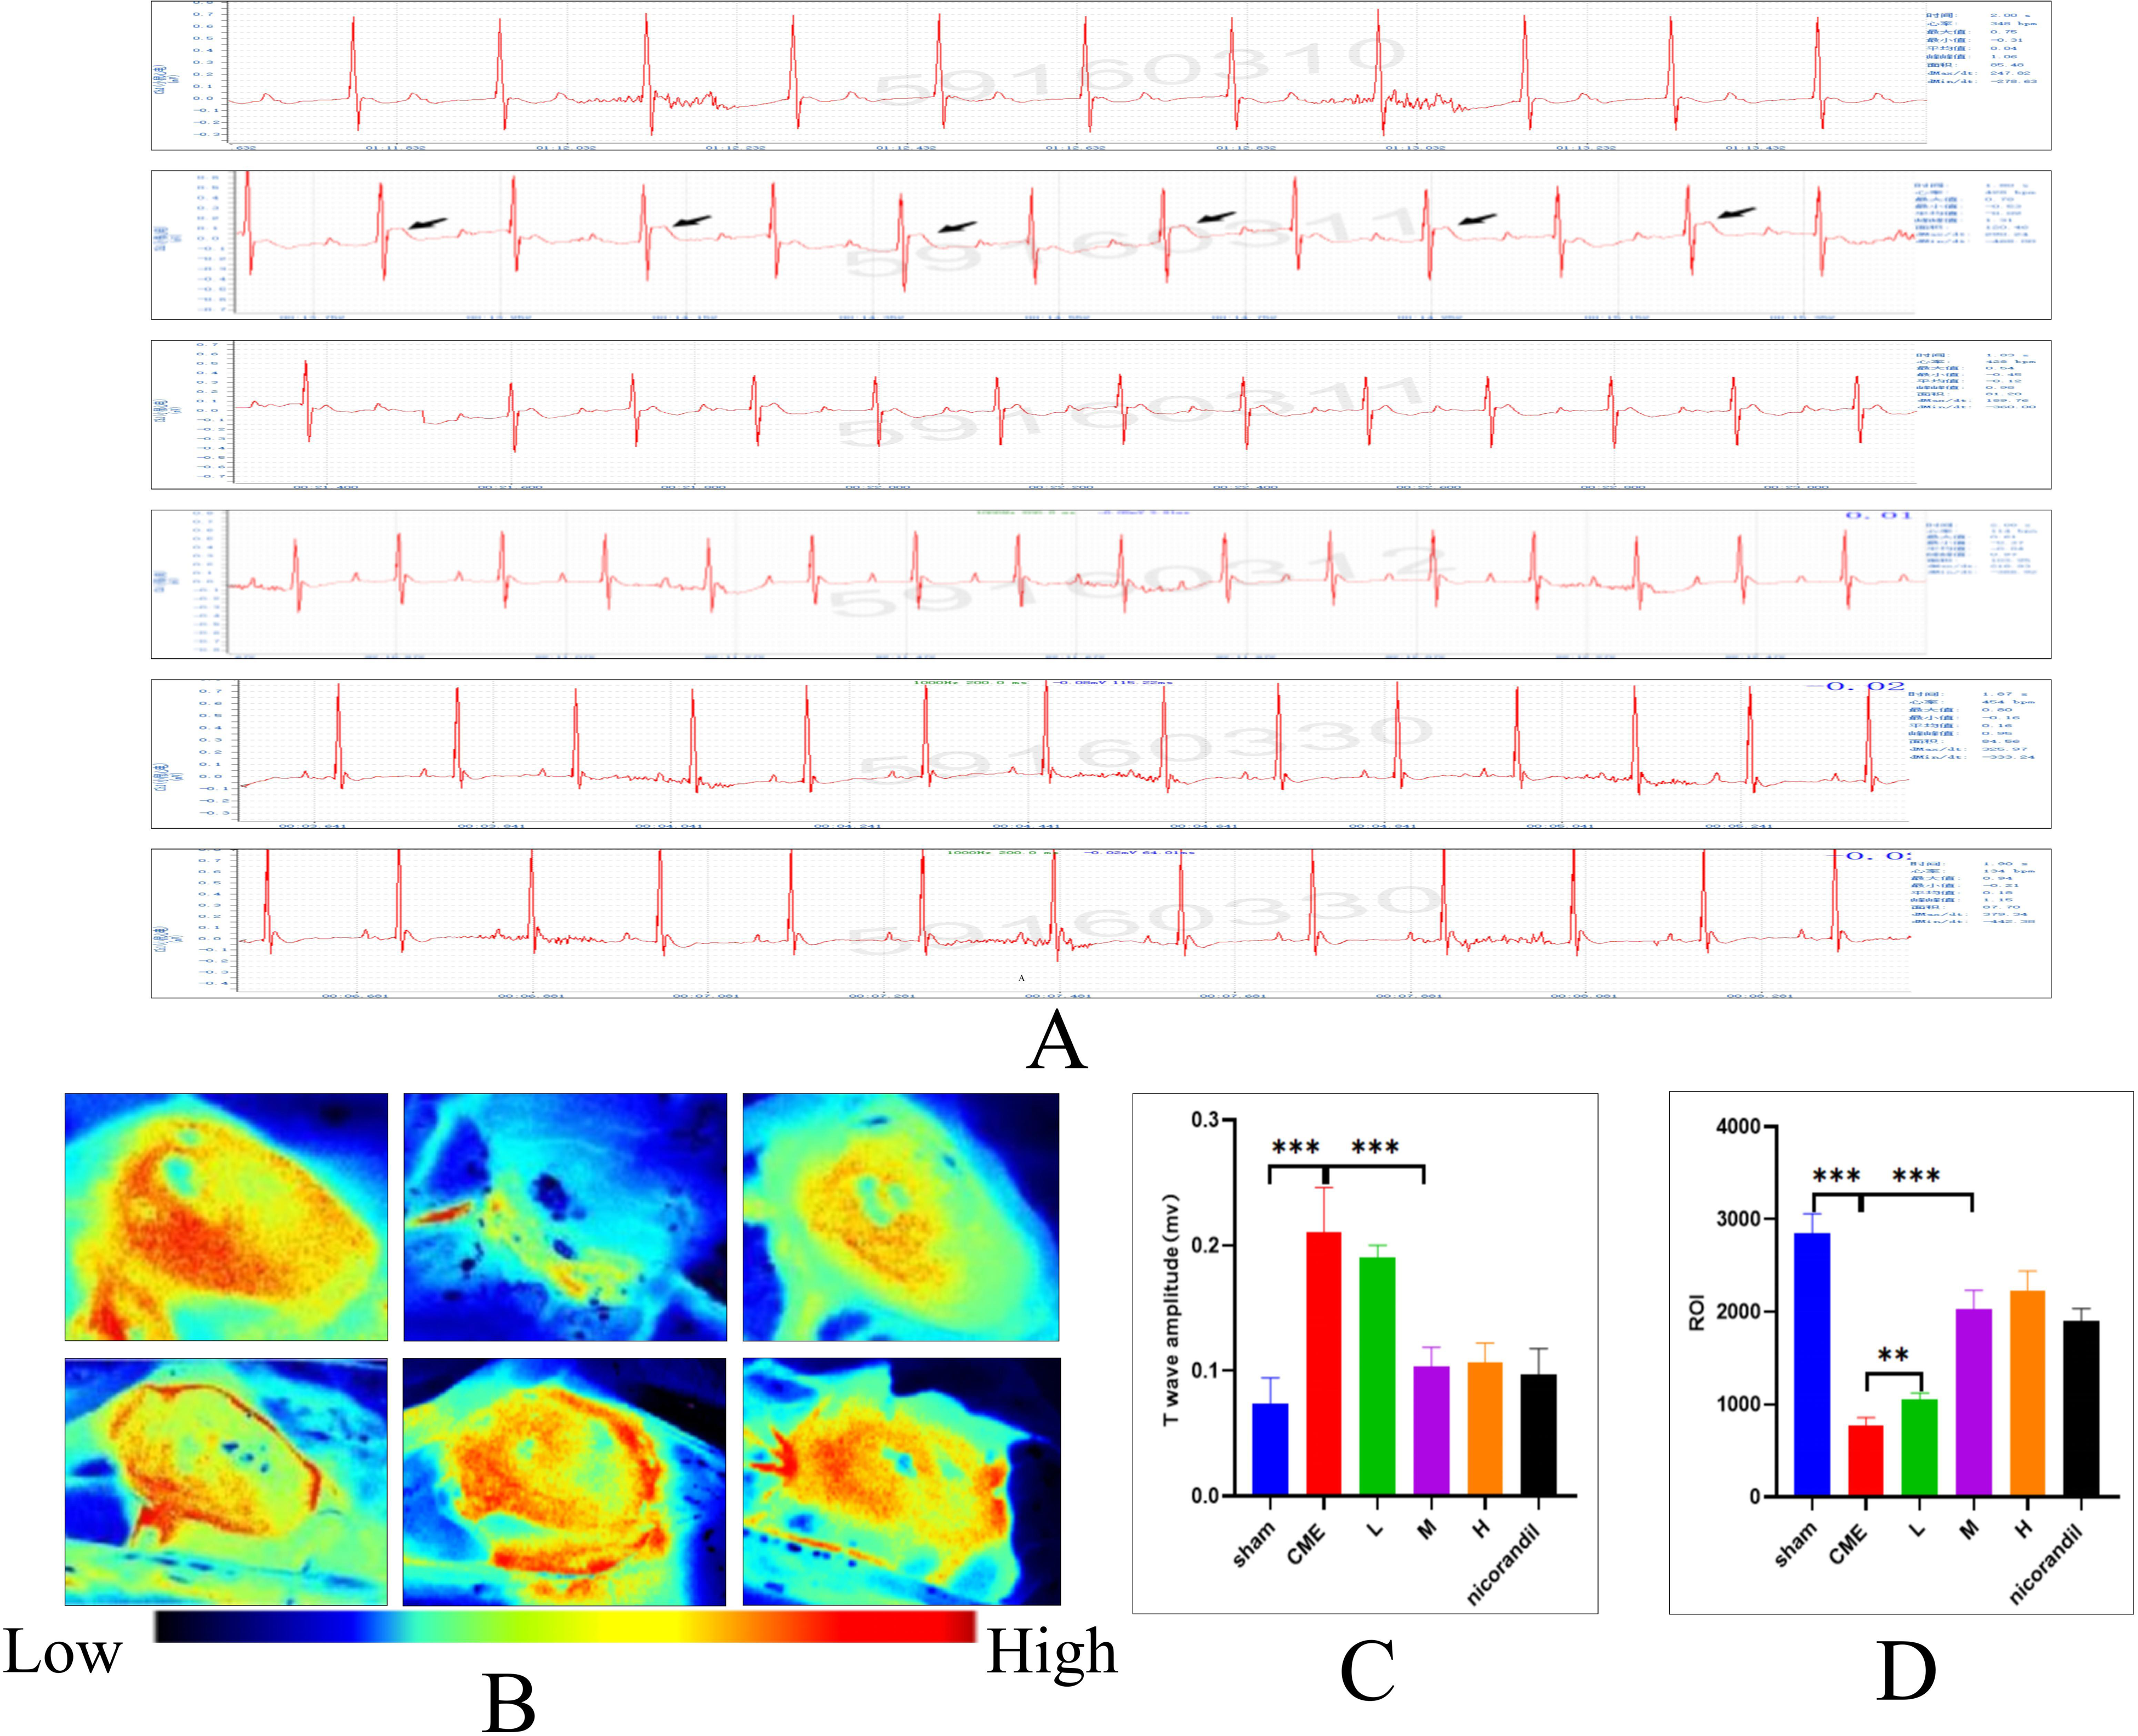
Elevated T-wave amplitude in electrocardiogram often indicates coronary artery disease leading to myocardial ischemia. In this experiment, at 12 h after CME surgery, the T-wave elevation in the electrocardiogram of the 400-mesh blood clot particle model animal showed a statistically significant difference compared to the sham operation group. However, there was no statistically significant difference compared to the 9 µm microsphere group (Figure 2A and C).

Evaluation of CME model through electrocardiogram and laser speckle examination (A) representative electrocardiograms of the 5 groups at 12 h after surgery. From top to bottom, they are the sham surgery group, 9 µm microsphere group, 400-mesh blood clot particle group, 800-mesh blood clot particle group, and 1000-mesh blood clot particle group, respectively. (B) Representative cardiac laser speckle patterns of the 5 groups at 12 h after surgery. From left to right, they are the sham surgery group, 9 µm microsphere group, 400-mesh blood clot particle group, 800-mesh blood clot particle group, and 1000-mesh blood clot particle group, respectively. (C) Comparison of T-wave amplitudes in the electrocardiogram among each group (n = 6). Values denote the mean ± SD; ***P < .001 versus the sham group; ns P > .05 versus the microsphere group; ns P > .05 versus the sham group. (D) Comparison of cardiac laser speckle ROI values among different groups (n = 6). Values denote the mean ± SD; ***P < .001 versus the sham group; ns P > .05 versus the microsphere group.
Reduction in Cardiac Laser Speckle Region of Interest (ROI) at 12 h After Surgery in 400-Mesh Particulate Model Animals
The laser speckle ROI value reflects intravascular blood flow. In this study, the heart laser speckle ROI values of the sham surgery group, microsphere group, 400-mesh particle group, 800-mesh particle group, and 1000-mesh particle group were measured. The results showed that the ROI of the 400-mesh particle group was comparable to that of the microsphere group, and the difference was not statistically significant. Both groups showed a reduction compared to the sham surgery group, and the difference was statistically significant (Figure 2B and D).
The Expression of CD31 and Tomato Lectin in Coronary Microvascular Endothelium Decreased in the 400-Mesh Blood Clot Particle Group
CD31 protein and Lectin protein serve as markers for microvascular endothelial cells, and their expression levels reflect the activity of endothelial cells. In this experiment, the expression of CD31 and lectin in the hearts of 5 model animals was measured using an immunofluorescence protocol. The results showed a decrease in red fluorescence reflecting CD31 protein and green fluorescence reflecting Lectin in both the 400-mesh particle group and the microsphere group. The difference was statistically significant compared to the sham operation group (Figure 3A, D, and E).

Evaluation of CME model through IF assay, myocardial H&E staining, and Heidenhain staining. (A) Representative images of CD31 (red) and tomato lectin (green) immunofluorescence in coronary microvascular endothelial cells. Scale bar: 20 µm. (B) Representative H&E staining images of myocardial thrombosis. From left to right, they are the sham surgery group, 9 µm microsphere group, 400-mesh blood clot particle group, 800-mesh blood clot particle group, and 1000-mesh blood clot particle group, respectively. Original magnification: ×40. Scale bar: 50 µm. (C) Representative Heidenhain staining images of myocardial microinfarction. From left to right, they are the sham surgery group, 9 µm microsphere group, 400-mesh blood clot particle group, 800-mesh blood clot particle group, and 1000-mesh blood clot particle group, respectively. Original magnification: ×10. Scale bar: 50 µm. (D) Immunofluorescence assay for the expression of CD31 in each group (n = 6). Values denote the mean ± SD. ***P < .001 versus the sham group; ns P > .05 versus the microsphere group. (E) Immunofluorescence assay for the expression of lectin in each group (n = 6). Values denote the mean ± SD. ***P < .001 versus the sham group; ns P > .05 versus the microsphere group. (F) H&E staining was used to measure the myocardial thrombotic area in each group (n = 6). Values denote the mean ± SD. ***P < .001 versus the sham group; ns P > .05 versus the microsphere group. (G) Heidenhain staining was used to measure the myocardial microinfarct area in each group (n = 6). Values denote the mean ± SD. **P < .01 versus the sham group; ns P > .05 versus the microsphere group.
Coronary Thrombosis Area Increased in the 400-Mesh Blood Clot Particle Group
H&E staining technology was applied to observe the status of coronary artery thrombosis at 12 h after CME surgery. Compared to the sham operation group, the 400-mesh blood clot particle group exhibited an increase in the coronary thrombosis area, and the difference was statistically significant. However, there was no statistically significant difference between the 400-mesh blood clot particle group and the 9 µm microspheres group (Figure 3B and F).
Myocardial Microinfarct Area Increased in the 400-Mesh Blood Clot Particle Group
At 12 h after surgery, myocardial Heidenhain staining was performed on all model evaluation animals. The results showed the formation of microinfarcts in the myocardium of the 5 groups. Compared to the sham operation group, the 400-mesh blood clot particle group exhibited a larger infarct area, and the difference was statistically significant. However, when compared to the 9 µm microspheres group, the difference was not statistically significant (Figure 3C and G).
In the 400-Mesh Blood Clot Particle Group, the Serum Nitric Oxide (NO) Level Decreased, While the endothelin-1 (ET-1) Level Increased
Serum NO and ET-1 levels reflect vascular endothelial function, and significant pathological changes in CME include microvascular endothelial injury. In this study, control, sham, and CME animals were tested for serum NO and ET-1 levels at 12 h after surgery. The results showed a decrease in serum NO level and an increase in ET-1 level in the CME group. The difference was statistically significant compared to the sham group (Figure 4A and B).

Evaluation of CME model through serum NO and endothelin-1 (ET-1) levels. (A) Determination of serum NO content in the control group, sham group, and CME group by ELISA (n = 6). Values denote the mean ± SD; ns P > .05 versus the control group; ***P < .001 versus the control group; **P < .01 versus the sham group. (B) Determination of serum ET-1 content in the control group, sham group, and CME group by ELISA (n = 6). Values denote the mean ± SD; ns P > .05 versus the control group; ***P < .001 versus the control group; ***P < .001 versus the sham group.
Successful Establishment of the CME Model at 12 h After Surgery
To determine the optimal time point for successful modeling of CME after surgery, animals were divided into a sham group and a CME group. The electrocardiogram, laser speckle, and histopathological changes were observed in both groups at 0, 12, and 24 h after surgery. The results showed significant changes in the electrocardiogram, laser speckle, and histopathological characteristics at 12 h after surgery. These changes were statistically significant compared to 0 h after surgery, while there was no statistically significant difference compared to 24 h after surgery. These findings indicate that the CME model can be successfully established at 12 h after surgery (Figure 5A-Q).

Determination of the optimal time point for successful model construction after CME surgery. (A) Representative electrocardiograms at 0, 12, and 24 h after surgery in the sham group. (B) Representative electrocardiograms at 0, 12, and 24 h after surgery in the CME group. (C) Representative images of cardiac laser speckle at 0, 12, and 24 h after surgery in the sham group. (D) Representative images of cardiac laser speckle at 0, 12, and 24 h after surgery in the CME group. (E) Representative Heidenhain staining images of myocardium at 0, 12, and 24 h after surgery in the sham group. Original magnification ×10, Scale bar: 50um. (F) Representative Heidenhain staining images of myocardial microinfarctions (black-stained parts) at 0, 12, and 24 h after surgery in the CME group. Original magnification ×10, Scale bar: 50 µm. (G) Comparison of T-wave amplitude of electrocardiogram at different postoperative times between the sham surgery group and the CME surgery group (n = 6). Values denote the mean ± SD; ***P < .001 versus the sham group; ***P < .001 versus 0 h; ns P > .05 versus 12 h. (H) Comparison of ROI value of laser speckle at different postoperative times between the sham surgery group and the CME surgery group (n = 6). Values denote the mean ± SD; **P < .01 versus the sham group; ***P < .001 versus the sham group; **P < .01 versus 0 h; ns P > .05 versus 12 h. (I) Comparison of microinfarction area of myocardial Heidenhain staining at different postoperative times between the sham surgery group and the CME surgery group (n = 6). Values denote the mean ± SD; ns P > .05 versus the sham group; ***P < .001 versus the sham group; ns P > .05 versus 12 h. (J-L) Typical fluorescence maps of CD31 (Red) and lectin (Green) expression in coronary microvascular endothelium at 0, 12, and 24 h after surgery in the sham surgery group. Scale bar: 20um. (M-O) Typical fluorescence maps of CD31 (Red) and lectin (Green) expression in coronary microvascular endothelium at 0, 12, and 24 h after surgery in the CME surgery group. Scale bar: 20 µm. (P) Comparison of CD31 expression in coronary microvascular endothelium between the sham surgery group and the CME group at 0, 12, and 24 h after surgery (n = 6). Values denote the mean ± SD; ns P > .05 versus the sham group; ***P < .001 versus 0 h; ns P > .05 versus 12 h. (Q) Comparison of lectin expression in coronary microvascular endothelium between the sham surgery group and the CME group at 0, 12, and 24 h after surgery (n = 6). Values denote the mean ± SD; ns P > .05 versus the sham group; ***P < .001 versus 0 h; ns P > .05 versus 12 h.
Except for the Sham Surgery Group, the 7-day Survival Rate of the 400-Mesh Particle Group Was Comparable to That of the Other Groups
The 7-day survival rate of all groups of model animals after surgery was analyzed statistically. Except for the sham surgery group, which had a 100% survival rate, 1 mouse died in each of the microsphere group, 400-mesh particle group, 800-mesh particle group, and 1000-mesh particle group, resulting in a survival rate of approximately 67% for each group. The results indicated that the 7-day survival rate of the 400-mesh particle group was not higher than that of the other groups (Figure 6).

Seven-day survival rate chart for each group after surgery.
SXDP Reduces the T-Wave Amplitude of the Electrocardiogram in CME Model Animals
After administering SXDP for 14 days to CME model animals, an electrocardiogram (ECG) examination was conducted. The results demonstrated that SXDP could reduce the T-wave amplitude of the ECG in CME model animals, with a noticeable effect observed in the medium- and high-dose groups. Compared to the CME group, the difference was statistically significant, while compared to the nicorandil group, the difference was not statistically significant. These findings suggest that SXDP has the potential to improve myocardial blood supply (Figure 7A and C).
SXDP promotes myocardial blood supply in CME model mice. (A) Representative electrocardiograms of the Sham group, CME group, SXDP low-dose group (L), SXDP medium-dose group (M), SXDP high-dose group (H), and nicorandil group. (B) Representative diagrams of heart laser speckle in the sham group, CME group, SXDP low-dose group, SXDP medium-dose group, SXDP high-dose group, and nicorandil group. (C) Statistical analysis of T-wave amplitude in the electrocardiogram (n = 6). Values denote the mean ± SD; ***P < .001 versus the sham group; ***P < .001 versus the CME group; ns P > .05 versus the SXDP-M group. (D) Statistical analysis of the ROI value of cardiac laser speckle blood flow (n = 6). Values denote the mean ± SD; ***P < .001 versus the sham group; ***P < .001 versus the CME group; ns P > .05 versus the SXDP-M group.
SXDP Promotes Coronary Microvascular ROI in CME Model Animals
After 14 days of SXDP administration, cardiac laser speckle examination was performed on CME model animals to observe the improvement in coronary microvascular blood flow. The results revealed that SXDP could increase the ROI value and enhance coronary microvascular blood flow, with the effect being dependent on the dosage. The medium- and high-dose groups of SXDP demonstrated a more pronounced effect compared to the CME group, with a statistically significant difference (Figure 7B and D).
SXDP Increases the Expression of CD31 and Tomato Lectin in Coronary Microvascular Endothelium
After 14 days of SXDP intervention in CME model animals, tomato lectin was injected through the tail vein. Two hours later, the animals were sacrificed to remove their hearts for immunofluorescence testing. The results showed that compared to the CME group, the expression of CD31 and tomato lectin in coronary microvascular endothelial cells increased significantly in the SXDP group. This phenomenon suggests that SXDP can reduce vascular endothelial apoptosis and have a certain protective function (Figure 8A, D, and E).
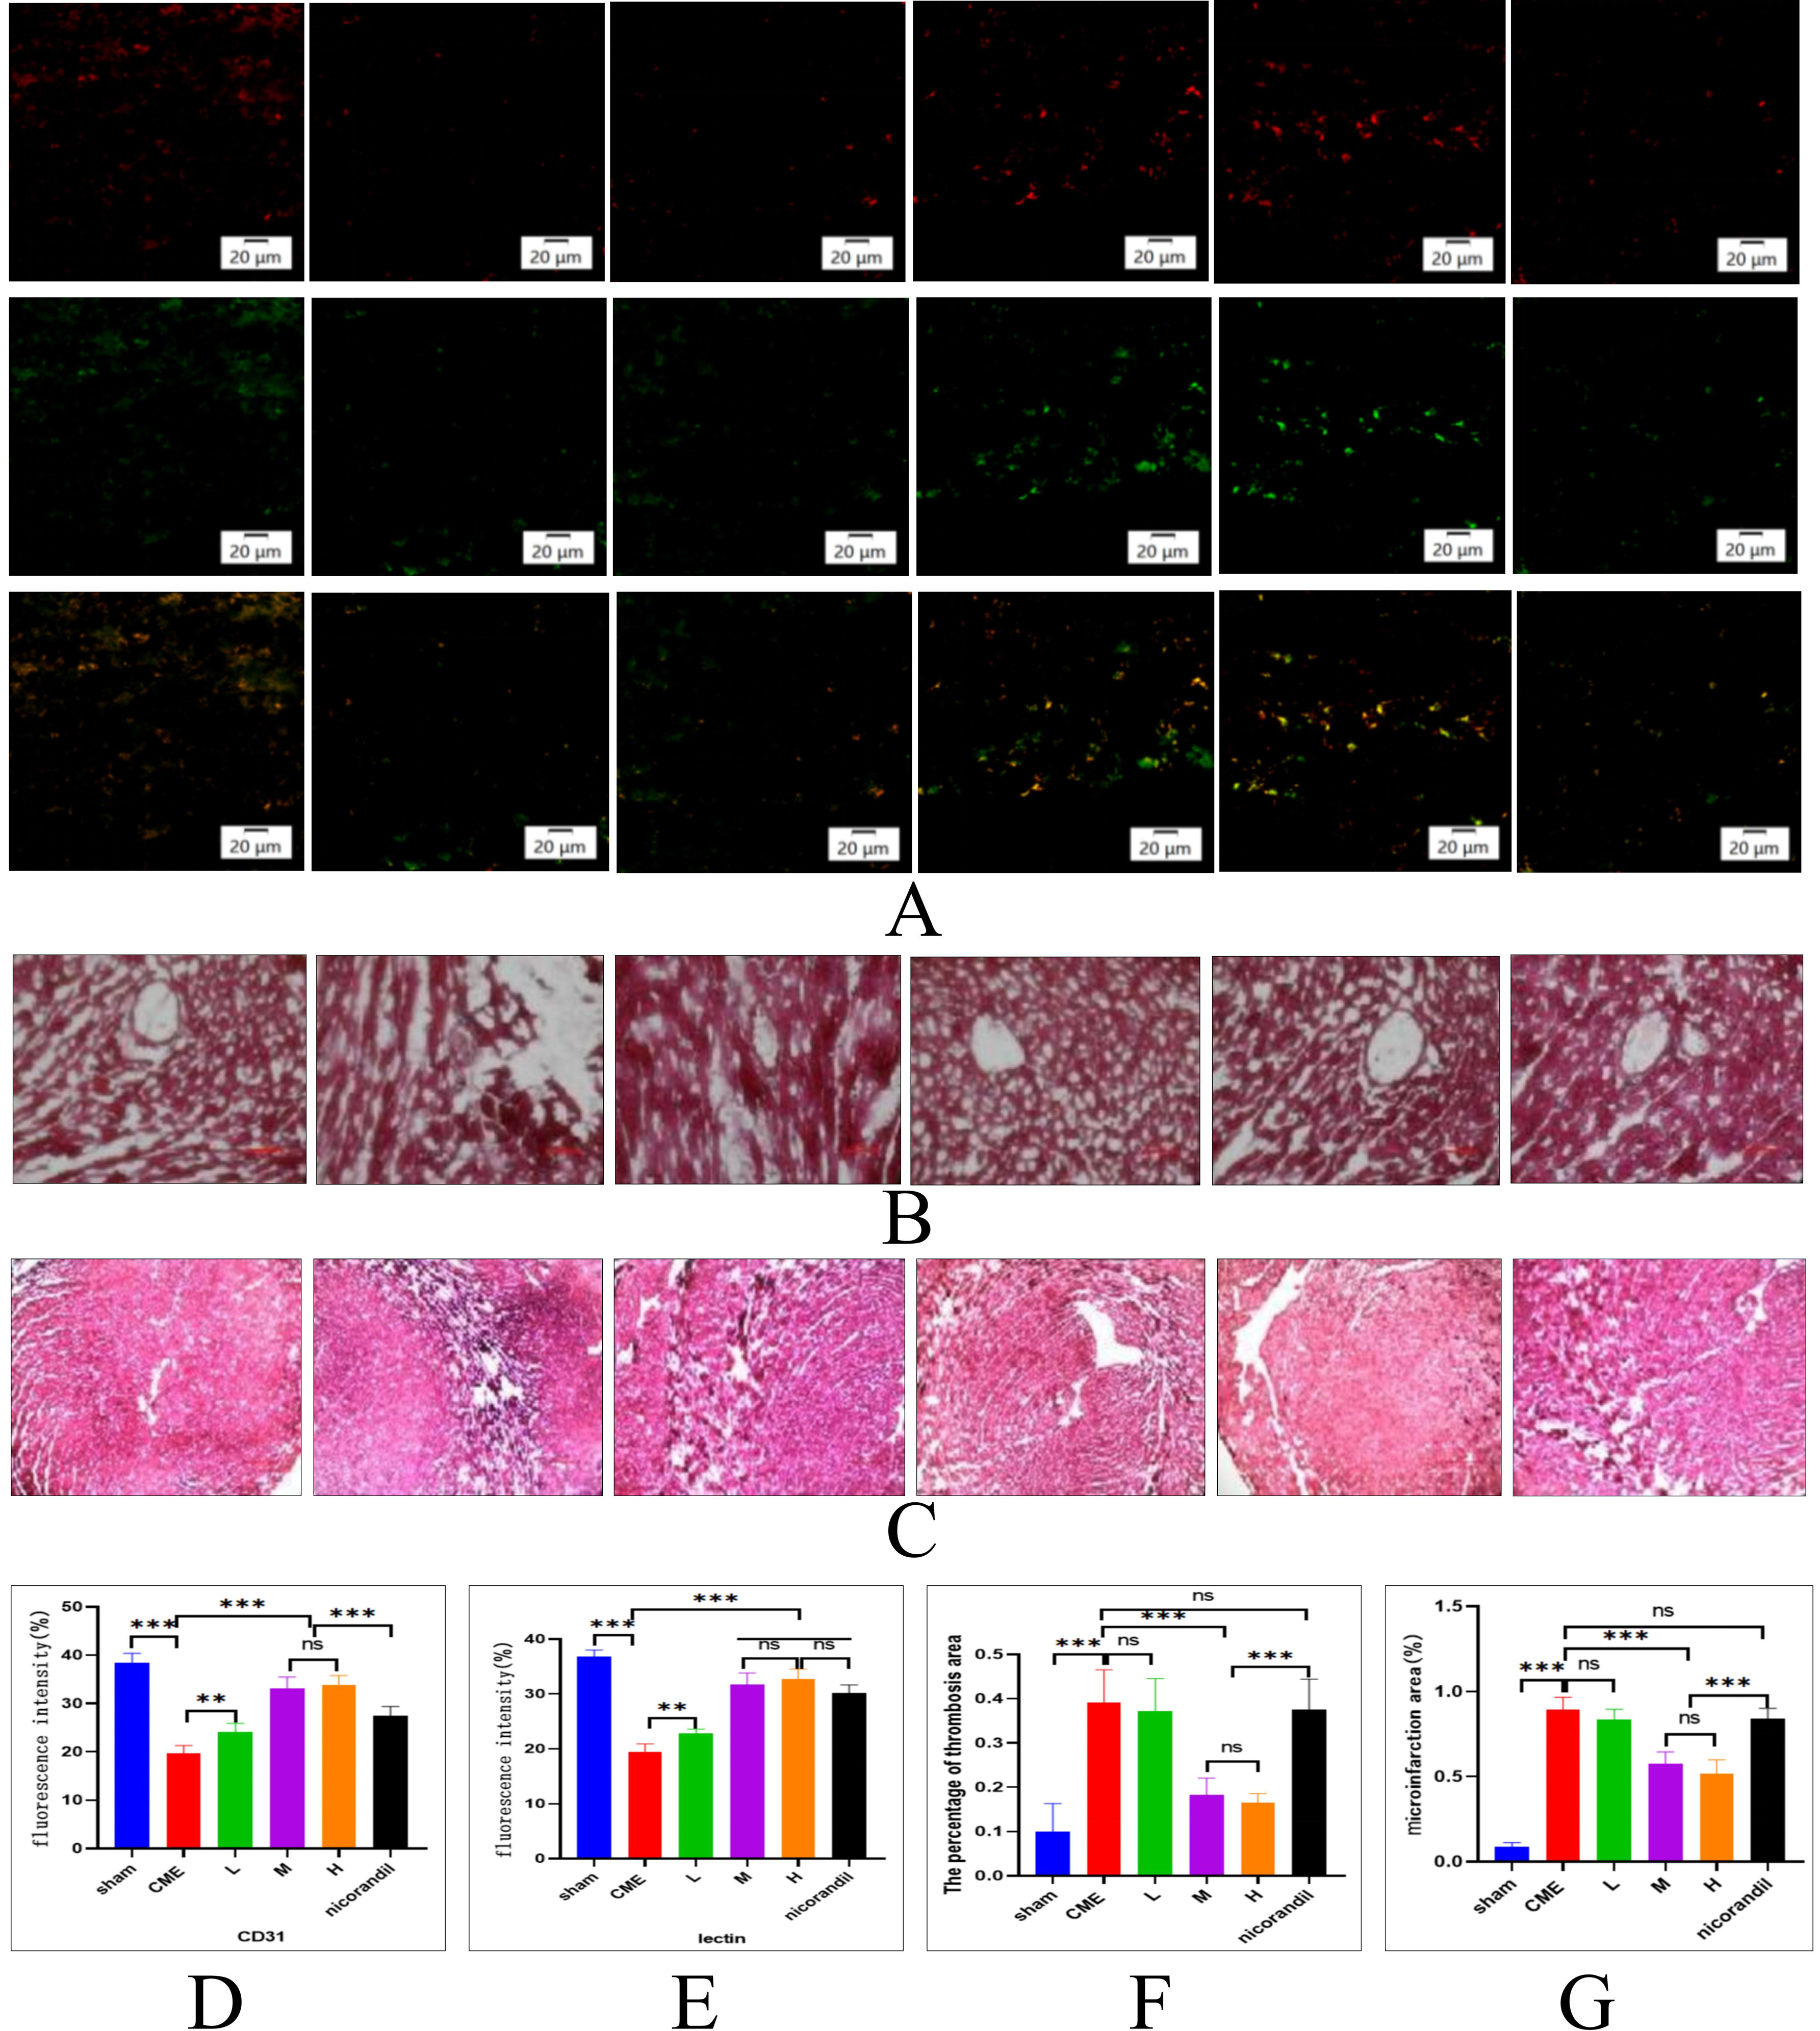
SXDP promotes the expression of CD31 and lectin in cardiac microvascular endothelium, reduces coronary thrombosis, and decreases the size of microinfarcts in CME model mice. (A) Representative immunofluorescence image showing CD31 (Red) and Lectin (Green) expression in coronary microvessels of the sham group, CME group, SXDP low-dose group, SXDP medium-dose group, SXDP high-dose group, and nicorandil group; Scale bar: 20 µm. (B) Representative myocardial H&E staining image illustrating coronary thrombosis in the sham group, CME group, SXDP low-dose group, SXDP medium-dose group, SXDP high-dose group, and nicorandil group; With original magnification ×40; Scale bar: 50 µm. (C) Representative image of myocardial Heidenhain staining indicating microinfarction (black-stained area) in the sham group, CME group, SXDP low-dose group, SXDP medium-dose group, SXDP high-dose group, and nicorandil group; With original magnification ×10; Scale bar: 50 µm. (D) CD31 expression in coronary microvascular endothelium (n = 6). Values represent the mean ± SD; ***P < .001 versus the sham group; **P < .01 versus the CME group; ***P < .001 versus the CME group; ns P > .05 versus the SXDP-M group; ***P < .001 versus the SXDP-M group and SXDP-H group. (E) Lectin expression in coronary microvascular endothelium (n = 6). Values represent the mean ± SD; ***P < .001 versus the sham group; **P < .01 versus the CME group; ***P < .001 versus the CME group; ns P > .05 versus the SXDP-M group. (F) Statistical analysis of coronary artery thrombosis area (n = 6). Values represent the mean ± SD; ***P < .001 versus the sham group; ***P < .01 versus the CME group; ***P < .001 versus the SXDP-M group and SXDP-H group; ns P > .05 versus the SXDP-M group; ns P > .05 versus the CME group. (G) Statistical analysis of microinfarct area (n = 6). Values represent the mean ± SD; ***P < .001 versus the sham group; ns P > .05 versus the CME group; ***P < .01 versus the CME group; ns P > .05 versus the SXDP-M group; ***P < .001 versus the SXDP-M group and SXDP-H group; ns P > .05 versus the CME group.
SXDP Reduces the Coronary Thrombus Area in CME Model Animals
Among the 6 groups of CME model animals, the myocardial H&E staining results indicated a dose-dependent decrease in the coronary thrombus area in the SXDP group. Compared to the CME group and the Nicorandil group, the difference was statistically significant. This characteristic indicates that SXDP has certain anticoagulant or thrombolytic effects (Figure 8B and F).
SXDP Reduces the Myocardial Microinfarct Area in CME Model Animals
All CME model animals were sacrificed 14 days after SXDP treatment, and their hearts were isolated for Heidenhain staining. The results showed that the myocardial microinfarct area in the SXDP group was smaller than that in the CME and Nicorandil groups. The effect was dose-dependent and statistically significant. The occurrence of this phenomenon is mainly related to the promotion of myocardial blood supply by SXDP (Figure 8C and G).
SXDP Increases the Serum NO Level and Decreases the Serum ET-1 Level in CME Model Animals
After 14 days of SXDP intervention, serum samples were collected from all CME model animals to test the levels of NO indirectly by measuring NO-2, and simultaneously examining the ET-1 levels. The results revealed that the CME group exhibited a decrease in serum NO levels and an increase in ET-1 levels. In contrast, the SXDP group showed the opposite trend, indicating that CME can induce vascular endothelial damage, while SXDP can reverse this progression (Figure 9A and B).
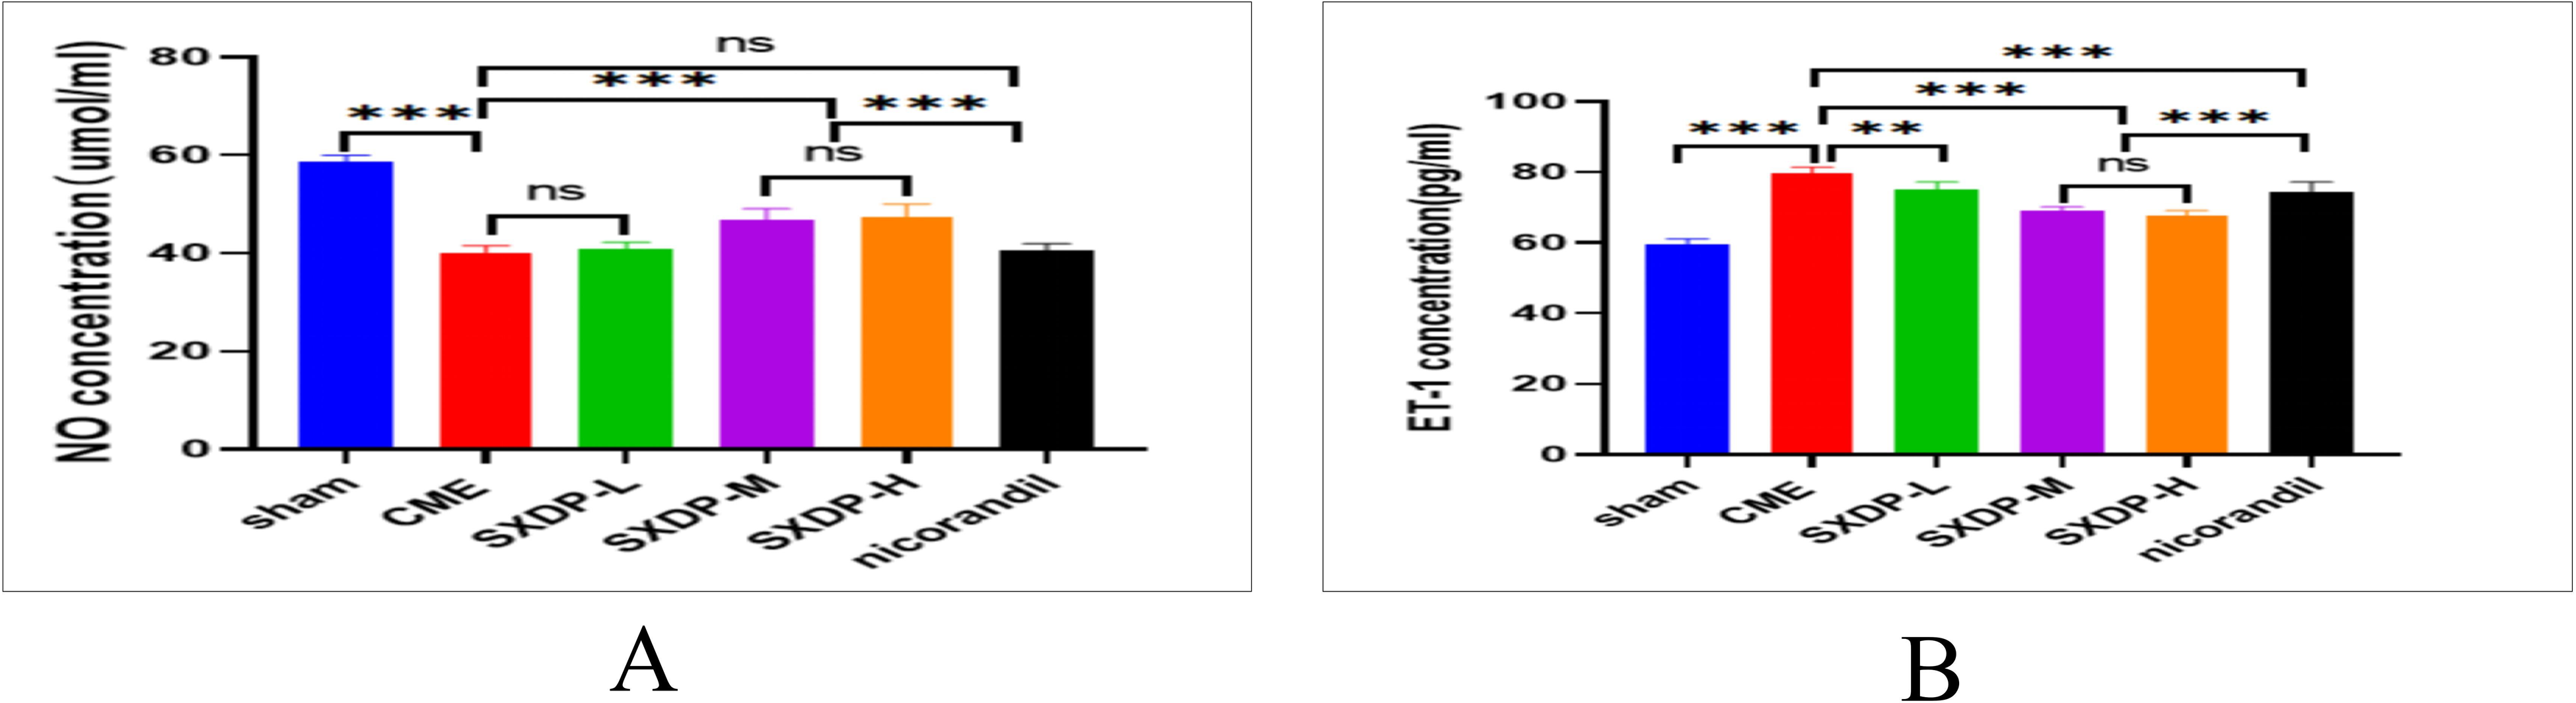
SXDP has a protective effect on cardiac vascular endothelium in CME model mice. (A) Statistical analysis of serum NO concentration measured by ELISA (n = 6). Values denote the mean ± SD; ***P < .001 versus the sham group; ns P > .05 versus the CME group; ***P < .01 versus the CME group; ns P > .05 versus the SXDP-M group; ***P < .001 versus the SXDP-M group and SXDP-H group; ns P > .05 versus the CME group.(B) Statistical analysis of serum endothelin-1 (ET-1) concentration measured by ELISA (n = 6). Values denote the mean ± SD; ***P < .001 versus the sham group; **P < .01 versus the CME group; ***P < .001 versus the CME group; ns P > .05 versus the SXDP-M group; ***P < .001 versus the SXDP-M group and SXDP-H group.
Discussion
To the best of our knowledge, this study is the first to provide a detailed method for constructing a CME animal model using autologous blood clot particles. In this study, we used 9 µm microspheres as a reference and validated the CME model's effectiveness through electrocardiogram, laser speckle, CD31 examination, tomato lectin assay, histopathological findings, and serum NO and ET-1 detection. Our results demonstrate that CME animal models can be successfully established using 400-mesh blood clot particles at a volume of 50 µl and a concentration of 1 : 0.15.
CME is the main cause of coronary microvascular disease, previous clinical research frequently identified obstruction of the coronary microcirculation by microemboli in addition to the rupture or fissure of epicardial coronary atherosclerotic plaques.15 So far, there is no CME animal model that highly simulates clinical practice. Researchers have used lycopodium spores and microspheres as mediators to construct CME animal models.16 However, both lycopodium spores and microspheres are chemically inert and do not fully replicate the clinical situation in patients. Actual microemboli consist of autologous clotted blood and atherosclerotic plaque debris. In addition to physical obstruction, the biological components of the emboli also contribute to “no-reflow” by initiating and/or enhancing thrombogenic, inflammatory, and vasoconstrictive reactions.3 Therefore, in order to develop a model that closely mimics the clinical pathological and physiological processes, thrombogenic CME was modeled by injecting autologous thrombus, consisting of clotted blood, into the occluded coronary artery (left anterior descending) in pigs. This large animal model represents a significant step toward replicating thrombogenic CME in clinical myocardial infarction using autologous clotted blood injection.12 However, this model construction method requires specific equipment and high-tech operational requirements, making it less universally feasible. This study was to explore a mouse model of CME using intraventricular injection of autologous clotted particles during occlusion of the ascending aorta and evaluate the modeling effect through coronary microvascular function, histopathology, and endothelial function examination. Compared with the sham group, the pathological sections of the CME group showed that coronary embolism and myocardial necrosis were present throughout the entire coronary distribution area of the heart, the final results showed a decrease in coronary microvascular blood perfusion and endothelial dysfunction, and reached the expected effect. Compared with previous CME modeling methods, this program has the advantages of being simple, easy to implement, and close to clinical practice.
In the current study, we observed that the 400-mesh blood clot particle group showed an increase in electrocardiogram T-wave amplitude, a decrease in cardiac laser speckle blood flow ROI, a decrease in endothelial cell CD31 and lectin expression, an increase in thrombus formation area and myocardial micro infarct area, and a decrease in serum NO levels while an increase in ET-1 levels. Simultaneously, we confirmed that the CME model was successfully formed at 12 h after the operation, and the 1-week survival rate was not lower than that of other groups. These results indicate that 400-mesh blood clot particles can be used as a medium for constructing CME models.
Drug therapy is a convenient and important approach against CME. Although considerable progress has been made in basic and clinical research into CME, pharmacotherapy is still insufficient for its treatment. Current therapeutic approaches mainly rely on Western medicine, which targets a single mechanism. Therefore, Traditional Chinese Medicine shows promise for the efficacious treatment of CME due to its characteristics of multi-component and multi-target effects. SXDP is a compound preparation based on traditional Chinese medicine theory, which has been used for the treatment of coronary heart disease in China for decades. Several studies have shown that SXDP has anti-inflammatory, anti-apoptosis, anti-oxidative stress, and anti-thrombosis activities.12 It can relieve coronary slow flow and chest pain when used in combination with statin.17 In this study, we observed that compared with the model group, SXDP significantly reduced the amplitude of the electrocardiogram T-wave while increasing the laser speckle ROI value. These results suggest that SXDP can effectively improve coronary blood flow and alleviate myocardial ischemia. The function of SXDP in protecting the vascular endothelium of rats shows the early stages of injuries,13 suggesting that blood NO gradually increased, while hypersensitive C-reactive protein and ET decreased. This experiment also found that SXDP can increase serum NO levels, reduce ET-1 levels, and upregulate the expression of the microvascular endothelial marker proteins CD31 and tomato lectin. These results once again support the protective effect of SXDP on the vascular endothelium. Previous studies have shown that SXDP decreased microthrombosis formation compared to the CMD model group.13 We also found a reduction in thrombosis and myocardial microinfarction area through histopathological observation in this experiment, indicating that SXDP may have certain antithrombotic effects. Due to the fact that the slices used for detecting thrombosis and myocardial infarction were randomly selected from the entire heart, and there were no significant differences between different slices of the same group of heart specimens, this phenomenon indicates that SXDP has an effect on both coronary thrombosis and necrotic myocardium in the entire heart and no spatial selectivity. SXDP consists of 7 monomers and more than 50 active ingredients, several of which have been proven to have certain vasodilator, antiplatelet, anticoagulant, and thrombolytic effects, for example, Tanshinone is one of the main active ingredients in SXDP, which can inhibit adenosine diphosphate (ADP)-induced platelet aggregation, inhibit the synthesis and release of thromboxane A2, and promote the degradation of fibrin.18 Another research suggests that salvia and bear bile powder have lipid-lowering and thrombolytic effects.19,20 Additionally natural musk and artificial musk both showed improving cerebral blood microcirculation in rabbits.21 Middle cerebral artery thrombosis was ameliorated in rats after being treated with traditional chinese medicine (TCM) preparation containing artificial musk.22 Anti-thrombin activity and cardiomyocytes protection were possessed both in 2 musk in vivo.23 These monomers with anticoagulant activity form the material basis for the anticoagulant effect of the compound.
The present study had a few limitations. First, the pathological and physiological processes of CME caused by autologous blood clot particles prepared in vitro are not completely equivalent to those caused by fresh blood clots in the blood circulation. Further exploration of modeling methods closer to clinical practice is needed. Second, this project only observed the effect of SXDP on CME from a macro perspective, and the specific molecular mechanism was not investigated. Further exploration is needed to understand the underlying mechanisms.
In conclusion, we successfully constructed a CME model using mouse autologous blood clot particles for the first time and observed the effects of SXDP on the model animals (Figure 10). This research is of great significance for further conducting basic research on CME and promoting the clinical application of SXDP.

Schematic diagram of the effect of SXDP on coronary microvasculature in CME model mice induced by autologous blood clot particles. SXDP has protective effects on vascular endothelium and antithrombotic action, thereby reducing T-wave amplitude of electrocardiogram, promoting cardiac laser speckle ROI value, reducing intracoronary thrombus and microinfarct area, and increasing NO level while decreasing endothelin-1 (ET-1) level.
Materials and Methods
Main Instruments and Equipment
The small animal respiratory anesthesia integrated machine and ventilator were manufactured by Rayward Life Technology Co., Ltd., Shenzhen, China. The laser speckle blood flow imaging instrument was developed by Xunwei Optoelectronic Technology Co., Ltd., Wuhan, China. The biological signal acquisition and analysis system (BL-420N) were obtained from Taimeng Software Co., Ltd., Chengdu, China. The fully automatic flow cytometry (JIMBIO iCytal s2) was manufactured by Zhuowei Biotechnology Co., Ltd., Changzhou, China. The frozen slicer (Minux FS800A) was manufactured by Rayward Life Technology Co., Ltd., Shenzhen, China. The optical microscope (CX43) was developed by OLYMPUS CORPORATION, Japan. The Novocyte Flow cytometer was manufactured by Agilent Bioscience Co., Ltd., Hangzhou, China. Mortar, 400-mesh screen, 800-mesh screen, 1000-mesh screen, balance, 37 °C oven, operating table, surgical lamp, endotracheal intubation, microshear, microscopic tweezers, drag hook, insulin injection needle, suture needle, stylolite, needle holder, rubberized fabric, 1.5 ml eppendorf (EP) tube, 1 ml syringe, and 100 µl pipette were provided by Huayan Biotechnology Co., Ltd., Guangzhou, China.
Drugs, Reagents, Antibodies, and Auxiliary Supplies
SXDPs (Z20080018, 190501, Kang’enbei Pharmaceutical Co., Ltd., Eerduosi, China) and nicorandil (HJ20160540, 14202044667, Nipro Pharma Corporation Kagamiishi Plant, Japan) were purchased from Minghe Pharmacy, Guangzhou, China. CD31 antibody (MA9724 M, SAB, Signalway Antibody, California, USA), NO ELISA Kit (QS43089-96 T, Qisong Biotechnology Co., Ltd., Beijing, China), ET-1 ELISA Kit (QS43297-48 T, Qisong Biotechnology Co., Ltd., Beijing, China), 1.25% avodine (M2920, Houston, Texas, USA), 1.5% isoflurane (R510-22-10, Rayward Life Technology Co., Ltd., Shenzhen, China), normal saline (XY011286 M, XYBiotechnology, Shanghai, China), penicillin solution (G815743-5 g, Macklin, Shanghai, China), depilatory (C150422001, Veet, France), iodophor (31001201, Shanghai, China), cotton swab (220401, Hainuo Bioengineering Co., Ltd., Qingdao, China), H&E dye (20221128, Solarbio®, Beijing, China), and Heidenhain iron hematoxylin staining solution (GCDH0013, OKA®, Beijing, China) were obtained from Huayan Biotechnology Co., Ltd., Guangzhou, China. Tomato lectin (FL-1171-1, Vector Laboratories, USA) was purchased from Xinbosheng Biotechnology Co., Ltd., Shenzhen, China.
Animal Preparation
All animal studies followed the guidelines of the National Institutes of Health (NIH) and were approved by the Institutional Animal Care and Use Committee of Guangzhou University of Chinese Medicine. Healthy adult male C57BL/6 mice, aged 8 weeks and weighing between 20 and 25 g, were sourced from the Laboratory Animal Center of Guangzhou University of Chinese Medicine (Guangzhou, China). They were kept in a specific pathogen-free barrier system at 20-25°C on a 12/12-h dark/light cycle with free access to a chow diet and water. After 1 week of adaptive feeding, the mice were randomly divided into the following groups, with 6 animals in each group: (1) sham operation group (sham), (2) microsphere group, (3) 400-mesh blood clot particles group, (4) 800-mesh blood clot particles group, and (5) 1000-mesh blood clot particles group. Subsequently, the further steps of the modeling procedure were carried out according to the research protocol. The successfully modeled mice were randomly divided into the following groups: (1) CME group, (2) SXDP low-dose group, (3) SXDP medium-dose group, (4) SXDP high-dose group, (5) Nicorandil group, and a sham surgery group was also set up.
Twelve hours after surgery, the sham operation group and CME group were administered 0.2 ml of normal saline once a day. The low-dose SXDP group was administered SXDP at 21.5 mg/kg once a day, the medium-dose SXDP group was administered SXDP at 43 mg/kg once a day, and the high-dose SXDP group was administered SXDP at 86 mg/kg once a day, while the Nicorandil group was administered Nicorandil at 5.85 mg/kg once a day. Continuous gavage was conducted for 14 days. Electrocardiogram, laser speckle, CD31, Lectin, NO, ET-1, and histological characteristics were detected in all mice at 24 h after the final gavage.
Autologous Blood Clot Particle Preparation
A 0.2 ml blood sample was taken from the mouse tail vein and dropped into a 1.5 ml EP tube. The tube lid was opened, and it was placed in a 37-degree oven for 24 h until the blood became coagulated and dry. The blood clot was then crushed with a mortar and sifted through 400-, 800-, and 1000-mesh sieves, respectively. The blood clot particles were collected and weighed for later use.
Blood Clot Particle Size and Concentration Screening
Particles with different sizes were prepared using physiological saline, resulting in suspensions with concentrations of 1:0.1, 1:0.15, 1:0.2, 1:0.25, and 1:0.5, respectively. Additionally, a microsphere suspension with a diameter of 9 µm and a concentration of 105/10 µl was used as the standard control sample. Each sample was loaded with 10 µl into a fully automatic flow cytometer, and the average particle size and number were measured. FSC-A and FSC-H were measured using the flow cytometer.
Procedure of CME Mouse Model Based on Autologous Thrombotic Particles
The mice were fully anesthetized by intraperitoneal injection of 1.25% Avodine (0.1 ml/10 g) and ventilated with a small animal ventilator at a tidal volume of 0.5 ml and a rate of 100 breaths per minute. Anesthesia was maintained by inhalation of 1.5% isoflurane (1.5 ml) throughout the procedures. Firstly, the third, fourth, and fifth ribs along the left edge of the sternum were cut, and the heart was exposed using a dilator. The thymus at the top of the heart was lifted to locate the ascending aorta, and blood flow was blocked after threading under the aorta. Subsequently, autologous thrombotic microparticle suspensions with 400-mesh sizes and concentrations of 1 : 0.15, at a volume of 50 µl, were injected as a bolus using a 29-gauge needle into the left ventricular chamber during 10 s of occlusion of the ascending aorta. The standard control group was injected with 500 000/50 µl 9 µm microspheres using the same method described above. An identical procedure was performed in the sham group, with saline being injected instead of autologous thrombotic microparticle suspensions. Then, the thoracic cavity and the skin incision were closed successively with sutures, and a 1 ml syringe was used to puncture the chest cavity for exhaust and decompression (Figure 11A-D).
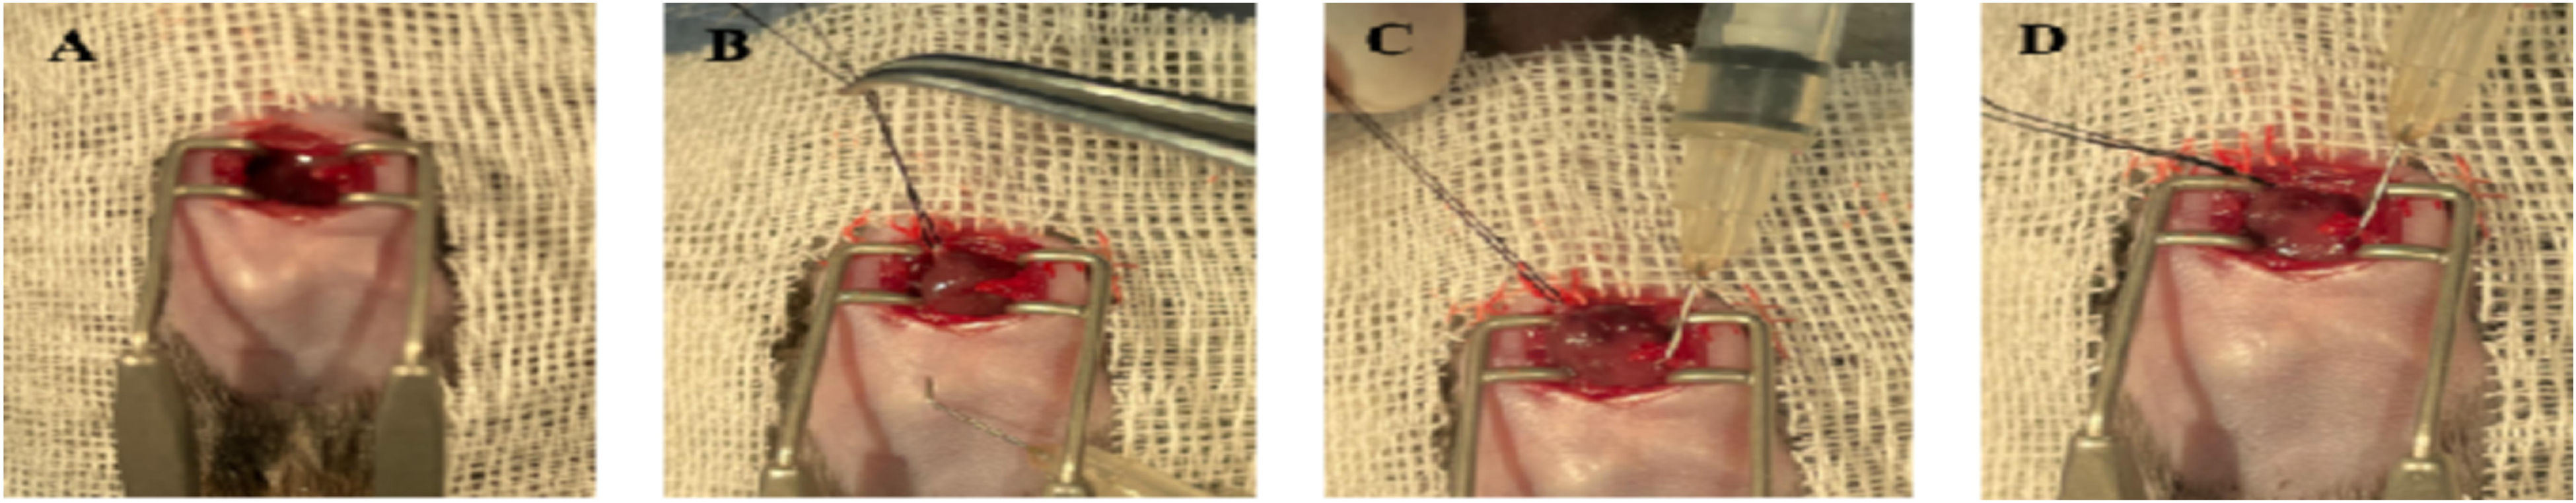
The protocol for CME surgical procedures (A) cut the chest wall along the left edge of the sternum at the junction of the third, fourth, and fifth ribs and sternum, expanding the chest wall to expose the heart. (B) A #5 silk suture has been placed under the aortic root after thoracotomy. (C) Inject blood clot particles or microspheres into the left ventricular chamber from the apex while occluding the ascending aorta. (D) Release the thread and restore blood flow.
Electrocardiographic Examination
The electrocardiograms of all model evaluation and drug intervention animals were recorded using a Biological signal acquisition and analysis system. Electrocardiograms were performed on model evaluation animals before the modeling surgery, at 0 h, 12 h, and 24 h after surgery. Animals undergoing pharmacodynamic evaluation were examined at 24 h after the completion of the last gavage. Follow the instructions for operating the instrument.
Cardiac Laser Speckle Detection
Model evaluation animals underwent cardiac laser speckle examination at 0, 12, and 24 h after CME surgery to observe the ROI value using a Laser speckle blood flow imaging instrument. Animals receiving SXDP intervention underwent the same examination at 24 h after the last gastric infusion. The specific operational process is as follows: Open the chest wall of the mouse to fully expose the heart, turn on the laser speckle blood flow imaging device and set the brightness and contrast to 50%, adjust the focal length of the laser lens, and focus on the outline of the entire heart selected by framing, when a clear red speckle signal appears with the beating of the heart, start collecting images at 100 frames per second for 1 min, and calculate the average ROI value of the collected images.
Immunofluorescence Assay of CD31 Protein and Lectin Protein in Vascular Endothelium
Model evaluation animals were injected with 20 µl of tomato lectin through the caudal vein in a dark room at 12 h after CME surgery. Animals were sacrificed 2 h later, and their hearts were removed for immunofluorescence examination. During the lectin testing process, CD31 antibodies were added to determine their expression. SXDP intervention animals were tested for the same indicators at 24 h after the last gavage using the same method as described above. The specific methods are as follows: After incubating the primary antibody of the target protein, fluorescent-labeled secondary antibodies were added to the tissue slide for further incubation. CD31 showed red fluorescence while lectin showed green fluorescence. After the entire incubation, the clearest resolution field of view was captured using a fluorescence microscope for photography, and then the fluorescence density and intensity were calculated using Image J software.
Myocardial H&E and Heidenhain Staining
Both model evaluation animals and drug intervention animals were sacrificed at 12 h after CME surgery or 24 h after the last gastric infusion. Their hearts were isolated and placed in liquid nitrogen for freezing, then stored in a refrigerator at −80 degrees Celsius. They were sliced using a Frozen slicer and subjected to H&E staining and Heidenhain staining. The operating procedure is as follows: Frozen heart specimens are sliced horizontally from the apex of the heart, with a layer thickness of 8 µm. Discard the initially small tissue slides for staining, then observe the changes in tissue structure under an inverted microscope and take photos of the clear and visible positive results on the slides. Subsequently, 6 glass slides were randomly selected from each group and analyzed using ImageJ software. Firstly, set the image threshold, then use Wand Tool to select the positive changes in the entire image (thrombus shadows in H&E-stained images and black spots in Heidenhain-stained images), and further calculate the proportion of positive results in the entire field of view.
Serum NO and ET-1 Examination
Model evaluation animals underwent eyeball extraction for blood collection at 12 h after CME surgery, and drug intervention animals underwent the same procedure at 24 h after the last gastric perfusion. Each mouse had 0.5 ml of blood collected and placed in a 1.5 ml EP tube. After standing at room temperature for 2 h, the sample was placed in a 4 °C refrigerator overnight. Subsequently, it was centrifuged at 3000 revolutions for 15 min in a 4-degree centrifuge, and the supernatant was collected for measuring NO and ET-1 content using an ELISA kit, the NO level is indirectly obtained by measuring its metabolite NO-2. The protocol was carried out in accordance with the instructions provided.
Observation of 1-Week Survival Rate
The 7-day survival rate of all model animals after CME surgery was observed.
Statistical Analysis
All data are expressed as the mean ± standard deviation (SD). GraphPad Prism 8 software was used to analyze and present the data. Statistical differences were examined using 1-way ANOVA and nonparametric or 1-sample T and Wilcoxon tests. Differences were considered significant at P-values less than .05.
Supplemental Material
sj-docx-1-npx-10.1177_1934578X241235020 - Supplemental material for Establishment of CME Mouse Model Based on Autologous Thrombotic Particles and the Effect of Shexiang Tongxin Dropping Pill on the Coronary Microvascular Blood Flow in This Model
Supplemental material, sj-docx-1-npx-10.1177_1934578X241235020 for Establishment of CME Mouse Model Based on Autologous Thrombotic Particles and the Effect of Shexiang Tongxin Dropping Pill on the Coronary Microvascular Blood Flow in This Model by Xiaojun Li, Dong Deng, Yiming Yang, Yan Li, Lan Chen, Wei Wang and Yijun Chen in Natural Product Communications
Footnotes
Declaration of Conflicting Interests
The authors declared no potential conflicts of interest with respect to the research, authorship, and/or publication of this article.
Ethical Approval
This animal study followed the guidelines of the National Institutes of Health (NIH) and was approved by the Institutional Animal Care and Use Committee of Guangzhou University of Chinese Medicine.
Funding
The authors disclosed receipt of the following financial support for the research, authorship, and/or publication of this article: This study was supported by the Key Program of the National Natural Science Foundation of China [No. 81930113], the National Traditional Chinese Medicine Inheritance and Innovation Team Project [No. ZYYCXTD-C-202201], and the Guangdong Provincial Key Laboratory of Research on Pathogenesis and Prescriptions Related to Heart and Spleen of Traditional Chinese Medicine (2022B1212010012).
Informed Consent
There are no human subjects in this article and informed consent is not applicable.
Statement of Human and Animal Rights
All of the experimental procedures involving animals were conducted in accordance with the Institutional Animal Care and Use Committee of Guangzhou University of Chinese Medicine.
Supplemental Material
Supplemental material for this article is available online.
References
Supplementary Material
Please find the following supplemental material available below.
For Open Access articles published under a Creative Commons License, all supplemental material carries the same license as the article it is associated with.
For non-Open Access articles published, all supplemental material carries a non-exclusive license, and permission requests for re-use of supplemental material or any part of supplemental material shall be sent directly to the copyright owner as specified in the copyright notice associated with the article.