
Abstract
Nanoparticles’ size-dependent features make them exceptional and necessary in a wide range of human activities. We examined the toxicity and apoptotic activities of Cu/Fe nanocomposite (green Cu/Fe nanoparticles [g-Cu-FeNPs]) on human liver (HuH-7) and breast cancer (MCF-7) cells for 24 h. Prior to the treatment of g-Cu-FeNPs, the size of the nanoparticles (NPs) was determined by scanning electron microscope (SEM) and transmission electron microscope (TEM). The shape of g-Cu-FeNPs was polygonal, with a size of 24 ± 2 nm. The cytotoxicity of g-Cu-FeNPs on both cells was determined by using MTT and NRU assays, and the cytotoxicity of NPs was increased in a concentration-dependent manner. On the basis of the MTT result, the median inhibitory concentration (IC50) at 24 h was determined to be 324 and 368 μg/mL for HuH-7 and MCF-7 cells, respectively. The generation of intracellular reactive oxygen species, lipid peroxidation, and catalase levels in HuH-7 cells was higher than in MCF-7 cells at 216 µg/mL of g-Cu-FeNPs. The cell death mechanism was assessed using Hoechst 33342 and propidium iodide staining. Maximum apoptotic and necrotic cells were observed at a higher concentration of NPs in HuH-7 cells than in MCF-7 calls. This study warrants the application of g-Cu-FeNPs in daily life and provides vital information about the toxicity of g-Cu-FeNPs.
Introduction
Scientific technology related to the manipulation and formation of nanoscale particles is an important area of research and beneficial for human health. Remarkably, a nanocomposite is a substance created by combining 2 or more materials to produce a new material with at least 1 nanoscale dimension.1However, bimetallic nanoparticles are made up of 2 metals. 1 The properties of bimetallic nanoparticles are determined by the constituent metals and their nanometric size. So, these are made by combining distinct architectural structures of metallic nanoparticles. Moreover, recent research has discovered that the Fe-Cu bimetallic catalyst system has attracted a lot of interest. 2 Therefore, the usage of harmful compounds and their stability are also major concerns. Thus, green nano-technology aims to create stable nanoparticles using different biological routes. 3 Furthermore, green nanoparticles are considered safe and environmentally friendly materials that are utilized in a variety of industries. Consequently, green synthesis is better than traditional chemical synthesis since it is less expensive, produces less pollution, and is safer for the environment and human health. 4 Dhand et al 5 synthesized silver nanoparticles using dried roasted Coffea arabica seed extract which showed antibacterial properties. Habibi et al 6 reported that magnetite nanoparticles coupled with pyridinecarboxaldehyde thiosemicarbazone induces cytotoxicity and apoptosis in human lung cancer cells. Some researchers
Momordica charantia, is a cucurbitaceous plant that is commonly called as a bitter melon. M Charantia has been shown to have antibacterial, antiviral, antitumor, antioxidant, antidiabetic, antimutagenic, hepatoprotective, anticancer, and anti-inflammatory properties, among other plants al., 2017a). 7 Gandhi et al, 8 synthesized zinc oxide nanoparticles (ZnONPs) using M charantia leaf extract have remarkable antiparasitic action. Dlamimi et al, 9 conclude that the different nanoparticles synthesized using a bioflocculant in a green approach technique such as iron-copper nanoparticles, were shown to be safer to utilize at low concentrations in HEK 293 and MCF7 cancer cells in the cytotoxicity study. So, in this experiment we have analyzed the cytotoxicity and apoptotic properties of green copper-iron nanoparticles on liver and breast cancer cells for 24 h. Nanoparticles (NPs) mediated toxicity involves various mechanisms, specifically, the excess generation of reactive oxygen species (ROS) in living tissue under stress. The generation of intracellular ROS within cells by different sources. Mitochondria are the main source of ROS in cells, and the major part of ROS occurs in the electron transport chain. 10 Oxidative stress, apoptotic responses, and genotoxicity responses are the main mechanisms of toxicity in green copper-iron nanoparticles. The objective of this study was to investigate the toxic effects of green copper-iron nanoparticles on human liver and breast cancer cells. Also, our findings will help evaluate the safety and eco-friendliness of the use of copper-iron nanoparticles for industrial purposes.
Materials and Methods
Chemicals and Reagents
The tetrazolium bromide, 2′,7′-dichlorodihydrofluoresceindiacetate, dimethyl sulfoxide (DMSO), propidium iodide (PI), and Annexin V fluorescein isothiocyanate (FITC) were purchased from Sigma-Aldrich. Other chemicals and kits related to the current experiment were bought at local markets and Cayman Chemical.
Synthesis of Green Cu/Fe Nanoparticles from M charantia Peel
M charantia was bought from the local market in Riyadh, Saudi Arabia, and was washed and peeled out. The peel was cut into small pieces and oven-dried at 50 °C for a stable dry weight. The dried peels were ground into a powder by using a grinder (Ikon). 100 g of M charantia peel powder was mixed with 200 mL of Milli-Q deionized water in a 250 mL glass conical flask. The mixture was kept at 4 °C for 48 h before being heated at 100 °Cfor 60 min. To separate the aqueous extract and get rid of the heavy biomaterials, it was centrifuged for 15 min at 14 000 r/min and filtered using Whatman filter paper
To prepare g-Cu-Fe NPs using a precipitation reaction technique, 50 mL of M charantia L. aqueous peel extract was mixed with 10 mL of copper (II) acetate and ferric chloride in a 100 mL conical flask. After that, with constant mixing, the color of extract was changed to dark brown as a result of the reduction of copper (II) and ferrous ions. To stabilize the process, drop-by-drop mixtures of ascorbic acid (0.1 M) solutions were added to the conical flask. After the reaction was finished, the suspension was mixed for 24 h at 30 °C at 500 r/min. The precipitate was then cleaned 3 times with distilled water after being filtered and rinsed with a solution. The materials that had precipitated were dried for 24 h before being heated to 100 °C for 4 h of hot air drying. Brown powder is a Cu/Fe nanoparticles.
Physiochemical Characterization of Green Copper-Iron Nanoparticles
The physical characterization of green Cu/Fe nanoparticles (g-Cu-FeNPs) was done by scanning electron microscope (SEM) and transmission electron microscope (TEM) (JEOL Inc). We have determined the size of g-Cu-FeNPs in culture media and water by using dynamic light scattering instruments (Malvern).
Cell Culture
Two different cell lines were used human hepatic cancer cell line (HuH-7) and the human breast cancer cell line (MCF-7). These were purchased from an American type culture collection. Cells were grown in Dulbecco’s modification of eagle's medium, supplemented with 10% fetal bovine serum and 1% antibiotic, cells were maintained in a CO2 (5%) incubator at 37 °C. Cells were handled and subcultured in a biological safety cabinet class II that was regularly sanitized with 70% ethanol and UV sterilization before each experiment.
Exposure of Cu-Fe NPs
Both cells were subcultured and exposed to different concentrations of g-Cu-Fe NPs for 24 h. Prior to exposure, NPs (1 mg NPs/mL dH2O) were suspended in Millie Q water. To examine the toxicity of different concentrations of NPs (0, 50, 100, 150, 200, 300, 400, and 500 µg/mL), was prepared. We have used 1 control well without exposing NPs.
MTT Assay
The cell viability was determined by using the MTT (3-(4, 5-dimethyl thiazol-2-yl)-2, 5-diphenyl tetrazolium bromide) assay. 11 In brief, HuH-7 and MCF-7 cell lines (8 × 10⁴) were seeded in 96-well plates and incubated in a CO2 incubator at 37 °C for 24 h. Then media were discarded from the 96-well plates and replaced with media containing different concentrations of g-CuFe NPs (0, 50, 100, 150, 200, 300, 400, and 500) μg/mL. Then the plates were incubated for 24 h in a CO2 incubator at 37 °C. After exposure, the MTT powder was dissolved in culture medium at 0.5 mg/mL and the culture medium was discarded from the 96-well plates. Plates were centrifuged at 1500 r/min for 2 min using the LMC-3000 Low Speed Benchtop Centrifuge, (Thermo Scientific) in order to get rid of any adhering nanoparticles on cells. Then, cells were washed twice with 0.05 M PBS and the MTT solution was added to each well (100 μL/well) and incubated for 3.5 h. Following the incubation, cells were washed with PBS, and DMSO was added to each well to dissolve formazan crystals (100 μL/well). Plates were shaken for 15 min at room temperature to achieve sufficient solubilization. A microplate reader was used to measure the absorbance of each sample at 570 nm (Synergy-H1; BioTek). Cell viability was measured by (%) cell viability = (the number of absorbances for treated cells / the number of absorbances of control cells)×100.
Neutral red Uptake Assay
The neutral red uptake assay determines the number of viable cells in a culture in a quantifiable form. It is based on live cells’ capacity to absorb and bind the supravitally dye-neutral red in lysosomes. 12 In brief, cells were seeded at a density of 8 × 10⁴ in 100 μL of culture medium in 96-well plates and kept in the 5% CO2 incubator for 24 h at 37 °C. After incubation, cells were exposed to g-CuFe NPs for 24 h. Then, the media were removed, NRU powder was dissolved in the culture medium at 0.25 mg/mL, and the culture medium was removed from 96-well plates. Plates were centrifuged at 1500 r/min for 2min using the LMC-3000 Low Speed Benchtop Centrifuge (Thermo scientific) in order to get rid of any adhering nanoparticles on cells. Then, cells were washed twice with 0.05 M PBS and the NRU solution was added to each well (100/well), and incubated for 4 h in a 5% CO2 incubator at 37 °C. After incubation, 100 μL per well of fixative solution was added. The accumulated dye was extracted with 50% ethanol containing 1% acetic acid (100 μL/well), and plates were kept for 20 min on a shaker. The absorbance was recorded at 540 nm by using a plate reader. Cell viability was measured by (%) cell viability = (the number of absorbances for treated cells/the number of absorbances of control cells)×100.
Reactive Oxygen species
The production of ROS was measured using 2′, 7-dichlorofluoresceindiacetate (DCFH-DA) as a fluorescence agent. Cells were seeded at a density of 8 × 10⁴ in 200 μL of culture medium in transparent 6-well plates, and more culture medium was added to reach 2 mL/well. After being exposed to g-Cu-FeNPs at concentrations of (0, 1/10 of IC50, 1/2 of IC50, and 2/3 of IC50) µg/mL for 24 h, the cells were washed 3 times with PBS and treated for 1 h in the dark with 50 μL the permeable fluorescent dye DCFH-DA (10 µM) dissolved in media, and fluorescent pictures were captured with a fluorescence microscope. In parallel, cells were seeded at a density of 8 × 10⁴ in 100 μL of culture medium in 96-well plates. Cells were exposed to different concentrations of g-Cu-FeNPs (0, 1/10 of IC50, 1/2 of IC50, and 2/3 of IC50) µg/mL for 24 h. Then cells were centrifuged at 1500 r/min for 2 min using the LMC-3000 Low Speed Benchtop Centrifuge (Thermo scientific) and washed 3 times with PBS, then 50 μL of permeable fluorescent dye DCFH-DA (10 M) dissolved in media was added by 100 μL per well for 1 h in dark. The absorbance was recorded at 485 and 528 nm by using a plate reader. ROS percentage was measured using the formula = the number of absorbances for treated cells/the number of absorbances of control cells)×100.
Catalase Enzyme Activity
Catalase (hydrogen peroxide/hydrogen peroxide oxidoreductase) is a key cellular antioxidant enzyme that protects the body from oxidative stress. The catalase activity was measured by a catalase kit (Cayman chemical company). In short, cells were seeded in 25 cm2 flasks and exposed to (0, 1/10 of IC50, 1/2 of IC50, and 2/3 of IC50) µg/mL of g CuFe NPs for 24 h. Next, cell lysate was prepared by suspending and sonicating the cells in a cold solution containing 50 mM potassium phosphate (340.22 mg), and 1 mM EDTA (14.61 mg), all suspended in 50 dH2O, pH = 7.0. A microplate reader was used to read absorbance at 540 nm (Synergy-H1; BioTek).
Lipid Peroxide Enzyme Activity
As cells die, the lipids in their membranes become substantially more vulnerable to peroxidation. The extent of membrane lipid peroxidation will be estimated in HuH-7 and MCF-7 cells due to exposure to g CuFe NPs according to the manufacturer's kit protocol (Cayman Chemical Company, USA). In brief, cells were seeded in 25 cm flasks and exposed to g CuFe NPs (0, 1/10 of IC50, 1/2 of IC50 and 2/3 of IC50) µg/mL for 24 h. After that, cell lysate was prepared by suspending and sonicating the cells in a cold deionized H2O in order to get rid of any metals. An equal volume of extract R saturated in methanol was added to cell lysate suspension and 2 mL of cold chloroform was also added to each sample tube. After that, centrifugation at 4500 RCF for 15 min at 4 °C was done and the bottom chloroform layer was collected. The assay tubes were left at room temperature for 5 minutes then 300 µL from each tube was transferred into 96-well plate in order to read the absorbance at 500 nm using a microplate (Synergy-H1; BioTek).
DNA Fragmentation
The cellular DNA fragmentation was detected using 5′-bromo-2′-deoxy-uridine (BrdU)-labeled DNA fragments using a photometric enzyme-linked immunosorbent assay (ELISA). The nuclear DNA of target cells uses BrdU as a metabolic labeling agent. HuH-7 and MCF-7 cell lines were seeded in a 24-well plate at a density of 8 × 10⁴ in 300 μL of culture medium, then cultured in a CO2 incubator at 37 °C for 24 h. Cells were exposed to different concentrations of g CuFe NPs (0, 1/10 of IC50, 1/2 of IC50 and 2/3 of IC50) µg/mL for 24 h. After that, the plate was centrifuged for 10 min at 1500 r/min, and the supernatant was carefully removed. The 200 µL of 1× incubation solution was added per well to lyse cells. After that, the plate was centrifuged at 2000 r/min for 10 min and 100 µL of the supernatant was shifted to a precoated 96-well plates and incubated overnight to detect BrdU-labeled DNA fragments with the ELISA procedure. After incubation, the solution was removed and the wells were washed 3 times with 200 µL of washing solution. Then, 100 µL of exonuclease III solution was added per well and incubated for 30 min in order to fix and denature the DNA. The exonuclease III was removed and the plate was washed 3 times with 200 µL of washing solution. A 100 µL of anti-BrdU-POD conjugate solution was added per well and incubated for 90 min at 25 οC. The washing of the plate was repeated as described before. Per well 100 µL of substrate solution was added and incubated in the dark. When the color development was sufficient, 25 µL of stop solution was added. The plate was incubated in the dark for 1 min in a shaker and measurements was taken within 5 min . Measurement absorbance at 450 nm-690 nm wavelength was detected using a microplate (Synergy-H1; BioTek) according to the protocol.
Caspase 3 Enzyme Activity
In brief, cells were seeded at a density of 8 × 10⁴ in 100 μL of culture medium in 96-well plates. Cells were exposed to different concentrations of g CuFe NPs (0, 1/10 of IC50, 1/2 of IC50, and 2/3 of IC50) µg/mL in 200 μL of culture medium for 24 h. After that, the assay was started by centrifuging the plate at 3000 r/min for 5 min and the supernatant was discarded. 200 µL of assay buffer was added to each well, and the plate was centrifuged at 3000 r/min for 5 min. The supernatant was removed. Then, add 100 µL of cell-based assay lysis buffer to each well and incubate on the shaker for 30 min at room temperature. After that, the plate was centrifuged at 3000 r/min for 10 min and 90 µL of the supernatant was transferred into a black 96-well plate. 10 µL of assay buffer and 10 µL of caspase-3/7 inhibitor solutions were added to appropriate wells. Finally, 100 µL of the caspase-3/7 substrate solution was added to each well and incubated for 90 min at 37 °C. A microplate reader was used to read the fluorescence intensity at 485 nm as excitation and 535 nm as emission. (Synergy-H1; BioTek).
Dual Staining of Hoechst and Propidium Iodide Assay
In apoptotic cells, based on chromatin condensation variations detected with Hoechst dye that appears as blue and dead cells detected with PI dye that appears in red as a result of membrane damage. However, cells were seeded at a density of 8 × 10⁴ in 200 μL of culture medium in transparent 6-well plates, and more culture medium was added to reach 2 mL/well. After being exposed to g CuFe NPs at concentrations of (0, 1/10 of IC50, 1/2 of IC50, and 2/3 of IC50) µg/mL for 24 h. Cells were washed 3 times with PBS and treated for 30 min in the dark with 50 μL of Hoechst and 20 μL of PI. Then, coverslips were shifted to slides and fluorescent pictures were captured with confocal microscopy (CRCL's LSM 780 NLO confocal microscope).
Translocation of Phosphatidylserine Assay
Both cells were cultured and incubated with g CuFe NPs at concentrations of (0, 1/10 of IC50, 1/2 of IC50 and 2/3 of IC50) µg/mL for 24 h. After incubation, the cells were fixed with paraformaldehyde (4%) for 10 min and then washed 2 times with cold PBS. Then cells were stained with PI (10 μL/mL) and Annexin V/FITC conjugate (2 μL) in a binding buffer (500 μL) for 30 min. Finally, coverslips were shifted to slides, and images were captured using a confocal microscope at emission 520 nm and excitation 488 nm for Annexin V/FITC and emission 617 nm and excitation 536 nm for PI. (CRCL's LSM 780 NLO confocal microscope).
Gene Expression
The RNA isolation and real-time polymerase chain reaction (PCR) amplification were performed as per Almutairi et al, 13 methods. GAPDH primer set was used for PCR amplification under the conditions recommended by the manufacturer (Table 1).
The Sequences of Primers.

The RT-PCR data were analyzed using the relative gene expression (ΔΔCt) method, as previously reported and discussed by Livak and Schmittgen.
14
The data was given as the fold change in gene expression adjusted to the endogenous reference GAPDH gene. The fold change in the level of target genes between treated and untreated cells, adjusted for the amount of GAPDH, was calculated as follows:
Statistical Evaluation
Statistical differences between the control and exposed groups were determined by a one-way ANOVA test using SPSS 26.0 software. The values of * P < .05 and ** P < .01 versus control were considered statistically significant and highly significant, respectively. Minimum 3 independent experiments were done in duplicate for each experiment.
Results
Physical Characterization of g Cu-Fe NPs
SEM-EDS results confirmed the formation of g Cu-Fe NPs and presence of other elements during the formation of g-Cu-Fe NPs (Figure 1A). Such as Fe by 6.398 keV and Cu by 8.040 to confirm the formation of Cu Fe nanoparticles (Figure 1A). The typical size of g Cu-Fe NPs is 24 ± 2 nm (Figure 1B). DLS and zeta potentials were used to measure the particle size and stability of g Cu-Fe NPs in suspension. The size of g Cu Fe NPs was measured at 217.8 ± 6 nm. The net charges (zeta potential) on the surface of the evaluated NPs in aqueous solution were measured by −0.683 mV.
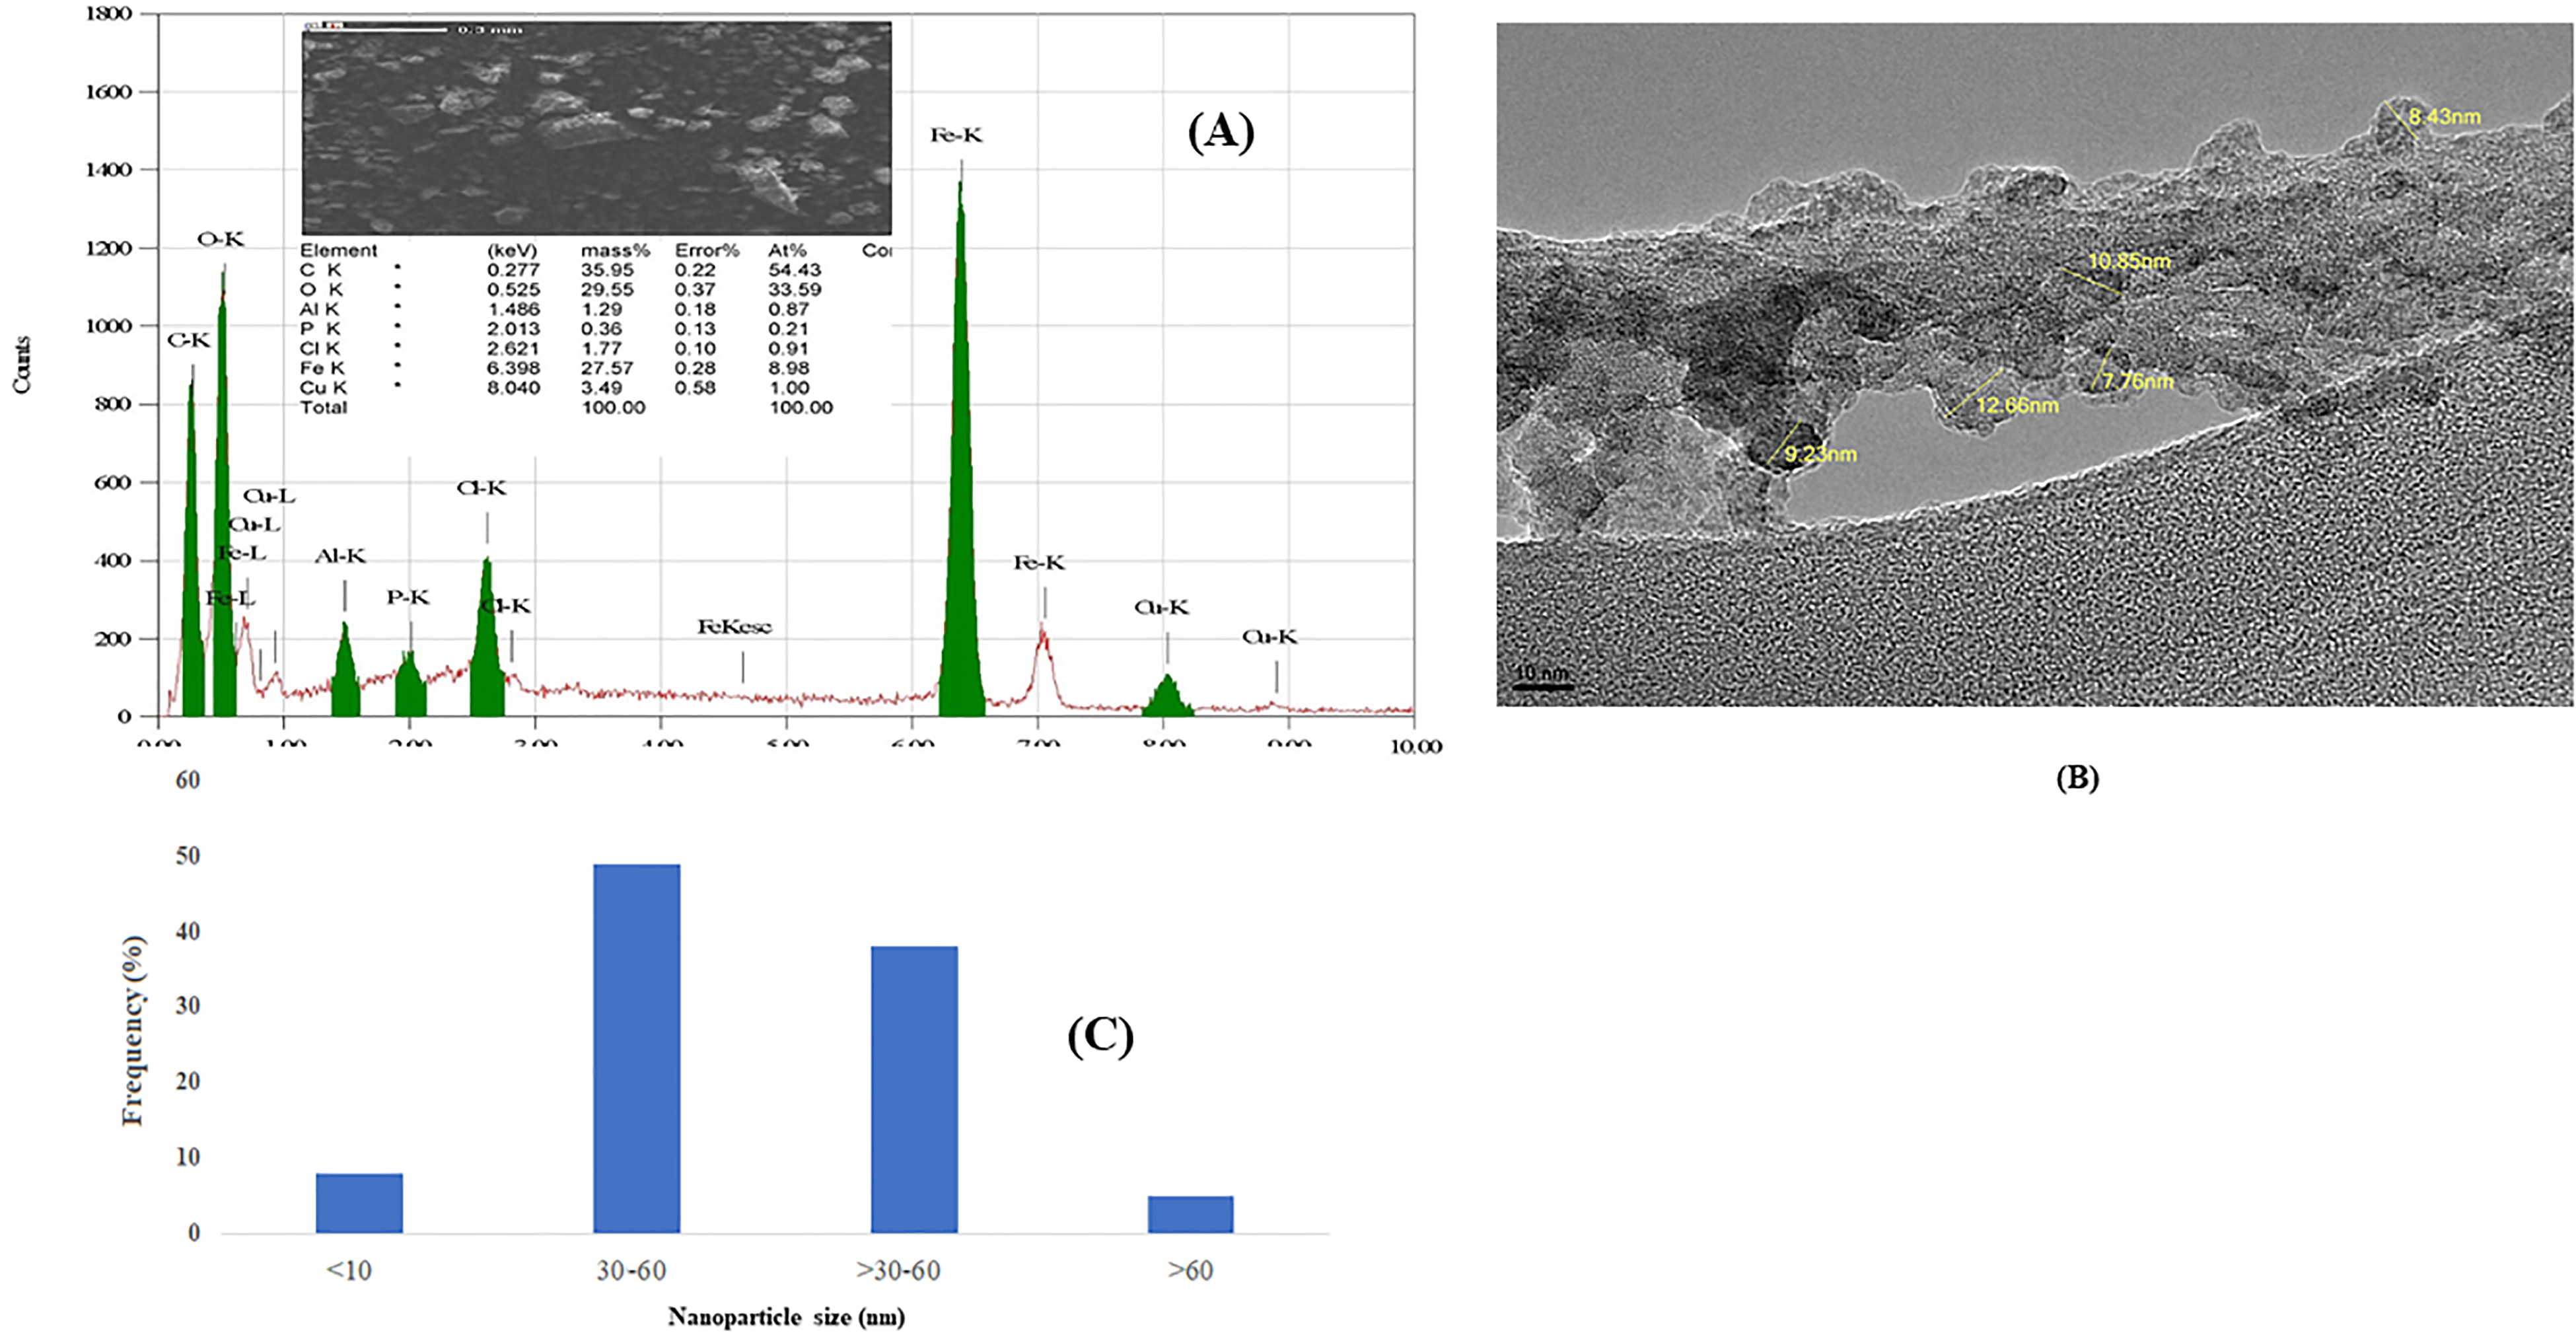
Characterization of green Cu/Fe nanoparticles (g-Cu-FeNPs). (A) EDX spectrum and image of g-Cu-FeNPs by scanning electrons microscope. (B) Image of g-Cu-Fe NCPs bu transmission electrons miscroscope (JEM 1011). (C) Size distribution of g-Cu-FeNPs histogram.
IC50 Value
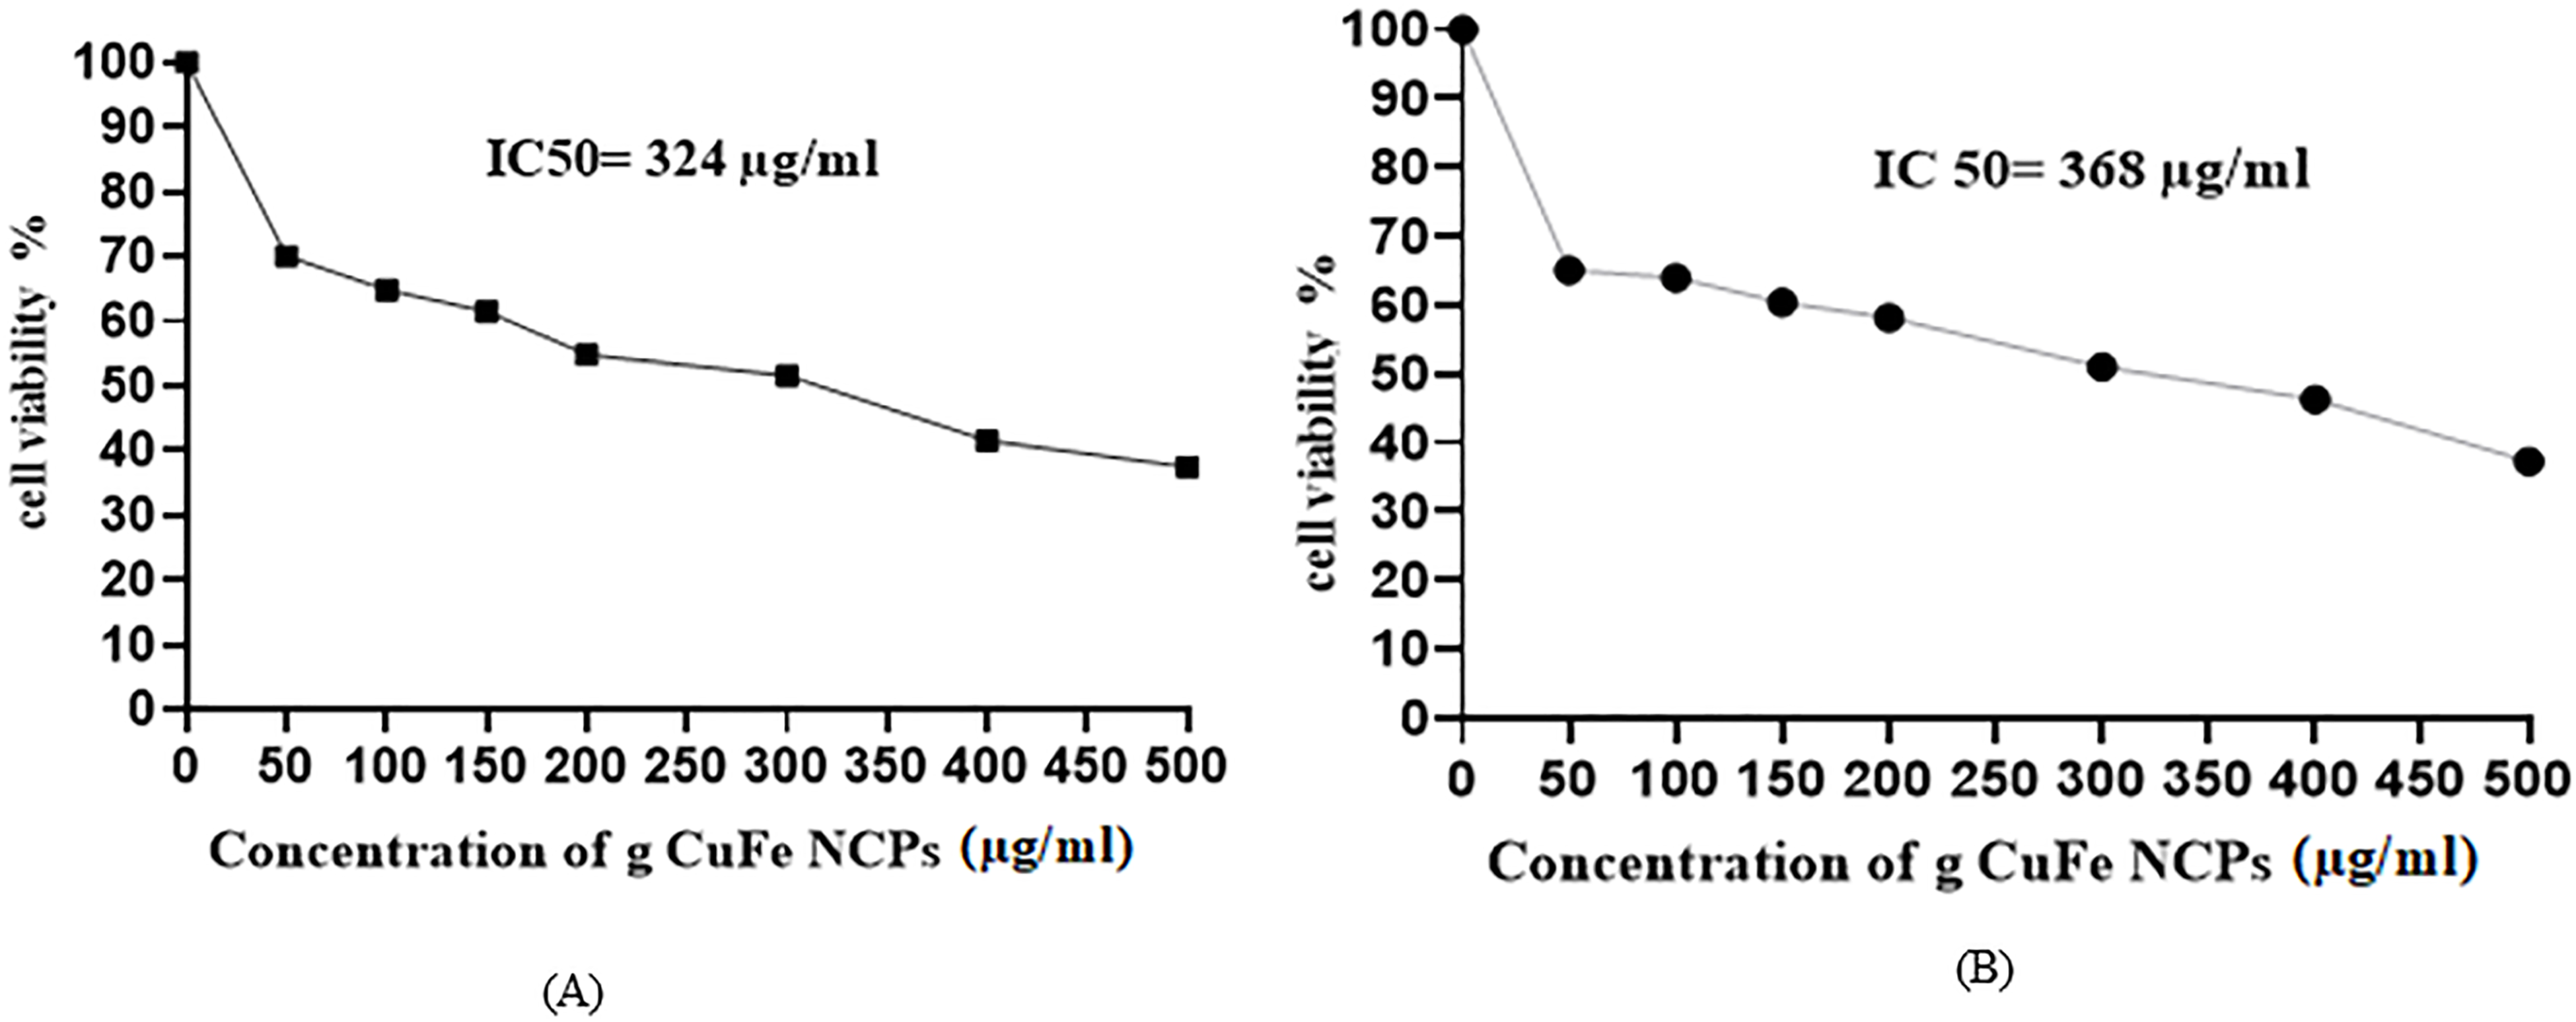
The IC50 value 24 h for g CuFe NPs on HuH-7 and MCF-7 cells were determined by the dose-response curve graph using the program OrigenPro 8.5, (Figure 2A, B) and it was determined on the basis of the MTT test result. We observed that IC50 value at 24 h for g-Cu-FeNPs was 324 μg/mL for HuH-7 cells and 368 μg/mL of g-Cu-FeNPs for MCF-7 cells (Figure 2A, B).

IC50-24 h value for green Cu/Fe nanoparticles (g-Cu-FeNPs) for (A) HUH-7 (B) MCF-7 cells lines based MTT assay result.
Cytotoxicity of g Cu Fe NPs on HuH-7 and MCF-7 Cells
Total cell viability is proportional to the number of viable cells, which are metabolically active cells that convert the tetrazolium salt (MTT) to a purple formazan crystal. The different concentrations of g CuFe NPs (control, 50, 100, 150, 200, 300, 400, and 500 μg/mL) were exposed to HuH-7 and MCF-7 cells for 24 h. The results revealed a significant decrease in cell viability in the HuH-7 cell line (70%, 64%, 61%, 54%, 51%, 41%, 37%) and (65%, 63%, 60%, 58%, 50%, 46%, 37%), respectively, for the MCF-7 cell line (Figure 3A). Furthermore, the decline was detected in a dose-dependent manner (Figure 3A).
Different concentrations of green Cu/Fe nanoparticles (g-Cu-FeNPs) induced cytotoxicity in HUH-7 and MCF-7 cell lines in a dose-dependent manner. (A) MTT assay (B) NRU assay. Each value represents the mean ± SE of 3 experiments, *P < .05 and **P < .01 versus control.
The neutral red uptake assay determines the number of viable cells in a culture in a quantifiable form. It is based on live cells’ capacity to absorb and bind the supravitally dye-neutral red in lysosomes. The NRU assay results for HUH-7 and MCF-7 cell lines show that g-Cu Fe NPs caused cytotoxicity in a concentration-dependent manner (Figure 3B). The results indicated a decrease in cell viability with (85%, 82%, 81%, 79%, 63%, 53%, 43%), respectively, for HUH-7 and with (88%, 86%, 84%, 70%, 65%, 56%, 42%), respectively, for MCF-7 (Figure 3B).
Reactive Oxygen species (ROS)
The production of ROS was measured using the DCFH-DA dye as a fluorescence agent. In short, different concentrations of g Cu-Fe NPs (1/10 of the IC50, 1/2 of the IC50, and 2/3 of the IC50µg/mL) were exposed to HuH-7 and MCF-7 cell lines for 24 h, and then a ROS assay was performed. The result shows an increasing effect of ROS in treated cells compared to control (104%, 102%, and 105%) for HuH-7, respectively, and (105%, 105%, and 99%) for MCF-7, respectively (Figure 4A). The increase in ROS at 1/10 of the IC50 concentration was significant. Figure 4A shows ROS expression in both cell lines.

(A) Generation of green fluoresence in HuH-7 and MCF-7 cell line after exposure to various concentrations of g-Cu-FeNPs for 24 h. (B) Percentage of intracellur ROS generation in HuH-7 and MCF-7 cell line. *P < .05 versus control. Abbreviations: g-Cu-FeNPs, green Cu/Fe nanoparticles; ROS, reactive oxygen species.
Oxidative Stress Assay
The results indicate an increase in lipid peroxidation (LPO) activity for treated cells compared to nontreated control cells in both HuH-7 and MCF-7 cell lines. After the calculation of LPO activity, the OD was measured as (100% for 1/10 of IC50, 106% for 1/2 of IC50, and 106% for 2/3 of IC50) respectively for HuH-7 cells and (102% for 1/10 of IC50, 109% for 1/2 of IC50, and 112% for 2/3 of IC50) respectively for MCF-7 cells (Figure 5A). The 2/3 of IC50 dose in MCF-7 was significantly increasing compared to the control, and the 2 cell lines in 1/2 and 2/3 of IC50 were significant compared to the control. The results revealed an increase in CAT activity in HuH-7 cells with 100% for 1/10 of IC50, 108% for 1/2 of IC50, and 115% for 2/3 of IC50 µg/mL, respectively, and in MCF-7 cells with 115% for 1/10 of IC50, 134% for 1/2 of IC50, and 135% for 2/3 of IC50 µg/mL, respectively (Figure 5B, A). An increase in 1/2 of IC50 and 2/3 of IC50 in MCF-7 cells was significant compared to the control.

Percentage of (A) LPO activity (B) CAT activity after exposure of different concentrations of g-Cu-FeNPs in HUH-7 and MCF-7 cell lines in 24 h. Each value represents the mean ± SE of 2 experiments. *p < 0.05, **p < 0.01 versus control. Abbreviations: LPO, lipid peroxidation; g-Cu-FeNPs, green Cu/Fe nanoparticles.
Cellular DNA Fragmentation and Caspase-3 Enzyme Activity
The cellular DNA fragmentation ELISA detects BrdU-labeled DNA fragments using a photometric ELISA. The nuclear DNA of target cells uses BrdU as a metabolic labeling agent. Using a monoclonal antibody against BrdU, this BrdU-labeled DNA may be easily identified and measured. After exposing to different concentrations of g CuFe NPs (1/10 of IC50, 1/2 of IC50, and 2/3 of IC50) µg/mL to HuH-7 and MCF-7 cell lines, The results detect an increasing OD percentage in DNA fragmentation with 149% for 1/10 of IC50, 154% for 1/2 of IC50, and 185% for 2/3 of IC50 µg/mL, respectively, for HuH-7 cells and 102% for 1/10 of IC50, 142% for 1/2 of IC50, and 169% for 2/3 of IC50 µg/mL, respectively, for MCF-7 cells (Figure 6A)
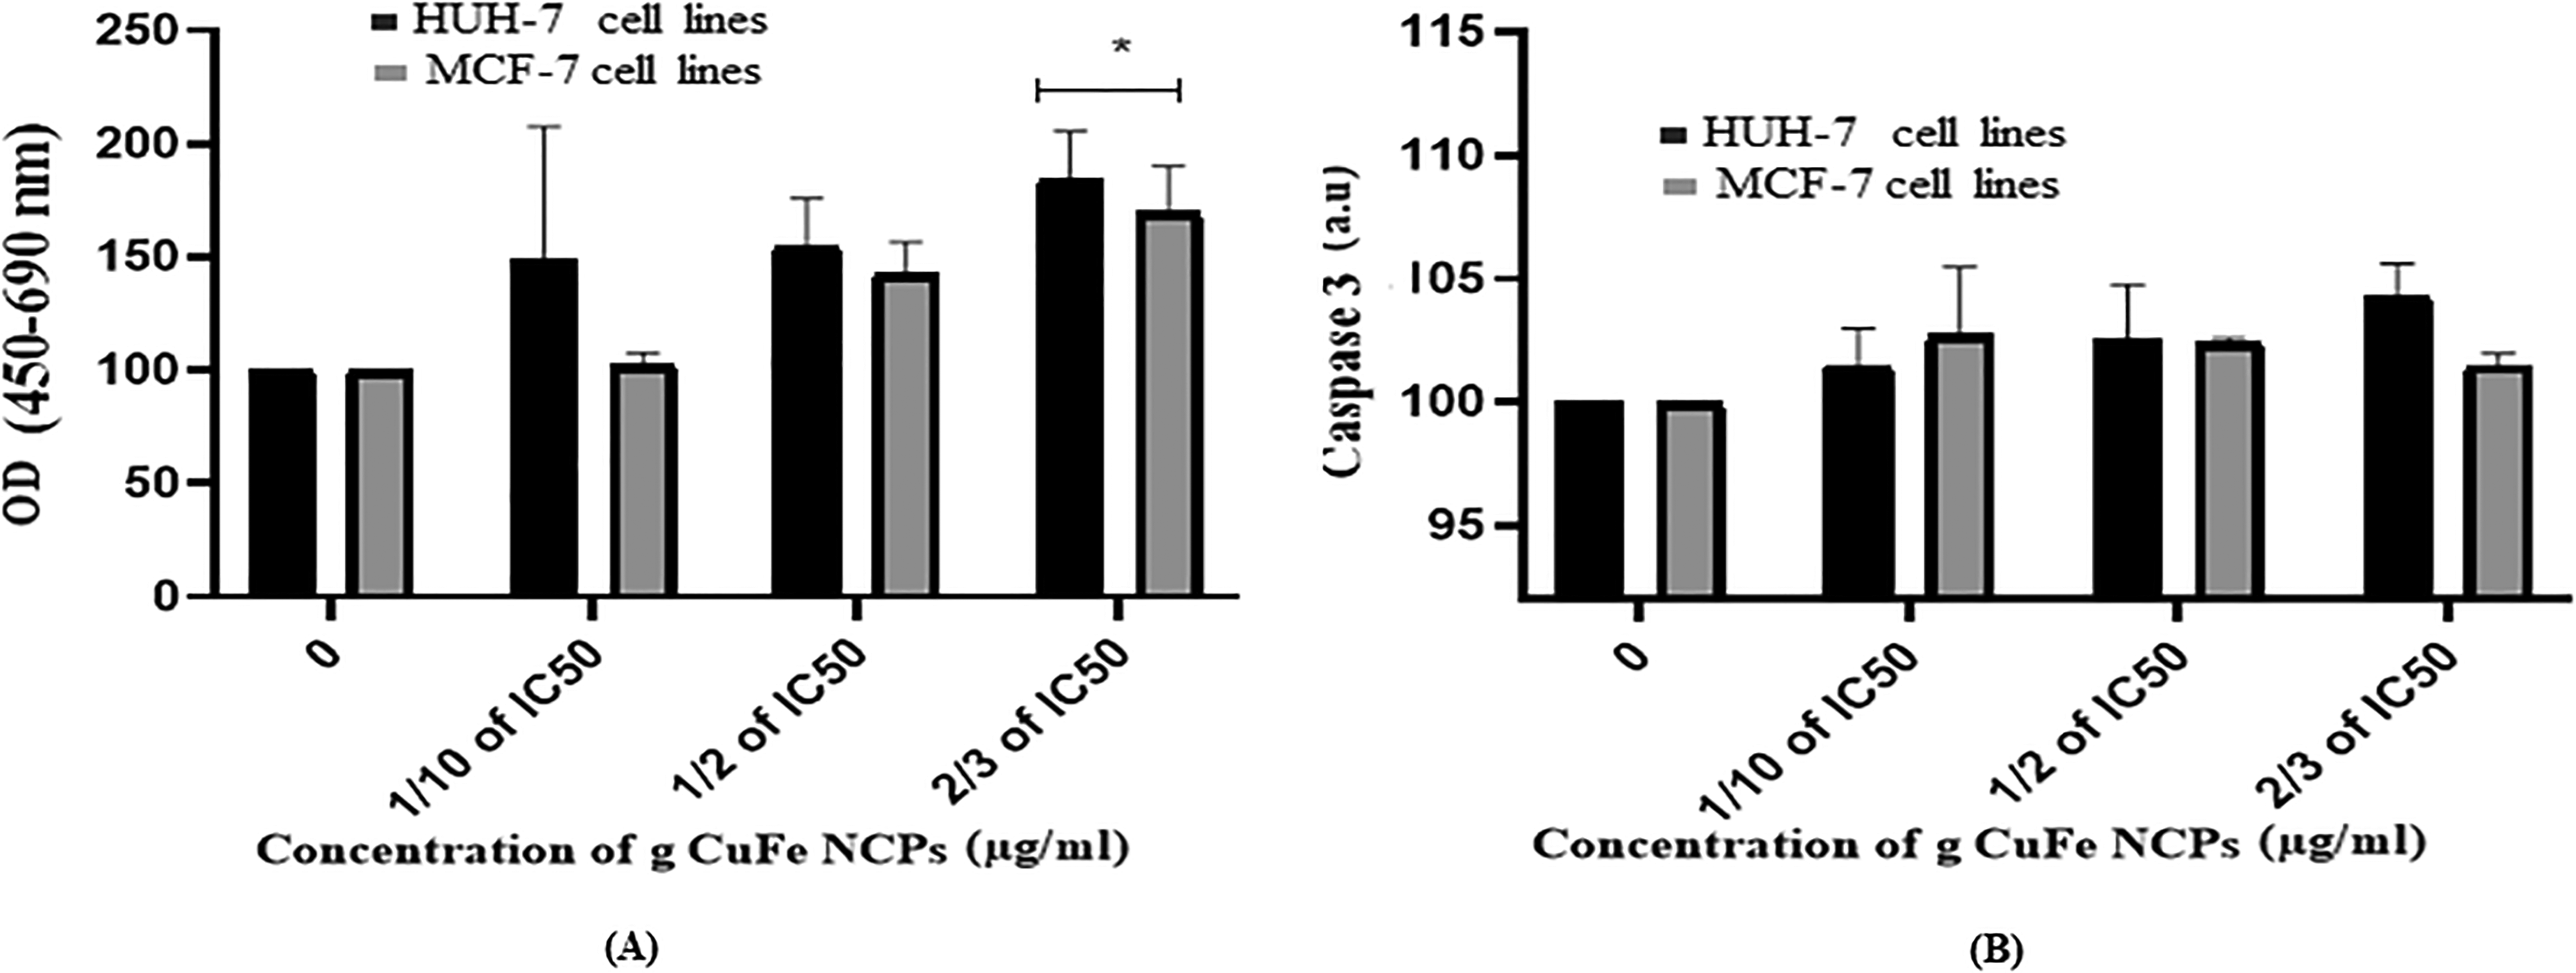
After exposure different concentrations of green Cu/Fe nanoparticles (g-Cu-FeNPs) induced. (A) DNA fragmentation activity. (B) Caspase-3 activity in HUH-7 and MCF-7 cell lines in 24 h. Each value represnts the mean ± SE of 3 experiments. *p < 0.05 versus control.
Caspases-3 enzymes are an endo-protease family that serves as a vital link in cell regulatory networks that govern inflammation and cell death. Cells were exposed to different concentrations of green copper-iron NCP's (0, 1/10 of IC50, 1/2 of IC50, and 2/3 of IC50) µg/mL for 24 h. After that, the assay was performed, and the results showed that caspase-3 activity was increasing in treated HuH-7 cells compared to the control cells by 102%, 103%, and 104%, and in treated MCF-7 cells compared to control cells by 103%, 103%, and 102% (Figure 6B).
Apoptosis Using a Confocal Microscope
Using a confocal microscope to find apoptotic cells based on chromatin condensation variations detected with Hoechst dye that appear as blue and dead cells detected with PI dye that appear in red for membrane damage cells were seeded at a density of 8 × 10⁴ in 200 μL of culture medium in transparent 6-well plates and exposed to g- Cu-Fe NPs at concentrations of (0, 1/10 of IC50, 1/2 of IC50, and 2/3 of IC50) µg/mL for 24 h. Results showed a significant increase in the number of apoptotic cells compared to the control untreated cells in the HuH-7 cell line and the MCF-7 cell line. g-Cu-Fe NPs treatment illustrated a higher number of apoptotic cells as compared to the control, as shown in Figure 7A, B.
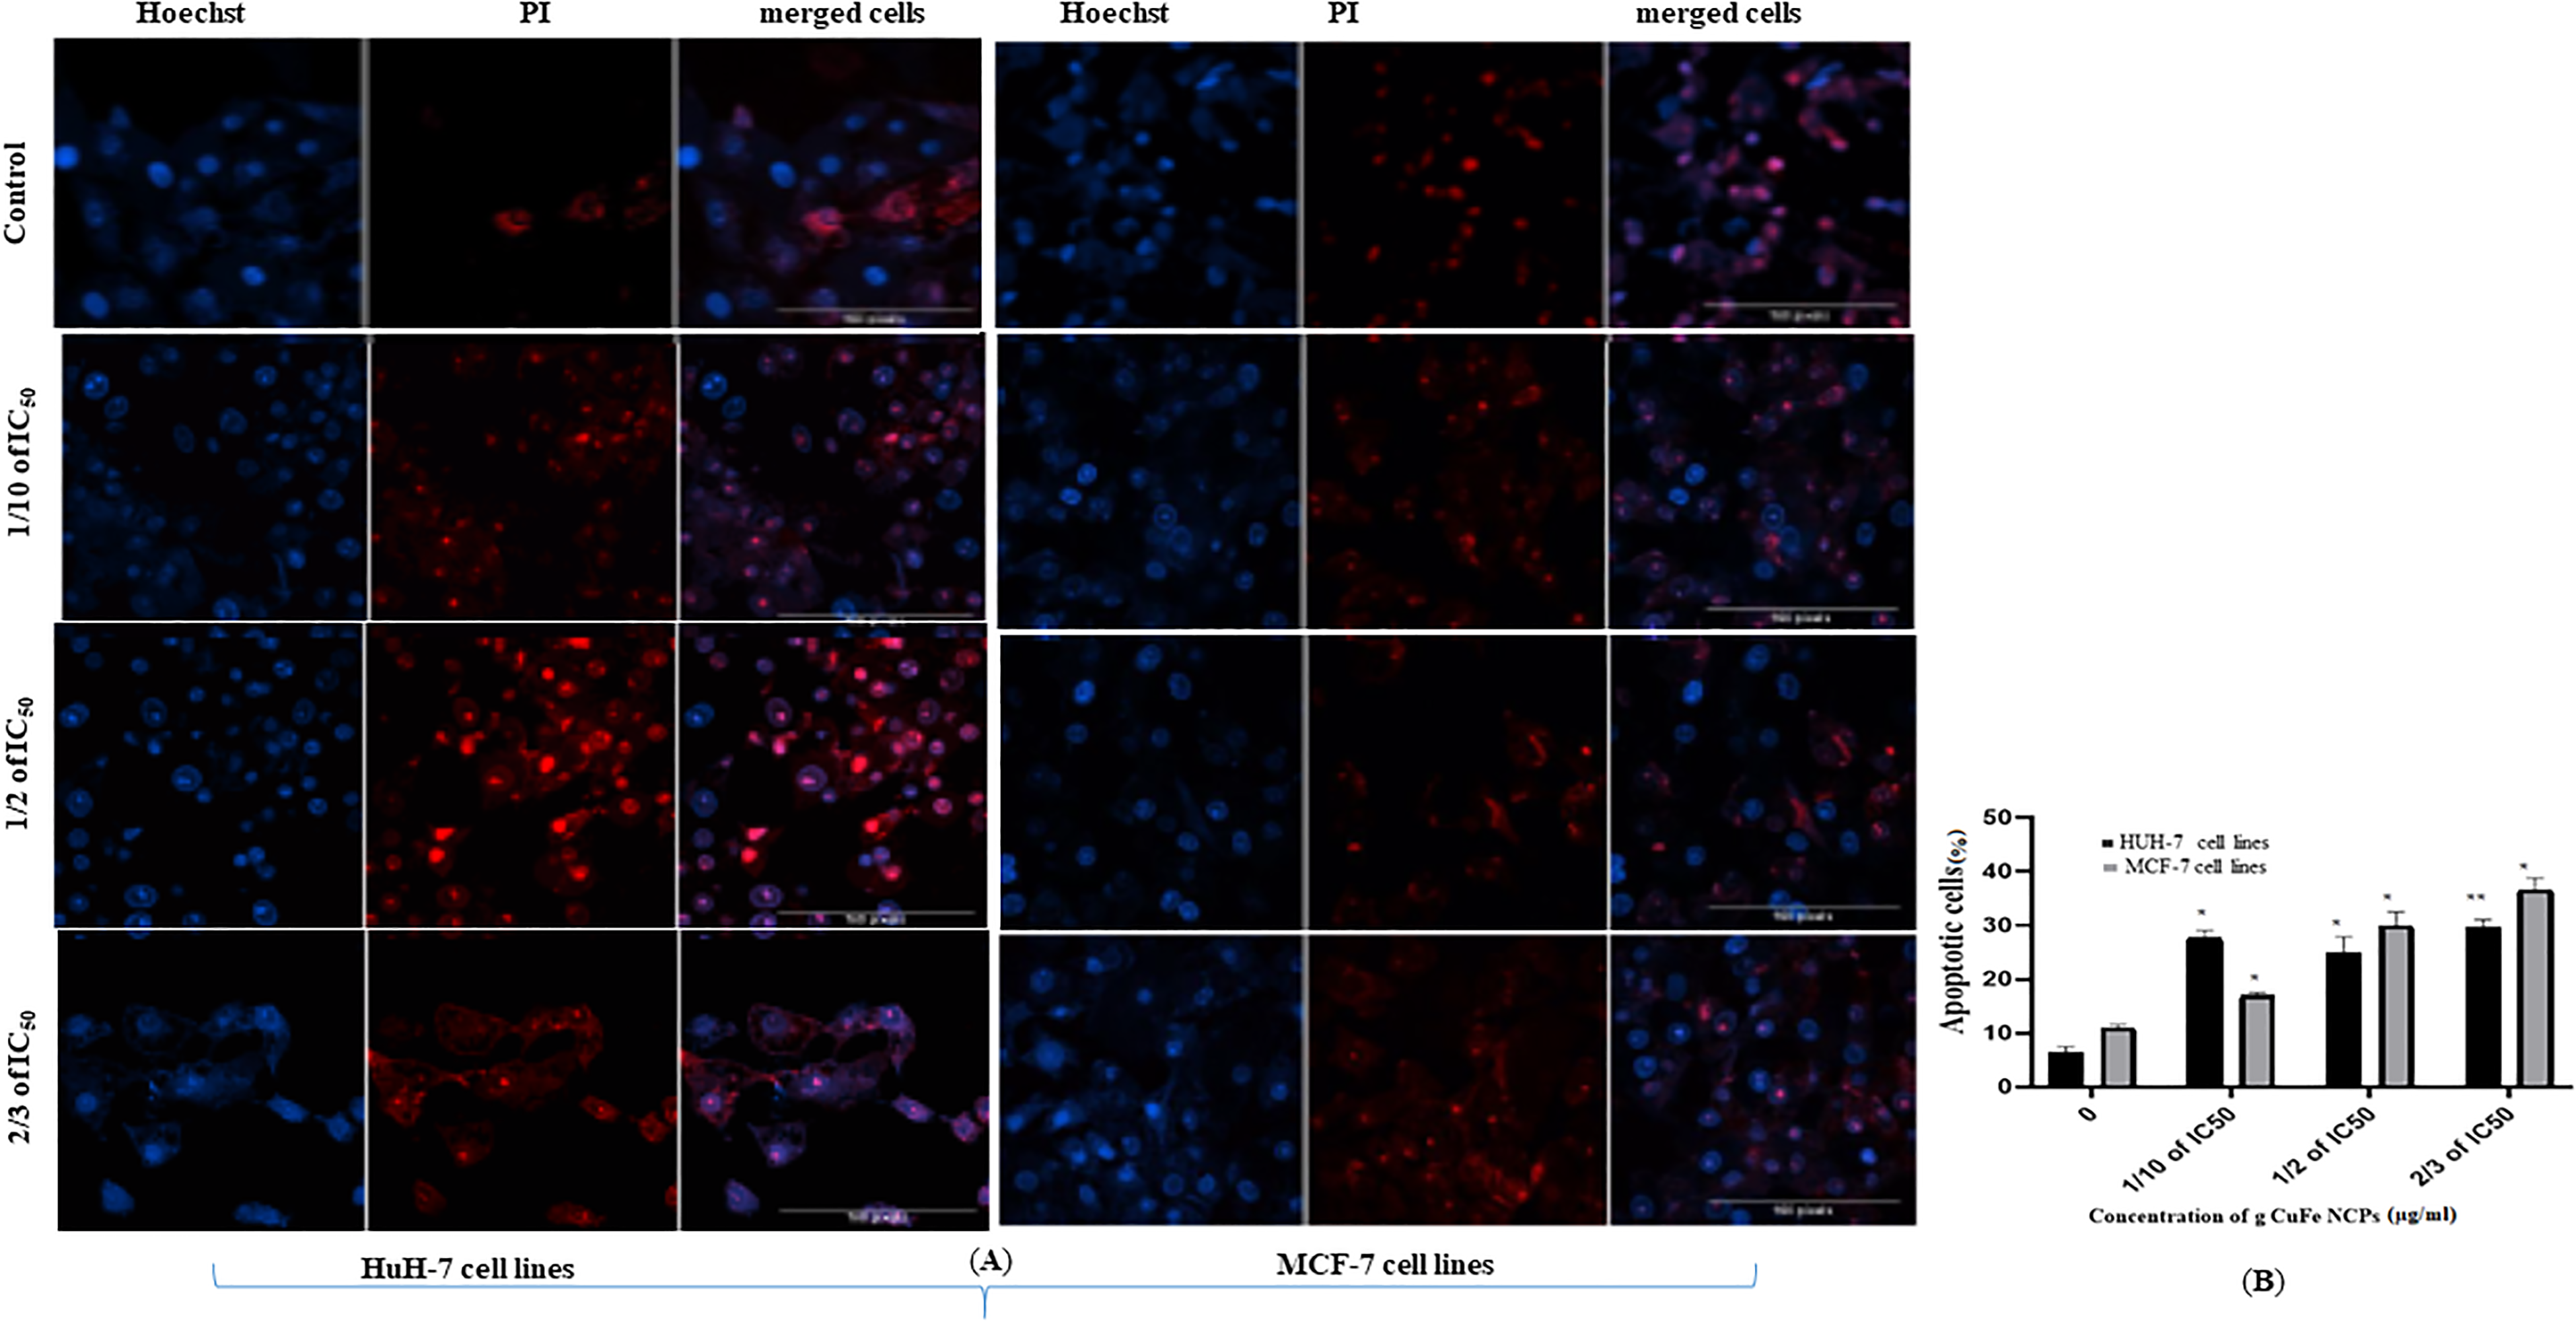
(A). Apoptotic and necrotic cells in HuH-7 and MCF-7 cells (B). Percentage of apoptotic cells in HuH-7 and cells after exposure of g-Cu-FeNPs through Hoechst 33342 and PI double staining methods. Each value represents the mean ± SE of 3 experiments. *P < .05 and **P < .01 versus control. Abbreviations: g-Cu-FeNPs, green Cu/Fe nanoparticles; PI, propidium iodide.
Translocation of Phosphatidylserine in Cells
The cells were stained using FITC-labeled Annexin V (green fluorescence), while dye exclusion of PI was performed. Cells were seeded at a density of 5 × 10⁴ in 200 μL of culture medium in transparent 6-well plates, and more culture medium was added to reach 2 mL/well. After being exposed to g Cu-Fe NPs at concentrations of (0, 1/10 of IC50, 1/2 of IC50, 2/3 of IC50) µg/mL for 24 h, the assay was done, and the results indicated a significant increase in apoptotic cell number in all concentrations and cells. The number of apoptotic cells compared to the control is shown in Figure 8A and B.

(A). Phosphatidylserine translocation (early apoptotic biomarker) in HuH-7 and MCF-7 cells (B). percentage of early apoptotic cells in HuH-7 and MCF-7 cells after exposure of g-Cu-FeNPs through annexin V FITC and PI double staining methods. Each value represents the mean ± SE of 3 experiments. *P < .05 and versus P < .01 versus control. Abbreviations: FITC, fluorescein isothiocyanate; g-Cu-FeNPs, green Cu/Fe nanoparticles; PI, propidium iodide.
Gene Expression
Gene expression was performed in order to detect the effect of g Cu Fe NPs on cells at the gene level. The cDNA for specific apoptotic genes was synthesized after cells were seeded and exposed to g Cu Fe NPs. The RT-PCR data were analyzed using the relative gene expression (Ct) method. Thus, the data was given as the fold change in gene expression adjusted to the endogenous reference GAPDH gene (Figure 9A, B, C, and D). The fold change in the level of target genes between treated and untreated cells is represented in Figure 9A, B, C, and D. The p53 gene expression in cells treated with 1/10 of IC50 and 2/3 of IC50 was increasing significantly compared to control in HuH-7 and MCF-7 cells (Figure 9A). Furthermore, at the caspase-3 gene level, there is an increase in fold change mRNA expression of most of the g-Cu Fe NP concentrations, for instance, a significant increase in 1/10 and 2/3 highest doses on MCF-7 and a significant increase in the highest dose also in HuH-7 cells (Figure 9B). Moreover, the Bax gene, which is considered one of the apoptotic factors, was expressed with significant increases in 1/2 of the IC50 and 2/3 of the IC50 in both MCF-7 and HuH-7 cells (Figure 9C). While Bcl2 gene expression is significantly decreasing in all concentrations on the MCF-7 cell line and the HuH-7 cell line (Figure 9D),

After exposure of different concentrations of green Cu/Fe nanoparticles (g-Cu-FeNPs) induced expresion of (A) p53 (B) caspase-3 (C) Bax (D) BCL2 gene in HUH-7 and MCF-7 cell lines in 24 h. Each value represents the mean ± SE of 3 experiments. *P < .05 and P < .01 versus control.
Discussion
Nanotechnology is one of the newest technologies in creative research because of its various applications in science and technology. 15 However, a major and simultaneous outcome of these increasing nano-based applications is that humans are not aware of the greater risk of exposure to nanomaterials, which can enter biological systems through different routes.17 Particularly, nanoparticles have the ability to change size in a variety of media and provide a visibly increased surface area relative to mass. 16 Copper, iron, and zinc oxide nanoparticles are now being explored due to their potential use in a number of fields, including drug and gene delivery, bio-sensors, cancer therapy, and diagnostics.19 Surprisingly, the EPA (US Environmental Protection Agency) approved Cu-based nanoparticles (Cu NPs) as an antibacterial agent. 17 All of these features made Cu and Fe nanoparticles considered important in research areas. Various studies have demonstrated that M charantia contains a variety of bioactive substances, including triterpenes, alkaloids, steroids, phenols, etc 18 The phenolic component of M charantia fruit extract, which is known to have a strong reducing capacity, can be used to hypothesize and explain the process of CuO NPs production. 19 David et al 20 reported that M charantia fruit extracts were used in the green synthesis of copper nanoparticles, and their anti-microbial effectiveness was assessed. M charantia leaf extract was used as a convenient and environmentally friendly method to decrease Cu2+ ions in the copper sulfate solution, resulting in the production of CuO NPs.
In this study, CuFe NPs were synthesized with M charantia peel, and their cytotoxic effect was investigated on HuH-7 and MCF-7 cells. However, TEM analysis was performed to collect essential information on the size and shape of the initial nanoparticles. Furthermore, the TEM image indicated that the majority of the nanoparticles were aggregated and polygonal in form. In the cytotoxic study of g-CuFe NPs, MTT indicates that the NPs were toxic in the HuH-7 cell line and for the MCF-7 cell line. Thus, the IC50−24 h was 324 μg/mL for HuH-7 and 368 μg/mL for MCF-7. Although Cu and Fe are both well-known functional elements in several cellular and metabolic processes, they can have negative consequences in high amounts. 21 Additionally, Cu NPs had a significant cytotoxic effect on MDA-MB-231, which is a different type of human breast cancer cell. 22 It is possible that after being absorbed by tumor cells, both Cu and Fe nanometals will eventually degrade and produce Cu2+ and Fe2 + ions.
In a healthy environment, ROS promotes development and growth; yet, in a stressful environment, ROS can have pathological effects, including cell death. Apoptosis is caused by excessive intracellular ROS levels.26 In our study, g-Cu Fe NPs relieved an increasing effect of ROS in treated cells compared to control for HuH-7, respectively, and for MCF-7. In another study of how Cu/CuO NPs inhibited the growth and viability of both healthy and cancerous lung cells, Cu/CuO NPs were applied to human lung cancer cells and human lung normal cell lines (WI-38), resulting in the generation of ROS and an oxidative stress state. 23 As well, using the DCFHDA assay, the ability of Cu-NPs to conformably elevate intracellular ROS levels was assessed in human breast cancer MCF-7 cells.
Apoptotic cells exhibit a number of cellular and molecular biological characteristics, such as DNA fragmentation, cell shrinkage, and caspase cascade activation. The hallmark of apoptosis is caspase-3 activation, which is required for DNA fragmentation and apoptotic chromatin condensation in all cell types analyzed.28 The results of our study detected an increase in DNA fragmentation for HuH-7 cells and for MCF-7 cells. Furthermore, apoptosis was also measured by different stains such as PI, Hoechst, and Annexin-V FITC, which revealed a significant increase in the number of apoptotic cells in all experiments and in HuH-7 and MCF-7 cell lines, indicating that G-Cu-Fe NPs increase apoptosis in a dose-dependent manner.
One of the most important transcription factors for the oxidative stress response is the p53 gene. 24 The release of cytochrome c from the mitochondria is triggered by the up-regulation of the p53 gene and the stimulation of the Bax/Bcl-2 ratio, which also strengthens the caspase cascade and apoptotic pathway. The p53 gene expression in cells treated with g-Cu-Fe NPs was increasing compared to control in HuH-7 and MCF-7 cells. While, in Bcl2 gene expression, a significant decrease in all of the IC50 doses on the MCF-7 cell line was detected compared to the HuH-7 cell line, a minor decrease in expression was detected.
Conclusion
On the basis of our findings in this experiment, we conclude that in the future, new anticancer therapies can be developed using different approaches, such as a combination of metals targeting multiple cancer cell lines, exploring different in vivo models to reveal interlinked signaling pathways, and identifying the potential benefits of green nanocomposite in different cancer types to achieve targeted drug delivery.
Footnotes
Data Availability Statement
The original contributions presented in the study are included in the article; further inquiries can be directed to the corresponding author.
Declaration of Conflicting Interests
The author(s) declared no potential conflicts of interest with respect to the research, authorship, and/or publication of this article.
Funding
This research was supported by Researchers Supporting Project number (RSP2023R27), King Saud University, Riyadh, Saudi Arabia.