
Abstract
Background
Antibodies, which target programmed cell death protein-1 (PD-1) or its ligand programmed death ligand-1 (PD-L1), can rescue T cells from an exhausted state and resume their immune response to cancer cells. Clinically, the purpose of blocking the PD-1/PD-L1 signaling pathway is to induce immune cells to play an anti-tumor role. However, the effect of intertumor PD-1/PD-L1 signal blocking on tumor cells remains unclear.
Methods
HepG2 cells were treated with DHA, IFN-γ, BSA, DDP, PD-1-Fc (1 μg/ml), IgG-Fc, nivolumab, or human IgG for 24 h, respectively. GEPIA, cBioPortal, and TIMER databases were used to analyze the correlation between YAP1, PD-1, and PD-L1 and ERK, ERK-5, JNK, and p38. Western blot was used to detect the expression of YAP1 and p-ERK.
Results
GEPIA, cBioPortal, and TIMER databases analysis showed that YAP1 was positively correlated with ERK. After HepG2 cells were treated with PD98059 (ERK inhibitor), the expression of YAP1 was decreased. In this study, we investigated the inhibitory effect of PD98059 on PD-1/PD-L1 signaling. Our study found that PD-1-Fc (PD-1 fusion protein) promoted the expression of p-ERK/ERK and YAP1 in HepG2 cells. In contrast, nivolumab (PD-1 blocking antibody) reduced the expression of p-ERK/ERK and YAP1 in IFN-γ-pretreated HepG2 cells. In addition, the application of DHA also inhibited the expression of p-ERK/ERK to inhibit YAP1. Furthermore, treatment of HepG2 cells with DHA alone or DHA combined with cisplatin (DDP) both inhibited the expression of p-ERK/ERK and YAP1.
Conclusions
These results suggested that PD-1/PD-L1 interactions between tumor cells could promote the expression of ERK or YAP1 within tumors. Moreover, the conduction of PD-1/PD-L1 could be reversed using ERK inhibitors.
Introduction
Liver cancer is the fourth leading cause of cancer-related death worldwide, although the liver is the sixth most common site for primary cancers. 1 Tyrosine protein kinase inhibitors such as sorafenib, regorafenib, and lenvatinib are considered to be the most effective targeted drugs and the only effective therapy for patients with advanced liver cancer. 2 However, one study found that sorafenib could only extend survival by 3 months in patients with advanced liver cancer, and drug resistance problems appeared. 3 Therefore, understanding the mechanism of liver cancer cell proliferation and developing new therapeutic strategies are of great significance for the treatment of liver cancer.
Yes-associated protein 1 (YAP1) was a key effector molecule downstream of the Hippo signal pathway, and activation of YAP1 was an early event of liver cancer. 4 Regulation of YAP1 expression mainly occurred at the translational level or the level of phosphorylation or ubiquitination of posttranslational proteins. However, there are few studies on the mechanism of reducing YAP1 expression. One strategy to reduce YAP1 expression was to turn off YAP1 function by activating a series of kinases in the Hippo pathway that phosphorylate YAP1 at Ser127 (Ser112 in mice) and then retained it in the cytoplasm.
Mitogen-activated protein kinases (MAPK) were a class of serine/threonine protein kinases existing in eukaryotic cells, which was one of the main pathways of intracellular signal transduction. Extracellular signal-regulated kinase 1/2 (ERK1/ERK2) were important members of the MAPK family, and they shared 90% homology. They phosphorylated and activated a variety of nuclear transcription factors and protein kinases and also regulated the transcription of related genes. Studies showed that the MAPK signaling pathway was an important pathway mediating YAP1 activation in liver cancer. 5
Currently, most studies of programmed death ligand-1 (PD-L1) receptor, namely, programmed death-1 (PD-1), mainly focused on T cell functions, including downstream signaling functions that inhibited T cell proliferation, cytokine production, and cytotoxicity. 6 Recently, a study found that PD-1 was expressed not only on the surface of immune cells (such as T and B cells) but also on liver cancer and melanoma cells. 7 Both liver cancer cell lines and clinical liver cancer tissues expressed PD-1, which promoted tumor progression even in the absence of an immune environment. In contrast, PD-1 blocking or knockdown inhibited tumor growth independently of adaptive immunity. 7 Therefore, the binding of PD-1 and PD-L1 between tumor cells activated and promoted tumor cell proliferation.
The binding of PD-1 and PD-L1 was found to promote the activation of MAPK and the phosphorylation of extracellular signal-regulated kinase (ERK) and mTOR in tumor cells, increasing the resistance of breast and prostate cancer cells to conventional drugs. 8 With the in-depth research on the regulatory mechanism of PD-L1 expression, one study found that the upregulated expression of PD-L1 in primary liver cancer tissues was positively correlated with the low survival rate of patients.9,10 PD-L1 on the surface of tumor cells binds to PD-1 on the surface of T cells, resulting in tyrosine phosphorylation of part of the cytoplasmic domain of PD-1 in T cells. The recruitment of the SH2 domain-containing tyrosine phosphatase 2 (SHP2) leads to the exhaustion or dysfunction of tumor-infiltrating lymphocyte (TIL) function and tumor immune escape. 11 At the same time, the binding of PD-1 and PD-L1 promoted the activation of MAPK and the phosphorylation of ERK and mTOR in tumor cells, increasing the resistance of breast and prostate cancer cells to conventional chemotherapy drugs. 8
Dihydroartemisinin (DHA), an FDA-approved antimalarial drug, was an important product of artemisinin metabolism in vivo. Our previous study found that DHA promoted the death of head and neck squamous cell carcinoma and cervical cancer. 12 In this study, we found that DHA inhibited HepG2 cell proliferation by inhibiting the expression of p-ERK/ERK and YAP1. These results showed that the effect of DHA on the proliferation of liver cancer cells through the PD-L1/ERK/YAP1 pathway was investigated.
Materials and Methods
Cell Line and Treatment
HepG2 cells and Huh7 cells were purchased and identified from Procell Life Science & Technology Co., Ltd (Wuhan, China). They were cultured in DMEM (Biological Industries, Israel) supplemented with 10% fetal bovine serum (PAN, USA), 100 U/ml penicillin, and 100 μg/ml streptomycin in an atmosphere of 37 °C, 5% CO2%, and 100% humidity.
DHA was purchased from Tokyo Chemical Industry, Co., Ltd (Tci, Tokyo, Japan). Human PD-1-Fc was purchased from T&L Biotechnology Co., Ltd (T&L Biotechnology, China), and DDP (Cayman Chemical, USA), human IgG-Fc (Cusabio, China), nivolumab (Report Biotech, China), PD98059 (Cayman Chemical, USA) were dissolved in DMSO (Solarbio, China) and stored at −20 °C. Recombinant human IFN-γ (PeproTech, USA) was dissolved in 1 mg/ml BSA (Report Biotech, China). Huh7 cells were treated with IgG-Fc (1 μg/ml) and PD-1-Fc (0.1 μg/ml, 0.5 μg/ml, 1 μg/ml). HepG2 cells were treated with DHA (10.75, 21.5, 43 μM), 13 IFN-γ (75 ng/ml), 14 BSA (1 mg/ml), DDP (10 μM), 15 PD-1-Fc (1 μg/ml), 14 IgG-Fc (1 μg/ml), nivolumab (100 μg/ml), or human IgG (100 μg/ml) for 24 h, respectively. Pretreatment with PD98058 (10 μM) for 2 h. The culture medium containing 0.1% DMSO was used as the control.
Cell Viability Assay
HepG2 cells were seeded in 96-well plants (1 × 10⁴ cells/well) and treated with DHA (21.5 μM), DDP (10 μM), and DHA (21.5 μM) + DDP (10 μM) for 24 h, respectively. Cell viability was determined with Cell Counting Kit-8 (CCK-8, RP-RC3028, Report Biotech, China) according to the protocol. Finally, optical density (OD) was monitored at 450 nm with 650 nm as a reference wavelength by infinite 50 (Tecan, Switzerland)
Western Blot Analysis
HepG2 cells and Huh7 cells were seeded in 6-well plates (1 × 10⁶ cells/well) and treated as described above. After brief washing in PBS, the cells were directly lysed by lysate. The primary antibodies were rabbit anti-YAP1 monoclonal antibody (ET1608-30, HUABIO, diluted at 1:2000), rabbit anti-ERK monoclonal antibody (ET1601-29, HUABIO, diluted at 1:1000), rabbit anti-p-ERK monoclonal antibody (ET1601-13, HUABIO, diluted at 1:2000), rabbit anti-PD-1 monoclonal antibody (ET1606-41, HUABIO, diluted at 1:1500), rabbit anti-PD-L1 monoclonal antibody (ET1701-41, HUABIO, diluted at 1:1000), rabbit anti-GAPDH monoclonal antibody (HUABIO, diluted at 1:2000), and rabbit antitubulin monoclonal antibody (P07437, Abiways, diluted at 1:5000). The secondary antibody was goat antirabbit IgG-HRP (S1002, Repart, diluted at 1:10000). The bands were detected by ECL (enhanced chemiluminescence) detection systems (Bio-Rad, ChemiDoc XRS+, USA). The results were measured by Image-Pro Plus v6.0 software (Media Cybernetics, USA).
Wound-Healing Assay
HepG2 cells (1 × 10⁶ cells/well) were seeded into 6-well plates. After the cells grow in the dish, the cells are then scratched with a sterile plastic tip. Sterile PBS was used for washing three times, the scratched cells were removed, and DMAO and DHA were then added to a serum-free medium. Finally, images were taken under the microscope at 24 h and 36 h to assess the closure rate.
Survival Analysis
The University of ALabama at Birmingham CANcer data analysis Portal (UALCAN) (http://ualcan.path.uab.edu/analysis.html) was used to perform the overall survival (OS) of patients. P < 0.05 was regarded as statistically significant.
Acquisition of DHA and Liver Cancer Targets
The 2D structure of DHA was downloaded by PubChem (https://pubchem.ncbi.nlm.nih.gov/) database, and the targets were screened by PharmMapper (http://www.lilab-ecust.cn/pharmmapper/) and SwissTargetPrediction (http://www.swisstargetprediction.ch/) databases. Then, the targets of liver cancer were obtained from GeneCards (https://www.genecards.org/), OMIM (https://omim.org/), and Therapeutic Target Database (TTD, http://db.idrblab.net/ttd/) databases. Finally, a Venn diagram of DHA and liver cancer targets was constructed by using Venny 2.1.0 (https://bioinfogp.cnb.csic.es/tools/venny/index.html).
GO and KEGG Analyses
The functions and pathways analysis of intersection targets were evaluated by the Gene Ontology (GO) and Kyoto Encyclopedia of Genes and Genomes (KEGG). GO and KEGG analyses were performed by the Database for Annotation, Visualization, and Integrated Discovery (DAVID, https://david.ncifcrf.gov/).
Analysis of Correlations Using GEPIA and TIMER Databases
GEPIA (http://gepia.cancer-pku.cn/) and TIMER (https://cistrome.shinyapps.io/timer/) databases were newly developed tools. They were used to analyze the correlation between YAP1 and ERK, ERK-5, JNK, p38; PD-1 and ERK, ERK-5, JNK, p38, YAP1; PD-L1 and ERK, ERK-5, JNK, p38, YAP1; and PD-1 and PD-L1.
PPI Network
The protein-protein interaction (PPI) network of intersection targets of YAP1 and MAPK signaling pathway was constructed by STRING database (https://cn.string-db.org/).
Molecular Docking
The structure of DHA was downloaded from the PubChem (https://pubchem.ncbi.nlm.nih.gov/) database, and the structures of MAPK1 (ERK), MAPK7 (ERK5), and MAPK8 (JNK) were downloaded from the PDB (https://www.rcsb.org/) database. These four molecules were imported by AutoDockTools for hydrogenation, dehydration, and other pretreatment. Then, the binding activity of the receptor and ligand was analyzed by molecular docking. Finally, the PyMOL software was used to visualize the docking results.
Statistical Analysis
All statistical tests were performed by SPSS23.0 statistics software (SPSS, Chicago, IL, USA). All experiments were repeated at least three times, with at least three replicates per sample. Data were presented as means ± SD. When more than two groups were enrolled, one-way ANOVA was used, and then a pair-wise comparison test was used for the pairwise comparison. The difference with P < 0.05 was considered statistically significant.
Results
YAP1 is Related to the MAPK Signaling Pathway
MAPK signaling pathway promoted the proliferation, invasion, and metastasis of liver cancer cells. 16 Survival analysis showed that the high expression of ERK and ERK5 showed poor OS time. However, high expression of JNK and p38 had little effect on OS (Fig. 1A). It has been reported that the MAPK signaling pathway was important, mediating YAP1 activation in liver cancer. 17 Therefore, the PPI network of YAP1 and MAPK signaling pathways was constructed, including 82 nodes and 1010 edges. In this PPI network, we found that YAP1 was associated with a variety of molecules, including transforming growth factor beta-3 proprotein (TGFB3), dual specificity mitogen-activated protein kinase 1 (MAP2K1), transforming growth factor beta-1 proprotein (TGFB1), cyclic AMP-responsive element-binding protein 1 (CREB1), myc proto-oncogene protein (MYC), GTPase HRas (HRAS), mitogen-activated protein kinase kinase kinase 7 (MAP3K7), TGF-beta receptor type-1 (TGFBR1), transcription factor Jun (JUN), mitogen-activated protein kinase 8 (MAPK8), and mitogen-activated protein kinase 3 (MAPK3) (Fig. 1B). Then, to further verify these genes enrichment pathways, we performed KEGG analysis. The results showed that the MAPK signaling pathway (hsa04010) and PD-L1 expression and PD-1 checkpoint pathway in cancer (hsa05235) and other pathways were included (Fig. 1C). Gene Ontology (GO) analysis is often used for functional enrichment research in the three aspects of biological process (BP), molecular function (MF), and cellular component (CC). In addition, GO analysis was performed. The results indicated that MAPK cascade (GO:0000165), signal transduction (GO:0007165), JNK cascade (GO:0007254), MAP kinase kinase kinase activity (GO:0004709), protein kinase activity (GO:0004672), cytoplasm (GO:0005737), cytosol (GO:0005829), nucleus (GO:0005634), and others were included (Fig. 1D). MAPKs mediated intracellular signaling related to a variety of cellular activities, including cell proliferation, differentiation, survival, death and transformation. Members of the integrated MAPK family in mammalian cells included MAPK1 (ERK), MAPK7 (ERK5), MAPK8 (JNK), and MAPK14 (p38). 18 Then, the correlation between YAP1 and other key molecules in the MAPK signaling pathway was further analyzed by using GEPIA databases. The results showed that YAP1 was positively correlated with ERK, ERK5, JNK, and p38 and especially YAP1 was positively correlated with ERK (Fig. 1E). The relationship between YAP1 and ERK will be further analyzed later. To verify the significant correlation between YAP1 and ERK, HepG2 cells were treated with ERK inhibitor PD98059. The results indicated that PD98059 could inhibit the expression of YAP1(Fig. 1F). These results showed that YAP1 was related to ERK and MAPK signaling pathways. In view of the key role of the MAPK signaling pathway in liver cancer, we selected the ERK signaling pathway for further analysis.

YAP1 is related to the MAPK signaling pathway. (A) Prognostic values of ERK, ERK5, JNK, and p38 in liver cancer by using the UALCAN database. (B) The PPI network of YAP1 and MAPK signaling pathways was constructed by using the STRING database. (C) YAP1 and MAPK signaling pathway-related genes were analyzed by KEGG. (D) YAP1 and MAPK signaling pathway-related genes were analyzed by GO. (E) Correlation analysis of YAP1, ERK, ERK5, JNK, and p38 by GEPIA database. (F) Western blot results of YAP1 after treatment with PD98059 in HepG2 cells. *P < 0.05.
PD-L1/PD-1 Signal Axis Regulates the Expression of p-ERK/ERK and YAP1 in Liver Cancer
As shown in the above results, the “PD-L1 expression and PD-1 checkpoint pathway in cancer” pathway was also screened. To further study the effects of PD-1 and PD-L1 on ERK, the correlation between PD-1 or PD-L1 and ERK, ERK5, JNK, and p38 was analyzed by using the TIMER database. The results showed that the correlation coefficient between PD-L1 and ERK, ERK5, JNK, p38, and YAP1 was significantly higher than that of PD-1, indicating that PD-L1 might be more correlated with these five genes (Fig. 2A-B). In addition, PD-L1 was positively correlated with ERK, and PD-L1 was positively correlated with YAP1 (Fig. 2A). The relationship between PD-L1 and ERK will be further analyzed in subsequent experiments. Firstly, the expression of PD-L1 in Huh7 and HepG2 cells was detected, and the results showed that the expression of PD-L1 in HepG2 cells was significantly higher than that in Huh7 cells (Fig. 2C). PD-1-Fc bound to PD-L1 on the cell membrane surface. In order to further verify the expression level of PD-L1 in Huh7 cells, we also selected three different concentrations of PD-1-Fc to intervene in Huh7 cells. The results showed that 0.1 μg/ml, 0.5 μg/ml, and 1 μg/ml PD-1-Fc did not affect the expression of p-ERK/ERK and YAP1 (Fig. 2D). Therefore, HepG2 cells were selected to further verify the relationship between PD-L1 and ERK. The results showed that PD-1-Fc promoted the expression of p-ERK/ERK and YAP1, compared with the IgG-Fc group. When PD98059 was applied to block the ERK1/2 signal, the expression of YAP1 and p-ERK/ERK was restored (Fig. 2E). To further clarify the effect of PD-L1 binding to PD-1 on intracellular p-ERK/ERK, the HepG2 cells were treated with nivolumab, and the results showed that nivolumab decreased the expression of PD-L1. The TIMER database also showed that PD-1 and PD-L1 were positively correlated (Fig. 2F-G). Similarly, a study found that anti-PD-1 reduced the expression of PD-L1 in NSCLC tissues. 19 Moreover, PD-L1 expression was mainly induced by IFN-γ released from tumor-infiltrating T cells. 20 HepG2 cells were treated with IFN-γ to overexpress PD-L1. The results showed that IFN-γ indeed promoted the expression of PD-L1 and also increased the expression of p-ERK/ERK, YAP1, and PD-1 (Fig. 2H-1). Furthermore, HepG2 cells were treated with nivolumab, and the result showed that blocking PD-1/PD-L1 reversed IFN-γ-induced overexpression of YAP1 and p-ERK/ERK (Fig. 2J). These results suggested that PD-L1 was positively correlated with ERK and YAP1.

PD-L1/PD-1 signal axis regulates the expression of p-ERK/ERK and YAP1 in liver cancer. (A) Correlation analysis of PD-L1, ERK, ERK5, JNK, p38, and YAP1 by the TIMER database. (B) Correlation analysis of PD-1, ERK, ERK5, JNK, p38, and YAP1 by the TIMER database. (C) Western blot results of PD-L1 in HepG2 and Huh7 cells. (D) Western blot results of YAP1, p-ERK, and ERK after treatment with PD-1-Fc in Huh7 cells. (E) Western blot results of YAP1, p-ERK, and ERK after treatment with PD-1-Fc combined with DMSO and PD-1-Fc combined with PD98059 in HepG2 cells. (F) Correlation analysis of PD-L1 and PD-1 by the TIMER database. (G) Western blot results of PD-L1 after treatment with IgG and nivolumab in HepG2 cells. (H–I) Western blot results of YAP1, p-ERK, ERK, PD-L1, and PD-1 after treatment with BSA and IFN-γ in HepG2 cells. (J) Western blot results of YAP1, p-ERK, and ERK after treatment with IFN-γ combined with IgG and IFN-γ combined with nivolumab in HepG2 cells. NV, nivolumab. *P < 0.05.
Dihydroartemisinin Inhibits p-ERK and YAP1 Expression in HepG2 Cells
Our previous study found that DHA inhibited the growth of liver carcinoma in mice by inhibiting the expression of YAP1. 21 Whether DHA also has a regulatory effect on ERK will be further investigated. To explore the effect of DHA on the MAPK pathway in liver cancer, some public databases were used to identify intersection targets for DHA and liver cancer through network pharmacology. The results showed that about 100 targets and 294 targets of DHA were obtained from the SwissTargetPrediction and PharmMapper databases, respectively. After removing duplicates, 373 targets of DHA were obtained. At the same time, a total of 9191 targets of liver cancer were obtained from GeneCards, OMIM, and TTD databases, respectively. Then, the intersection targets of DHA and liver cancer were determined by Venn analysis (Fig. 3A). To further analyze the biological function of intersection targets, GO and KEGG analyses were performed. The KEGG results showed that these intersection genes were enriched in the MAPK signaling pathway (hsa04010), Ras signaling pathway (hsa04014), PI3K-Akt signaling pathway (hsa04151), Rap1 signaling pathway (hsa04015), FoxO signaling pathway (hsa04068), and other pathways (Fig. 3B). These results indicated that DHA also played a regulatory role in MAPK signaling pathway.
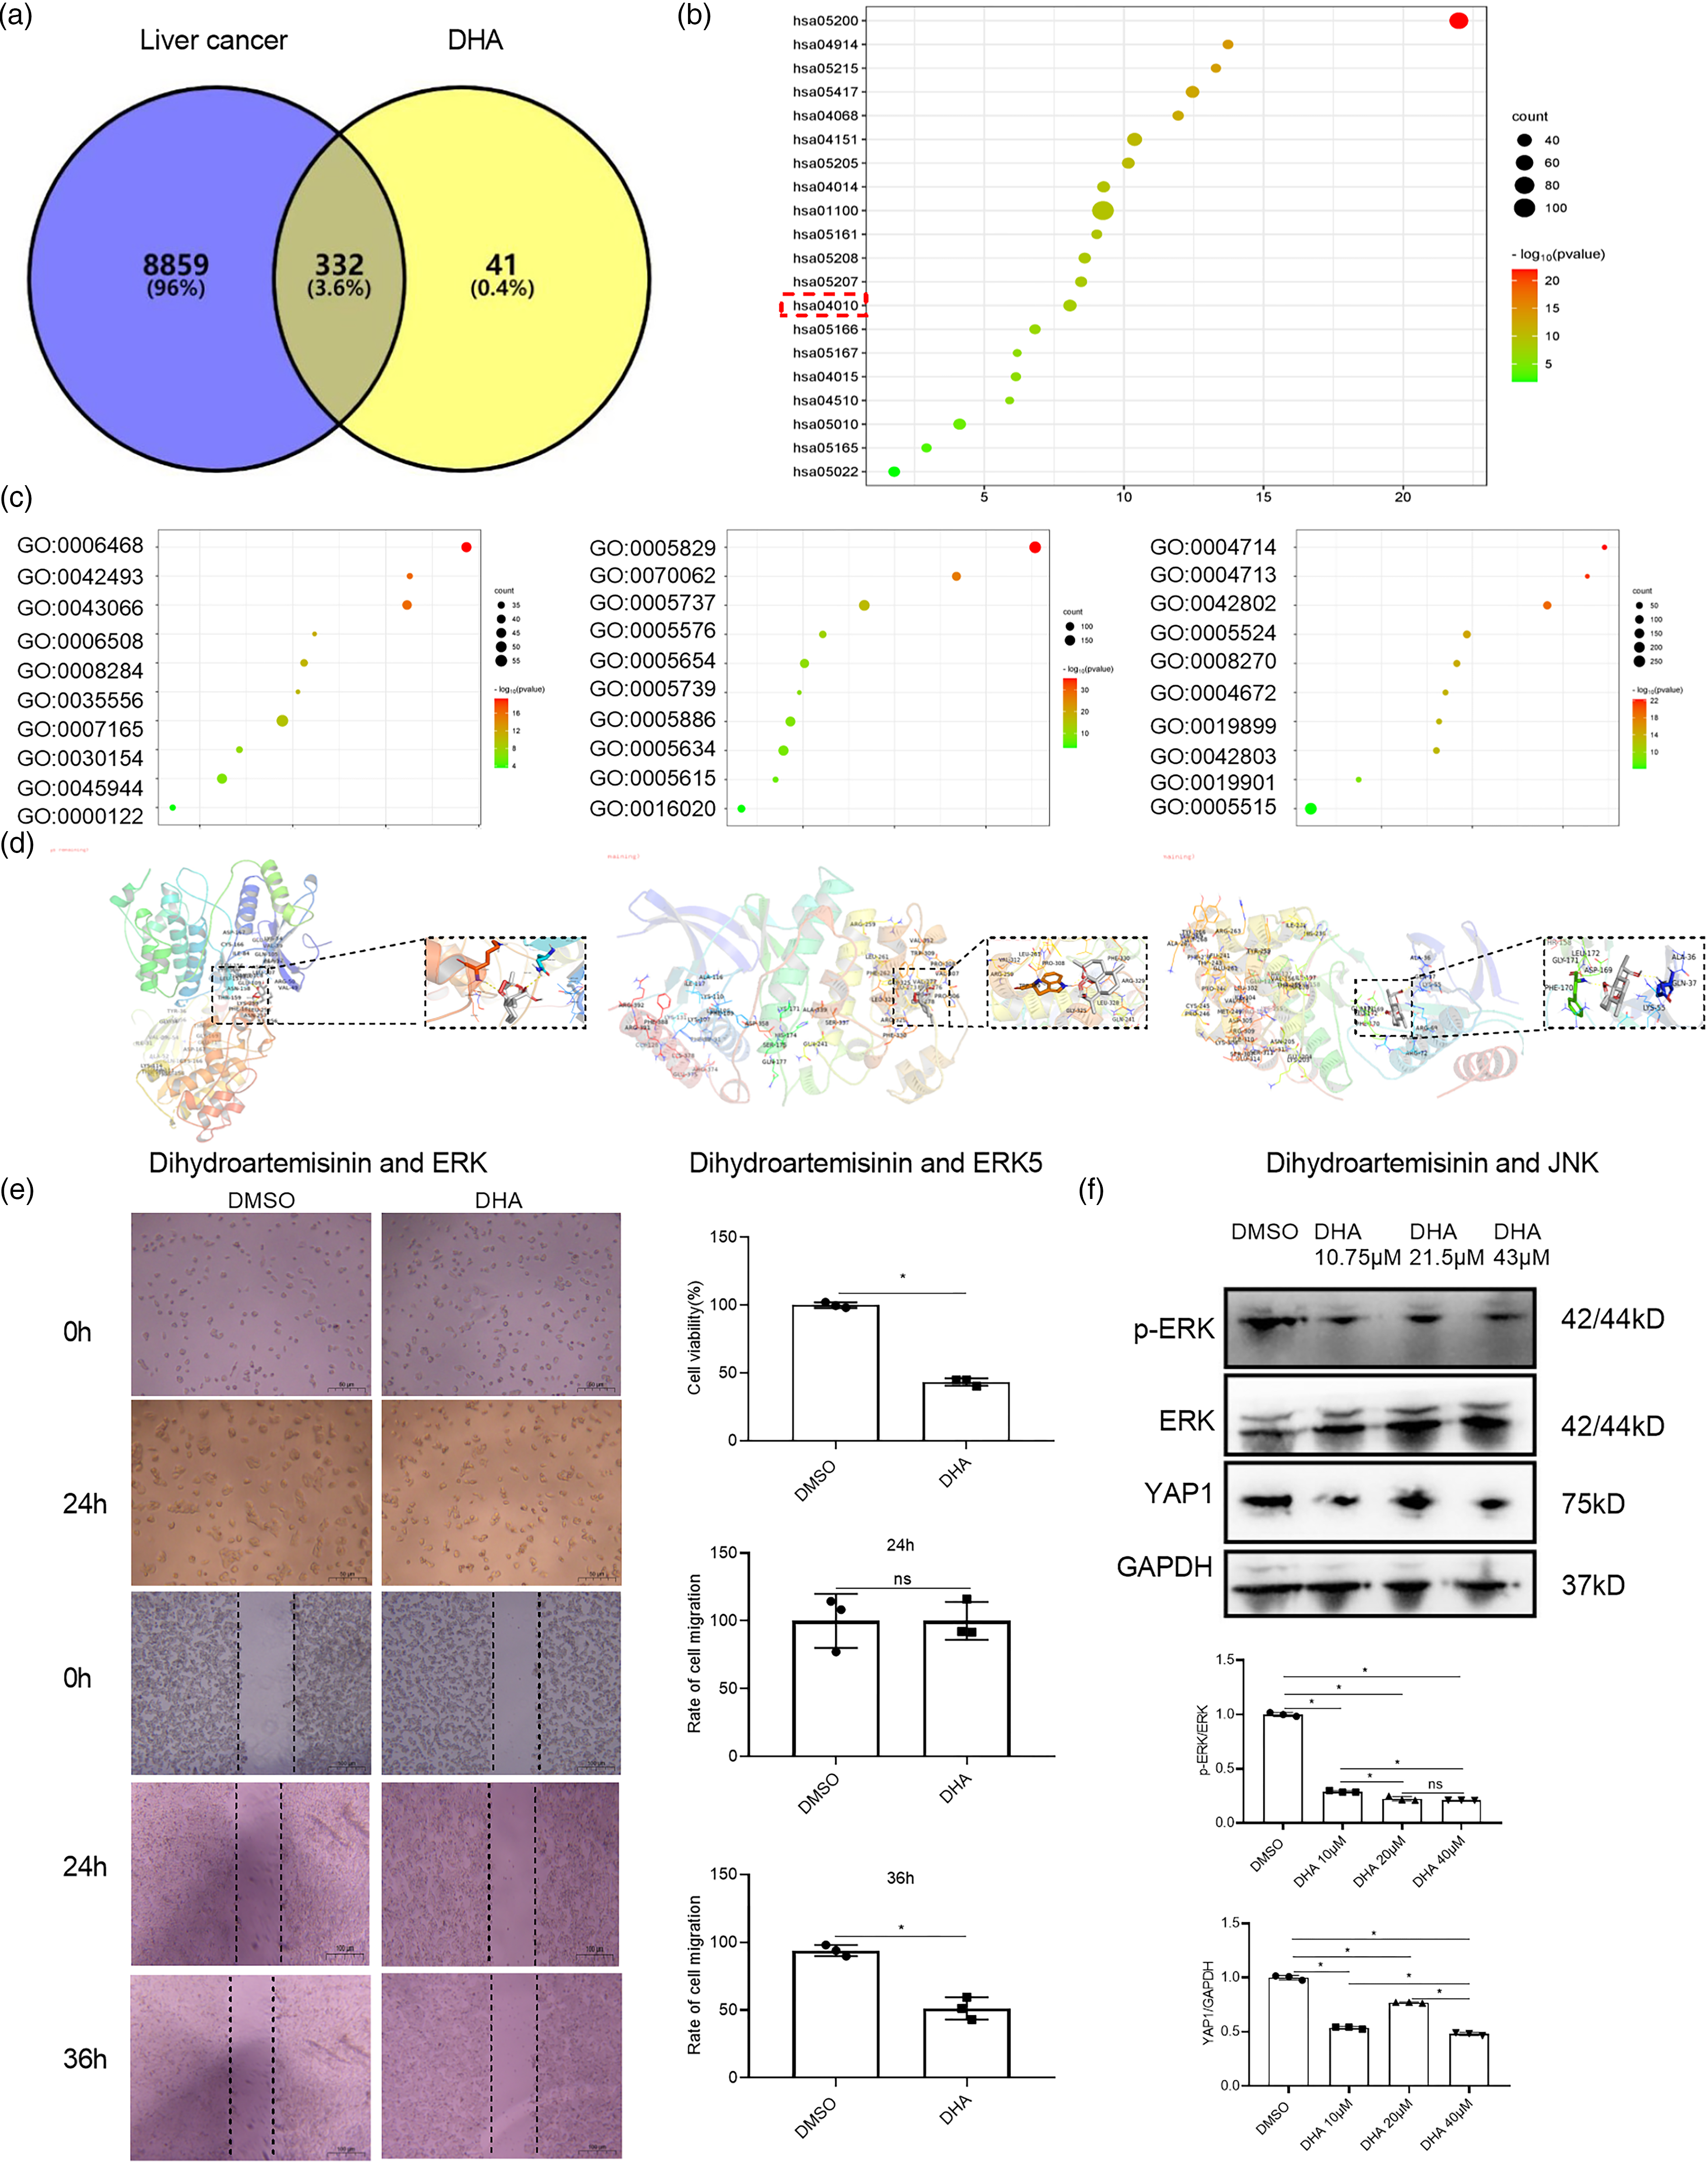
Dihydroartemisinin inhibits p-ERK and YAP1 expression in HepG2 cells. (A) Venn diagram of intersection targets of DHA and liver cancer. (B) Intersection targets of enriched KEGG pathways. (C) Intersection targets of enriched GO analysis. (D) Molecular docking diagram of dihydroartemisinin with ERK, ERK5, and JNK. (E) CCK8 was used to test the inhibitory effect of DHA on HepG2 cell proliferation. Wound-healing assays demonstrated cell movement capacity in HepG2 cells. (F) Western blot results of YAP1, p-ERK, and ERK after treatment with different concentrations (10.75, 21.5, 43 μM) of DHA in HepG2 cells. *P < 0.05.
The GO results showed that signal transduction (GO:0007165), intracellular signal transduction (GO:0035556), cytosol (GO:0005829), cytoplasm (GO:0005737), protein kinase activity (GO:0004672), protein kinase binding (GO:0019901), and others were included (Fig. 3C).
To further verify the influence of DHA on the MAPK signal pathway, the molecular docking of DHA with ERK, ERK5, JNK, and p38 was performed. However, DHA did not form a hydrogen bond with p38, so it was not shown in Fig. 3D. The docking energies of DHA with the other three molecules were −8.1 kcal/mol, −7.0 kcal/mol, and −7.3 kcal/mol. The result showed that DHA was strongly bound to ERK and DHA formed two hydrogen bonds with ERK at LYS-259 and ASN-158 amino acid residues (Fig. 3D). Then, HepG2 cells were treated with DHA for 24 h and 36 h, and the proliferation and cell migration rate of HepG2 cells was detected by CCK8 and wound healing, respectively. The results showed that DHA inhibited the proliferation of HepG2 cells at 24 h. The results showed that DHA inhibited the proliferation of HepG2 cells at 24 h and migration at 36 h, and DHA had no significant effect on cell migration at 24 h (Fig. 3E). Further protein detection was performed, and the result showed that the expressions of p-ERK/ERK and YAP1 were reduced by different concentrations of DHA at 10.75, 21.5, and 43 μM (Fig. 3F).
The Expressions of YAP1 and p-ERK/ERK Were Inhibited by Dihydroartemisinin Combined with Cisplatin
Subsequently, HepG2 cells were treated with PD-1-Fc combined with DHA, and the results showed that DHA reversed the increase of p-ERK/ERK induced by PD-1-Fc (Fig. 4A). Cell proliferation was detected by CCK8, and DDP was used as positive control drug. The results showed that DDP, DHA, and DDP combined with DHA inhibited the proliferation of HepG2 cells (Fig. 4B). Our previous study found that DDP promoted the expression of PD-L1 and YAP1 in the tumor microenvironment. 22 Similarly, a study also found that DDP promoted the expression of PD-L1 and p-ERK in liver cancer cells SUN-368 and SUN-739, which affected the tumor inhibitory effect of DDP. 23 In this study, we also found that DDP promoted the expression of PD-1 in HepG2 cells (Fig. 4C) and further studied the effect of DHA combined with DDP. The results showed that DDP also promoted the expression levels of p-ERK/ERK and YAP1, while DHA combined with DDP reduced the expression of p-ERK/ERK and YAP1 (Fig. 4D). These results indicated that DHA combined with DDP significantly decreased the expression of p-ERK/ERK and YAP1.

The expressions of YAP1 and p-ERK were inhibited by dihydroartemisinin combined with cisplatin. (A) Western blot results of p-ERK and ERK after treatment with PD-1-Fc combined with DMSO and PD-1-Fc combined with DHA in HepG2 cells. (B) CCK8 was used to test the inhibitory effect of DDP, DHA, and DDP combined with DHA on HepG2 cell proliferation. (C) Western blot results of PD-1 after treatment with DMSO and DDP in HepG2 cells. (D) Western blot results of YAP1, p-ERK, and ERK after treatment with DDP, DHA, and DDP combined with DHA in HepG2 cells. (E) The mechanism model of DHA decreasing p-ERK/ERK and YAP1 in HepG2 cells was drawn by using Home for Researchers. YAP1 was positively correlated with ERK, and inhibition of ERK reduced the expression of YAP1. PD-L1 is positively correlated with ERK. The combination of PD-1 and PD-L1 promoted the expression of p-ERK/ERK and YAP1. In this study, we found that DHA significantly reduced the expression of p-ERK/ERK and YAP1 in HepG2 cells. DHA combined with DDP significantly decreased the expression of p-ERK/ERK and YAP1 in liver cancer.
Discussion
YAP1 was positively correlated with ERK, and inhibition of ERK reduced YAP1 expression. PD-L1 is positively correlated with ERK. The combination of PD-1 and PD-L1 promoted the expression of p-ERK/ERK and YAP1. In this study, we found that DHA significantly reduced the expression of p-ERK/ERK and YAP1 in HepG2 cells. DHA combined with DDP significantly decreased the expression of p-ERK/ERK and YAP1 in liver cancer (Fig. 4E).
YAP1 was a key effector molecule downstream of the Hippo signal pathway, and the activation of YAP1 was an early event of liver cancer. 4 In addition, the target genes of the Hippo signaling pathway were required for ectopic overgrowth, but not for normal growth. 24 As a transcriptional coactivator, YAP1 was regulated by other pathways besides the Hippo pathway. Studies found that ERK, JNK, and P38 in the MAPK signaling pathway also regulated Yodal-induced YAP activation, inhibiting the growth of liver cancer. 25 In this study, we found that ERK was positively correlated with YAP1, and inhibition of ERK also inhibited the expression of YAP1. Similarly, studies also found that PD98059 reduced YAP1 expression and promoted mitochondrial fragmentation by reducing p-ERK in glioblastoma. 26
In previous studies, studies on PD-L1 and PD-1 mainly focus on the effect of tumor cells on immune cells, while the PD-1 molecule focuses more on its effect on immune cells. However, recent studies found that PD-1 was also expressed in melanoma, nonsmall cell lung cancer cells, and liver cancer cells. 27 In melanoma cells, PD-1 bound to the ligand PD-L1 expressed by tumor cells to regulate downstream mammalian targets of rapamycin signaling and promoted the growth of tumor cells independent of adaptive immunity. 28 In addition to melanoma cells, it found that in liver cancer cells, the blocking of PD-1 and PD-L1 inhibits tumor growth both in vivo and in vitro, even in the absence of an immune environment. 7 Further, we considered the mechanism of inhibiting tumor growth by blocking the binding of PD-1 and PD-L1. Some studies focused on the effect of PD-1 on internal signals on the surface of liver cancer cells. The cytoplasmic domain of PD-1 bound the downstream effector molecule eukaryotic initiation factor 4E (elF4E) and ribosomal protein S6 (S6) of mTOR and promoted the phosphorylation of these molecules, promoting the proliferation of tumor cells. 7 In our study, we focused on the effect of PD-L1 on the internal signaling of liver cancer cells. Studies suggested that PD-L1 had a unique intratumoral role in regulating epithelial-mesenchymal transition (EMT), metastasis, and chemotherapy resistance. 8 In this study, the recombinant Human PD-1-Fc (binding to human PD-L1) promoted p-ERK/ERK and YAP1 expression, and we also found that the transmission of PD-1/PD-L1 signal was inhibited by the application of ERK inhibitor PD98059. In addition, we found that nivolumab alone reduced the expression of PD-L1 in HepG2 cells. In our previous study, it was found that anti-PD-1 monoclonal antibodies also reduced the expression of PD-L1 in mice with primary liver cancer. 29 Therefore, in this study, IFN-γ was used to increase PD-L1 expression. IFN-γ combined with anti-PD-1 was to observe the effect on the signals in the tumor. Nivolumab reversed IFN-γ-induced the increase of p-ERK and YAP1. Therefore, the combination of PD-1 and PD-L1 promoted the expression of p-ERK/ERK in liver cancer cells. Similarly, studies suggested that in breast cancer cells, the interaction between PD-L1 and PD-1 induced the phosphorylation of AKT and ERK, activating MAPK/ERK and PI3 K/AKT pathways and promoting the expression of multidrug resistance genes in tumor cells. 14 On the contrary, it found that blocking PD-1/PD-L1 in lung cancer promoted the increase of p-AKT and p-ERK, promoting the proliferation of lung cancer cells. 30 PD-1/PD-L1 axis promoted cancer immune escape and affected cancer therapy. 31 Moreover, PD-L1 was resistant to EGFR mutation-independent tyrosine kinase inhibitors by upregulating YAP1 expression in nonsmall cell lung cancer. 32 In addition, studies showed that IFN-γ induced PD-L1 expression by upregulating IRF-1 expression in mouse and human liver cancer cells. 33 A study also indicated that IFN-γ promoted abnormally high expression of PD-1 in tumor regenerative cells through a transcellular kynurenine (Kyn)-aryl hydrocarbon receptor (AhR) pathway. 34 Similarly, our study found that IFN-γ promoted the expression of PD-L1, PD-1, p-ERK/ERK, and YAP1 in HepG2 cells. Studies indicated that IFN-γ significantly increased the expression levels of p-ERK in Glioblastoma. 35 After anti-PD-1 treatment, IFN-γ also promoted YAP aggregation in tumor cells. 36
DHA is a small molecule drug that we have been studying in the early stages. DHA had an inhibitory effect on liver cancer, 37 laryngeal cancer 38 and cervical cancer. 39 In order to further clarify the mechanism of DHA inhibiting liver cancer, through network pharmacology and bioinformatics studies, we found that DHA inhibited the proliferation of liver cancer cells by regulating the MAPK signaling pathway and affecting the phosphorylation of the protein. Studies on MAPK signaling pathways were mainly focused on JNK, ERK5, and ERK. In our study, molecular docking showed that DHA had a stronger effect on ERK. Further experimental verification found that DHA significantly reduced p-ERK expression, inhibiting the proliferation and migration of HepG2 cells. Similarly, studies indicated that DHA inhibited the invasion and migration of 7402 and MHCC97H cells by inhibiting the expression of p-ERK and p-AKT in HCC. 40 Studies also showed that DHA promoted the apoptosis of liver cancer cells by reducing the expression of p-ERK and YAP1. 12 In our previous study, we found that DHA decreased the expression of YAP1 in liver cancer cells. 29 We also found that DHA reduced the expression of YAP1 and decreased lipid droplets, enhancing immunotherapy. 41 In addition, our previous study found that DDP promoted the expression of YAP1 and PD-L1 in liver tumor-bearing mice, which may be the mechanism of DDP resistance. 21 Therefore, YAP1 was a potential therapeutic target for liver cancer. Similarly, in this study, we also found that DDP increased the expression of PD-1, YAP1, and p-ERK/ERK in HepG2 cells, leading to chemotherapy resistance. DDP stimulated ERK1/2 phosphorylation42,43 and inhibited ERK1/2 to enhance DDP sensitivity. 44 Overexpression of YAP1 was resistant to a variety of cytotoxic drug effects. For example, YAP1 expression was upregulated in drug-resistant colon cancer and esophageal cancer.45,46 In this study, we found that DHA inhibited HepG2 cell proliferation by reversing DDP-induced elevation of p-ERK/ERK and YAP1. Similarly, a study suggested that DHA and DDP had synergistic effects in promoting apoptosis and inhibiting EMT in liver cancer. 47 In addition, DHA reversed the multidrug resistance in oral squamous cells by promoting ROS production and inhibiting p-ERK, p-JNK, and p-38 pathways. 48
This study focuses on the interaction between tumor cells. Tumor cells promoted p-ERK and YAP1 signaling through PD-1/PD-L1 interaction on the cell surface. Therefore, blocking the binding of PD-1 and PD-L1 and inhibiting the p-ERK/YAP1 pathway could inhibit the proliferation of tumor cells and provide a theoretical basis for further clinical drug application.
Footnotes
Availability of Data and Materials
The datasets used and/or analyzed during the current study are available from the corresponding author upon reasonable request.
Abbreviations
Acknowledgments
The present study was financially supported by the National Natural Science Foundation of China (No. 81973840 and No. 81273748); National Science and Technology major projects of the 13th Five-Year Plan (2018ZX10303502); Science and Technology Program of Hebei (223777156D); Hebei Traditional Chinese Medicine Scientific Research Project (2021226); Sichuan Provincial Administration of Traditional Chinese Medicine Major science and and technology projects (2021XYCZ004). The authors acknowledge using Home for Researchers (www.home-for-researchers.com) to create the schemata (![]() ).
).
Author Contribution
Xiaoyu Hu, Huimin Yan, and Shenghao Li designed the research. Shenghao Li, Muwei Dai, Fang Wang, Liyuan Hao, Caixia Feng, Yansheng Jia, Yaoqi Li, and Xichun Kang were responsible for the collection and assembly of data, data analysis, and interpretation. Shenghao Li, Muwei Dai, Fang Wang, Liyuan Hao, Caixia Feng, Yansheng Jia, Yaoqi Li, and Xichun Kang were involved in the writing of the manuscript. All authors read and approved the initial manuscript.
Consent for Publication
Not applicable.
Declaration of Conflicting Interests
The author(s) declared no potential conflicts of interest with respect to the research, authorship, and/or publication of this article.
Ethical Approval
Not applicable.
Funding
The author(s) disclosed receipt of the following financial support for the research, authorship, and/or publication of this article: The present study was financially supported by the Science and Technology Program of Hebei (223777156D); National Natural Science Foundation of China (No. 81973840 and No. 81273748); National science and Technology major projects of the 13th Five-Year Plan (2018ZX10303502); Hebei Traditional Chinese Medicine Scientific Research Project (2021226); Sichuan Provincial Administration of Traditional Chinese Medicine Major science and technology projects (2021XYCZ004).
Statement of Human and Animal Rights
Not applicable.
Statement of Informed Consent
Not applicable.