
Abstract
Objective
Although the discrimination of crude drugs by metabolomics analysis using liquid chromatography–mass spectrometry (LC–MS) has been widely reported, there are few reports on natural products analysis using supercritical fluid chromatography (SFC)–MS. This study aimed to compare the results of metabolomic analysis of licorice obtained using SFC–MS and LC–MS.
Methods
We analyzed 14 CHCl3 extracts of licorice roots (Glycyrrhiza glabra, G. uralensis, and G. inflata) using SFC-time-of-flight (TOF)/MS and LC-TOF/MS in conjunction with principal component analysis (PCA). The three species were assessed for discrimination based on the PCA results. The characteristic constituents of each variety were purified, and their chemical structures were elucidated using various spectroscopic analyses.
Results
The PCA score plots of the results of both SFC and LC classified the licorice samples into three groups. Seven compounds (six known compounds and one new phenolic compound, glyglabone) were isolated from G. glabra, five known compounds were isolated from G. uralensis, and four known compounds were isolated from G. inflata.
Conclusions
The 16 isolated compounds may be characteristic compounds in the three licorice species. The SFC and LC methods showed comparable results in distinguishing the three species. SFC was highly effective for directly analyzing CHCl3 extracts, reducing analysis time and organic solvent consumption by over 50% compared to the LC analysis. Thus, SFC-TOF/MS in combination with PCA can be used to differentiate between G. glabra, G. uralensis, and G. inflata.
Introduction
Licorice is one of the most commonly used crude drugs in Japan. In China, the roots and stolons of Glycyrrhiza glabra, G. uralensis, and G. inflata are used as crude drugs. 1 G. glabra and G. uralensis are listed in the Japanese Pharmacopoeia, and G. inflata is used as a food additive (as a sweetener and antioxidant agent) in Japan.1,2 Glycyrrhizin, an oleanane-type saponin, is used as a sweetener that is approximately 170 times sweeter than sucrose. 3 It is also used as a pharmaceutical and cosmetic ingredient for its anti-inflammatory, anti-bacterial, and hepatoprotective activities.4,5 Additionally, licorice oil extracts containing flavonoids and phenolic compounds are used as antioxidants. 2 Glabridin, glycicumarin, and licochalcone A are characteristic constituents of G. glabra, G. uralensis, and G. inflata, respectively.2,6 Several other phenolic compounds with isoprenoid substituents, such as the 3-methyl-2-butenyl (prenyl) group, have been isolated from the licorice species, 7 which may aid species identification.
In recent years, several studies have utilized nuclear magnetic resonance (NMR), gas chromatography–mass spectrometry (GC–MS), and liquid chromatography–mass spectrometry (LC–MS) for metabolomic analysis of licorice.8–10 Sample preparation for NMR is relatively simple; however, in crude samples, it may be difficult to identify compounds from a characteristic 1H-NMR spectrum. 11 GC–MS is used for the analysis of compounds with low polarity 12 ; however, derivatization is required for non-volatile constituents, which makes comprehensive analysis of plant metabolites difficult. Reversed-phase (RP) LC–MS is often used to examine plant extracts but is unsuitable for analyzing compounds with low polarity. 13 Furthermore, normal-phase LC is limited by the availability of mobile phase solvents for MS analysis, and its retention time repeatability is often less feasible than that of RP-LC. 14
Supercritical fluid chromatography (SFC) can aid the analysis of compounds with low polarity, as it has a shorter acquisition time than LC.15–17 Supercritical carbon dioxide (scCO2), generally used as a mobile phase in SFC systems, is non-toxic, non-reactive, non-flammable, inexpensive, and environment friendly.13,18 The polarity of scCO2 is similar to that of hexane. Adding modifiers such as MeOH, MeCN, and acids enables analysis across a wide range of polarities. Therefore, several applications of scCO2 to plant extracts, one of the multi-constituent substances, have been reported.16,17,19 However, unlike studies using GC–MS or LC–MS, there are few reports on the use of SFC-TOF/MS for metabolomic assays of natural products. The SFC analysis of an aqueous–ethanol extract of licorice was reported by Li et al. 20 Although EtOH can be used to extract flavonoids, highly polar compounds such as sugars are also co-extracted, which leads to concerns regarding the robustness of SFC analysis. As aqueous solvents cannot be used for SFC analysis, water must be evaporated first and then the residue must be redissolved in an organic solvent. In contrast, CHCl3 can be used to extract phenolic compounds, specifically from licorice and then the extract can be analyzed directly using SFC.
In this study, 14 CHCl3 extracts of the roots of G. glabra, G. uralensis, and G. inflata were assessed using SFC-TOF/MS and LC-TOF/MS to validate the advantages of SFC. In addition, principal component analysis (PCA) based on MS data was utilized to differentiate between the three licorice species and to investigate the characteristic compounds in each variety. To the best of our knowledge, this is the first study on metabolomic analysis of licorice extract using SFC-TOF/MS.
Results and Discussion
The root extracts of G. glabra (five batches), G. uralensis (five batches), and G. inflata (four batches) were prepared using CHCl3. Each extract was diluted with CHCl3 and filtered through a 0.2-µm membrane before injecting it directly into the SFC-TOF/MS. The analysis was conducted in negative ion mode, and the analytical results are illustrated in the base peak ion (BPI) chromatogram (Figure 1). The BPI chromatogram plots the maximum intensity peak against the time axis for all the acquired mass spectra. The SFC-TOF/MS was completed within 7 min, during which several major peaks, including peaks for glabridin, glycycoumarin, and licochalcone A, were detected.

Base peak ion (BPI) chromatogram obtained for SFC-TOF/MS analysis of extracts from Glycyrrhiza glabra (A), G. uralensis (B), and G. inflata (C).
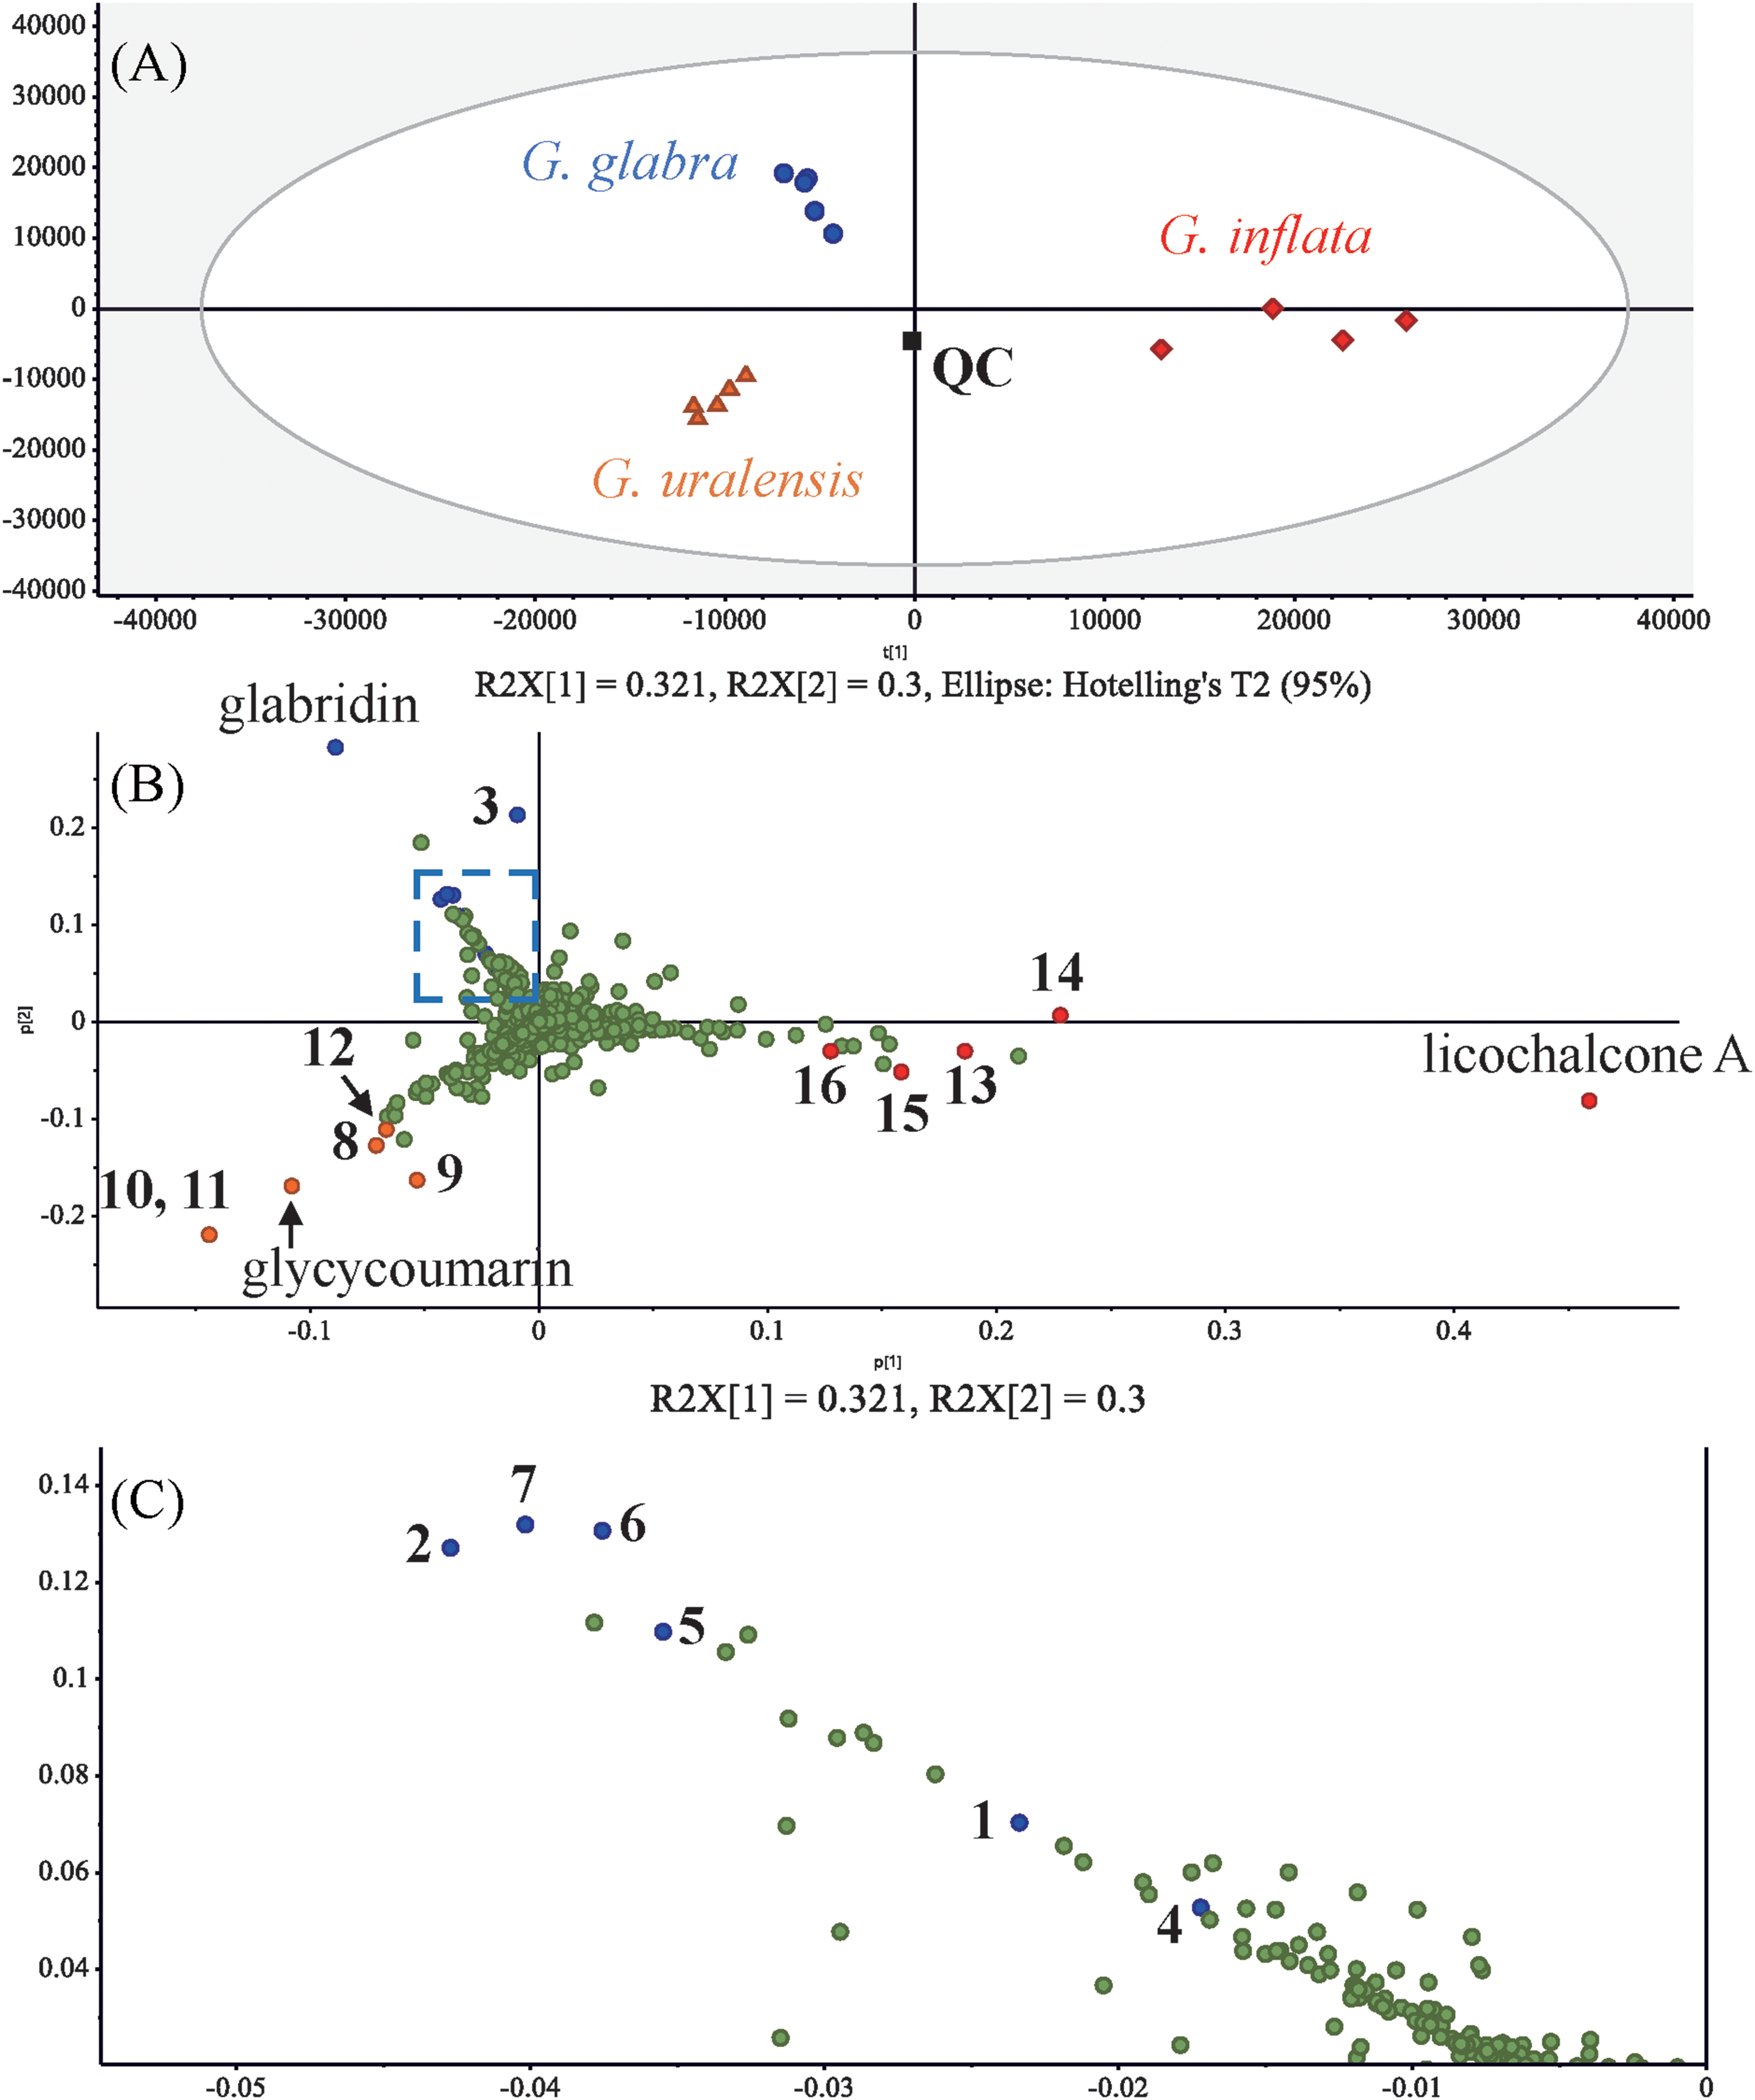
PCA was used to evaluate the SFC-TOF/MS data. The PCA score plot enables visual discrimination based on the component profiles detected using MS analysis. The ellipse was set to represent the 95% confidence interval of the data. The PCA score plots depicted that the samples were divided into three groups (G. glabra, G. uralensis, and G. inflata), based on the first and second principal components, which accounted for 67.0% of the total variance. The retention time and m/z of the detected peaks were further examined using PCA loading plots. The PCA loading plot facilitated the profiling of markedly components that contributed to the distinction on the score plots, revealing that several compounds, including glabridin, glycycoumarin, and licochalcone A, are key variables for discrimination. In addition, the compounds (

Principal component analysis (PCA) score plot (A) and loading plot (B).
Sixteen compounds were purified using open-column chromatography and preparative HPLC based on PCA loading plots, which served as indicators of the characteristic compounds. Additionally, the retention time and molecular weight of these isolated compounds were compared with those isolated using the SFC-TOF/MS analysis of the extract. The structures of

Chemical structures of compounds

1H–1H COSY, HMBC, and NOESY correlations of compound
1H-NMR Data of Glyglabone (

s: singlet, d: doublet, dd: double doublet, br s: broad singlet.
13C-NMR Data of Glyglabone (

Phenolic Compounds Isolated from G. glabra, G. uralensis, and G. inflata.

For comparison with the SFC-TOF/MS results, the CHCl3 extract was concentrated, redissolved in EtOH, filtered through a 0.2-µm membrane, and analyzed using LC-TOF/MS. In the LC method, longer columns than those used for SFC were employed to achieve better separation. BPI chromatogram data under negative ion mode are shown in Figure 5. The PCA score plots using LC-TOF/MS showed that the samples were classified into three groups, similar to the SFC results. The first and second principal components accounted for 62.1% of the total variance. In addition, compounds (

Base peak ion (BPI) chromatogram obtained for LC-TOF/MS analysis of the extracts from G. glabra (A), G. uralensis (B), and G. inflata (C).
Principal component analysis (PCA) score plot (A), loading plot (B), and boxed portion of the loading plot on a larger scale (C).
Conclusions
This study, to our knowledge, is the first to utilize SFC-TOF/MS coupled with PCA to distinguish between G. glabra, G. uralensis, and G. inflata. All 16 identified compounds, including the new compound, glyglabone (
Experimental
Plant Materials
The roots of G. glabra (five batches), G. uralensis (five batches), and G. inflata (four batches) were used in this study. Each species was provided and identified by Prof. Ying Wang of the South China Botanical Garden.
General
The following instruments were used to obtain physical data: ultra-violet (UV) spectra, Shimadzu UV-1800 UV-Vis spectrometer; IR spectra, JASCO FT/IR-460 spectrometer; NMR spectra, JEOL ECS-400 (400 MHz) spectrometer; preparative HPLC, YMC LC-Forte/R equipped with a YMC-Actus Triart C18 column (250 × 20 mm i.d., YMC Co. Ltd, Kyoto, Japan); recycling preparative HPLC, Japan Analytical Industry LC-908 equipped with two JAIGEL GS-310 columns (500 × 20 mm i.d., Japan Analytical Industry Co. Ltd, Tokyo, Japan). The following materials were used for chromatography: synthetic absorbent resin column chromatography, DIAION HP-20 (Mitsubishi Chemical Co. Ltd, Chiyoda-ku, Tokyo, Japan); normal-phase silica gel column chromatography, Silica gel 60 (Merck, KGaA., Darmstadt, Germany); and reversed-phase silica gel column chromatography, Chromatorex ODS (Fuji Silysia, Ltd, Kasugai, Japan).
Sample Preparation for PCA
The roots of G. glabra, G. uralensis, and G. inflata were extracted using CHCl3 for 1 hour at room temperature. Prior to SFC-TOF/MS analysis, the extracts were diluted tenfold with CHCl3 and filtered through a 0.2-µm membrane. Subsequently, the solvent was removed and redissolved in EtOH (0.5 mg/mL), filtered through a 0.2-µm membrane, and subjected to LC-TOF/MS analysis. The QC sample consisted of equal proportions of each solution, which was used to adjust the retention time of each peak detected in all samples for PCA.
SFC-TOF/MS and LC-TOF/MS Conditions
SFC analysis was performed using the ACQUITY UPC 2 system (Waters Corp.), equipped with a binary solvent pump, sample manager, column manager, convergence manager, and a backpressure regulator, connected to a TOF/MS (Xevo G2 Tof, Waters Corp., Milford, MA, USA). SFC analysis was conducted on an ACQUITY Torus DIOL column (100 × 2.1 mm i.d., 1.7 μm; Waters Corp.) at a flow rate of 1.0 mL/min at 40 °C using a mobile phase of scCO2 (purity ≥99.99%, A) and MeOH (B) (containing 0.1%, v/v formic acid). The gradients of A and B were as follows: 0–20% B at 0–6 min, 20% B at 6–8 min, 20–0% B at 8–8.1 min, and 0% at 8.1–10 min. The makeup liquid consisted of MeOH containing 0.1% formic acid. The flow rate and the back pressure were maintained at 0.2 mL/min and 2000 psi, respectively. The injection volume for each sample was 2.0 μL.
The ACQUITY UPLC system (Waters Corp.) comprised a binary solvent manager, a sample manager, and a column manager connected to a TOF mass spectrometer. Qualitative analysis was performed on an ACQUITY BEH C18 column (150 × 2.1 mm i.d., 1.7 μm; Waters Corp.) at a flow rate of 0.4 mL/min at 40 °C using a mobile phase of pure water (A) (containing 0.1% formic acid) and MeCN (B) (containing 0.1% formic acid). The gradients of A and B were as follows: 30–90% B at 0–16 min, 90% B at 16–21 min, 90–100% B at 21–22 min, 100% B at 22–27 min, 100–30% B at 27–28 min, and 30% B at 28–30 min. The injection volume for each sample was 2.0 μL. To perform PCA, data were processed using Masslynx 4.1 and Progenesis QI software (Waters Corp.) and exported to the SIMCA software, version 17 (Sartorius Stedim Biotech).
Extraction and Isolation
The dried roots of G. glabra (1.0 kg) were extracted with CHCl3 (2.5 L) under reflux (1 h), and the solvent was removed in vacuo to obtain the CHCl3 extract (14 g). This extract was subjected to DIAION HP-20 column chromatography and eluted with MeOH–H2O (8:2 to 10:0, v/v) and Me2CO. The MeOH eluate (6.0 g) was chromatographed on a silica gel column and eluted with n-hexane–EtOAc (2:1 to 1:1, v/v) to yield fractions G1 to G6. Fraction G2 (1.0 g) was separated using an octadecyl-silica (ODS) column with MeOH–H2O (6:4 to 10:0, v/v) and further purified using recycling preparative HPLC (MeOH) to obtain compound
The dried roots of G. uralensis (840 g) were extracted using CHCl3 (2 L), and the solvent was removed. The CHCl3 extract (32 g) was applied to a DIAION HP-20 column and eluted with MeOH–H2O (5:5 to 10:0, v/v) and Me2CO. The MeOH eluate (6.0 g) was chromatographed on a silica gel column and eluted with n-hexane–EtOAc (2:1 to 1:1, v/v) to obtain fractions U1 to U8. Fraction U1 (3.9 g) was separated on an ODS column with MeOH–H2O (6:4 to 10:0, v/v) and further purified using preparative HPLC [MeCN–H2O (65:35, v/v)] and recycling preparative HPLC (MeOH) to obtain compound
The dried roots of G. inflata (400 g) were extracted with CHCl3 (2 L), and the solvent was removed. The CHCl3 extract (11 g) was fractionated using silica gel column chromatography and eluted with n-hexane–EtOAc (1:1, v/v) to obtain fractions I1 to I5. Fraction I2 (1.6 g) was separated on an ODS column with MeOH–H2O (7:3 to 10:0, v/v) and further purified using preparative HPLC [MeCN–H2O (68:32, v/v)] and recycling preparative HPLC (MeOH) to obtain compound
Glyglabone (
Supplemental Material
sj-docx-1-npx-10.1177_1934578X231205727 - Supplemental material for Differentiating Between Three Licorice Species Using SFC-TOF/MS Analysis With Principal Component Analysis
Supplemental material, sj-docx-1-npx-10.1177_1934578X231205727 for Differentiating Between Three Licorice Species Using SFC-TOF/MS Analysis With Principal Component Analysis by Hideki Saito, Shozo Miyoshi, Toshiyuki Murakami and Ryuichiro Suzuki in Natural Product Communications
Footnotes
Acknowledgments
Declaration of Conflicting Interests
The authors declared the following potential conflicts of interest with respect to the research, authorship, and/or publication of this article: H.S., S.M., and T.M. are employees of Maruzen Pharmaceuticals Co., Ltd., the sponsor of this study. H.S. has a pending patent that belongs to the employer.
Ethical Approval
Our institution does not require ethical approval for reporting individual cases or case series.
Funding
The authors received no financial support for the research, authorship, and/or publication of this article.
Statement of Human and Animal Rights
This article does not contain any studies conducted on human patients or animal models.
Statement of Informed Consent
There are no human patients involved in this article and informed consent is not applicable.
Supplemental Material
Supplemental material for this article is available online.
References
Supplementary Material
Please find the following supplemental material available below.
For Open Access articles published under a Creative Commons License, all supplemental material carries the same license as the article it is associated with.
For non-Open Access articles published, all supplemental material carries a non-exclusive license, and permission requests for re-use of supplemental material or any part of supplemental material shall be sent directly to the copyright owner as specified in the copyright notice associated with the article.