
Abstract
Macrophages are the primary immune cells in the tumor microenvironment, where they exhibit the immunosuppressive M2 phenotype to support tumor development. Reshaping M2 tumor-associated macrophages (TAMs) into the antitumor M1 phenotype is a promising approach in tumor immunotherapy. We had previously demonstrated that a high-purity homogeneous Sambucus adnata wall polysaccharide SPS-1 isolated from S. adnata exerted a good immunoregulatory effect. In the present study, we explored whether SPS-1 can remodel TAMs and inhibit the development of lung cancer. In the tumor mouse model transplanted with Lewis lung cancer, SPS-1 promoted the apoptosis of tumor cells and inhibited angiogenesis in tumor tissues by remodeling M2 macrophages in the tumor microenvironment into M1 macrophages, which exerted effective antitumor effects. Therefore, SPS-1 may be used as a novel immunostimulator in tumor immunotherapy, and our study also provides a novel pathway and material for reshaping immune defense to prevent and treat tumors.
Introduction
Macrophages are immune cells with a wide distribution and play an indispensable role in host defense, homeostasis, and tissue development. 1 Macrophages constitute a homogeneous population, and their phenotype is determined by biological factors in the microenvironment. Based on the phenotype and secreted cytokines, macrophages can be divided into two subtypes, viz., classic M1 and nonclassic M2. 2 M1 subtype macrophages can secrete proinflammatory factors and thereby promote immune response and enhance the tumor-killing effect,3,4 whereas M2 subtype macrophages exert an anti-inflammatory effect and can provide conditions for tumor immune escape.5,6 Tumor-associated macrophages (TAMs) are the primary cells that constitute the immune system of the tumor microenvironment and account for approximately 50% of solid tumors that infiltrate immune cells. 7 Similar to the functions of M2 subtype macrophages, TAMs can promote tumor growth, invasion, and angiogenesis, but their plasticity enables them to transform from M2 into antitumor M1 under specific conditions. 4 The mutual conversion between the two subtypes renders TAMs potential therapeutic targets for tumor treatment.
The immune regulation of polysaccharides is one of its most important biological activities. Several studies have confirmed that polysaccharides can inhibit the occurrence and development of tumors by improving the immune function of the body. For instance, Sun et al found that alginate can significantly inhibit the expression of M2-type chemokine CCL22 through the NF-κB pathway and further inhibit the migration of tumor cells mediated by M2-type macrophages, especially the recruitment of Treg cells, to resist the development of tumors. 8 Another study showed that a polysaccharide extracted from Cordyceps militaris can induce Ca2+ release and activate the Akt, p38, and NF-κB pathways by binding to TLR2, which in turn promotes the reset of TAMs to the antitumor M1 subtype, and reverse the inhibitory effect of M2 macrophages on T lymphocytes. In vivo experiments showed that C. militaris polysaccharide can differentiate TAMs into M1 phenotype, inhibit the expression of PD-L1 in vivo, and resist the development of tumors. 9 Some studies have demonstrated that polysaccharides can play an antitumor role by regulating the phenotype of TAMs.
Furthermore, it has been demonstrated Sambucus adnata polysaccharide SPS-1 binds to TLR2 receptors and activates the immune activity of RAW 264.7 cells through the MAPK and NF-κB signaling pathways, 10 but whether SPS-1 can play an antitumor role by disrupting TAM remodeling remains unclear. Therefore, this study was conducted to examine the antitumor effect of SPS-1 in a mouse model transplanted with Lewis lung cancer and determine whether its antitumor effect is related to the regulation of TAM remodeling.
Results
SPS-1 Inhibited the Growth of Lewis Lung Cancer–transplanted Tumor in Mice
After 18 days of treatment with SPS-1, the transplanted tumors were collected, weighed, and measured. Compared with the control group, the low-, medium-, and high-dose groups exhibited decreased tumor mass and volumes, with an increase in the tumor inhibition rate (Figure 1B–D). The inhibitory effect of SPS-1 on tumor growth was dose-dependent. When the dose reached 100 mg/kg, the inhibitory effect of SPS-1 on tumor growth reached an extremely significant level (P < .0001).

Effects of SPS-1 on tumor growth in Lewis tumor model (n = 6). (A) Pictures of tumor in each group, (B) Tumor volume changes after tumor challenge, (C) Tumor weight of each group, (D) Inhibition rates of each group at the completion of the study, (E) The HE stained histological sections of tumor tissues in each group (×200), (F) Representative photomicrographs of TUNEL fluorescence staining of tumor tissues after various treatments (×200), (G) Quantitative analysis of TUNEL fluorescence staining of tumor tissues. *P < .05, **P < .01, ***P < .001, ****P < .001.
Pathological Examination
To clarify the antitumor effect of SPS-1 treatment in vivo, we analyzed the histopathology of the tumor isolated from mice by HE and TUNEL staining (Figure 1E–G). The results of HE staining revealed that the control group had the largest number of tumor cells, the largest tumor volume, and the fewest necrotic cells, and the cells were spherical and fusiform with large nuclei. The nuclei were complete and clear and dyed blue uniformly, indicating that the tumor cells were in a rapid proliferation state. The tumor tissue in each treatment group exhibited different degrees of necrosis, with the 100-mg/kg group showing the most obvious necrosis, large necrotic area, irregular distribution, chromatin agglutination, weakened cytoplasmic staining signal, pyknosis, and fragmentation, indicating that SPS-1 exerts an obvious inhibitory effect on tumor cells.
After TUNEL staining, the tumor tissues of Lewis tumor–bearing mice were observed and photographed using a light microscope. The apoptotic index of the tumor cells in the tumor tissue of the Lewis tumor–bearing mice of the control group was extremely low (0.03). The proportions of apoptotic cells in the 50- and 100-mg/kg treatment groups were significantly higher than the proportion in the control group (P < .0001), and the apoptotic indices reached 0.06 and 0.13, respectively. SPS-1 treatment exerted a strong effect that killed the Lewis tumor cells.
Effect of SPS-1 on Tumor Apoptosis and Angiogenesis in Lewis Tumor–transplanted Mice
To further confirm the inhibitory effect of SPS-1 on Lewis tumor–transplanted tumors, we conducted immunohistochemistry and analyzed the expression levels of apoptotic and angiogenic proteins related to the occurrence and development of tumors (Figure 2). Compared with the control group, the drug treatment groups showed decreased expression levels of antiapoptotic protein Bcl-2 and increased expression levels of apoptosis-related protein Bax, demonstrating a dose effect. The signal transduction pathway mediated by VEGFA/VEGFR2 is the crucial link for tumor angiogenesis. The expression levels of vascular endothelial growth factor (VEGF) and VEGFR2 proteins in the tumor tissues of the SPS-1 treatment group showed a significant decline compared to those in the control group. These results indicated that SPS-1 inhibited tumor growth in Lewis tumor–transplanted mice and exerted a good effect on apoptosis and angiogenesis.

Effect of SPS-1 on the expression of Bcl-2, Bax, vascular endothelial growth factor (VEGF), and VEGFR2 proteins in the tumor tissue. (A) Representative micrographs of tumor tissues subjected to immunohistochemical staining after different treatments (×400), (B) Quantitative analysis of tumor tissues subjected to immunohistochemical staining. *P < .05, **P < .01, ***P < .001, ****P < .001.
Effect of SPS-1 on the Polarization of TAMs
It has been previously demonstrated that SPS-1 binds to TLR2 receptors and activates the immune activity of RAW 264.7 cells through the MAPK and NF-κB signaling pathways. It is hypothesized that SPS-1 can inhibit tumor development by inducing tumor-related macrophages to change from M2 type to M1 type. To confirm this hypothesis, we analyzed the expression levels of the characteristic markers of TAMs under different polarization states. We performed qPCR to analyze the expression levels of Arg-1, IL-10, IL-4, iNOS, TNF-α, and IL-6 mRNA (Figure 3). The expression levels of iNOS and inflammatory factors TNF-α and IL-6 mRNA significantly increased in the M1 macrophages of the SPS-1 treatment group, whereas the expression levels of Arg-1 and inflammatory factors IL-10 and IL-4 mRNA significantly decreased in the M2 macrophages. We also investigated the expression levels of Arg-1, CD206, iNOS, and CD86 proteins in the tumor tissues using the immunofluorescence double-staining technique (Figure 4). Compared with the control group, the expression levels of membrane surface molecule CD206 of the M2-type macrophages and its marker Arg-1 protein significantly decreased in the SPS-1 treatment group, whereas the expression levels of the membrane surface molecule CD86 and the marker iNOS protein of M1-type macrophages significantly increased. The M1/M2 ratio of TAMs in the tumor tissue significantly increased. These findings indicated that SPS-1 can exert antitumor effects by remodeling TAMs in the tumor microenvironment.

Effect of SPS-1 on the expression of Arg-1, IL-10, IL-4, iNOS, TNF-α, and IL-6 mRNA in the tumor tissue. Relative mRNA levels were determined using the ΔΔCt method using GAPDH for internal cross-normalization. Data are expressed as mean ± standard deviation (n = 3). *P < .05, **P < .01, ***P < .001, ****P < .001.
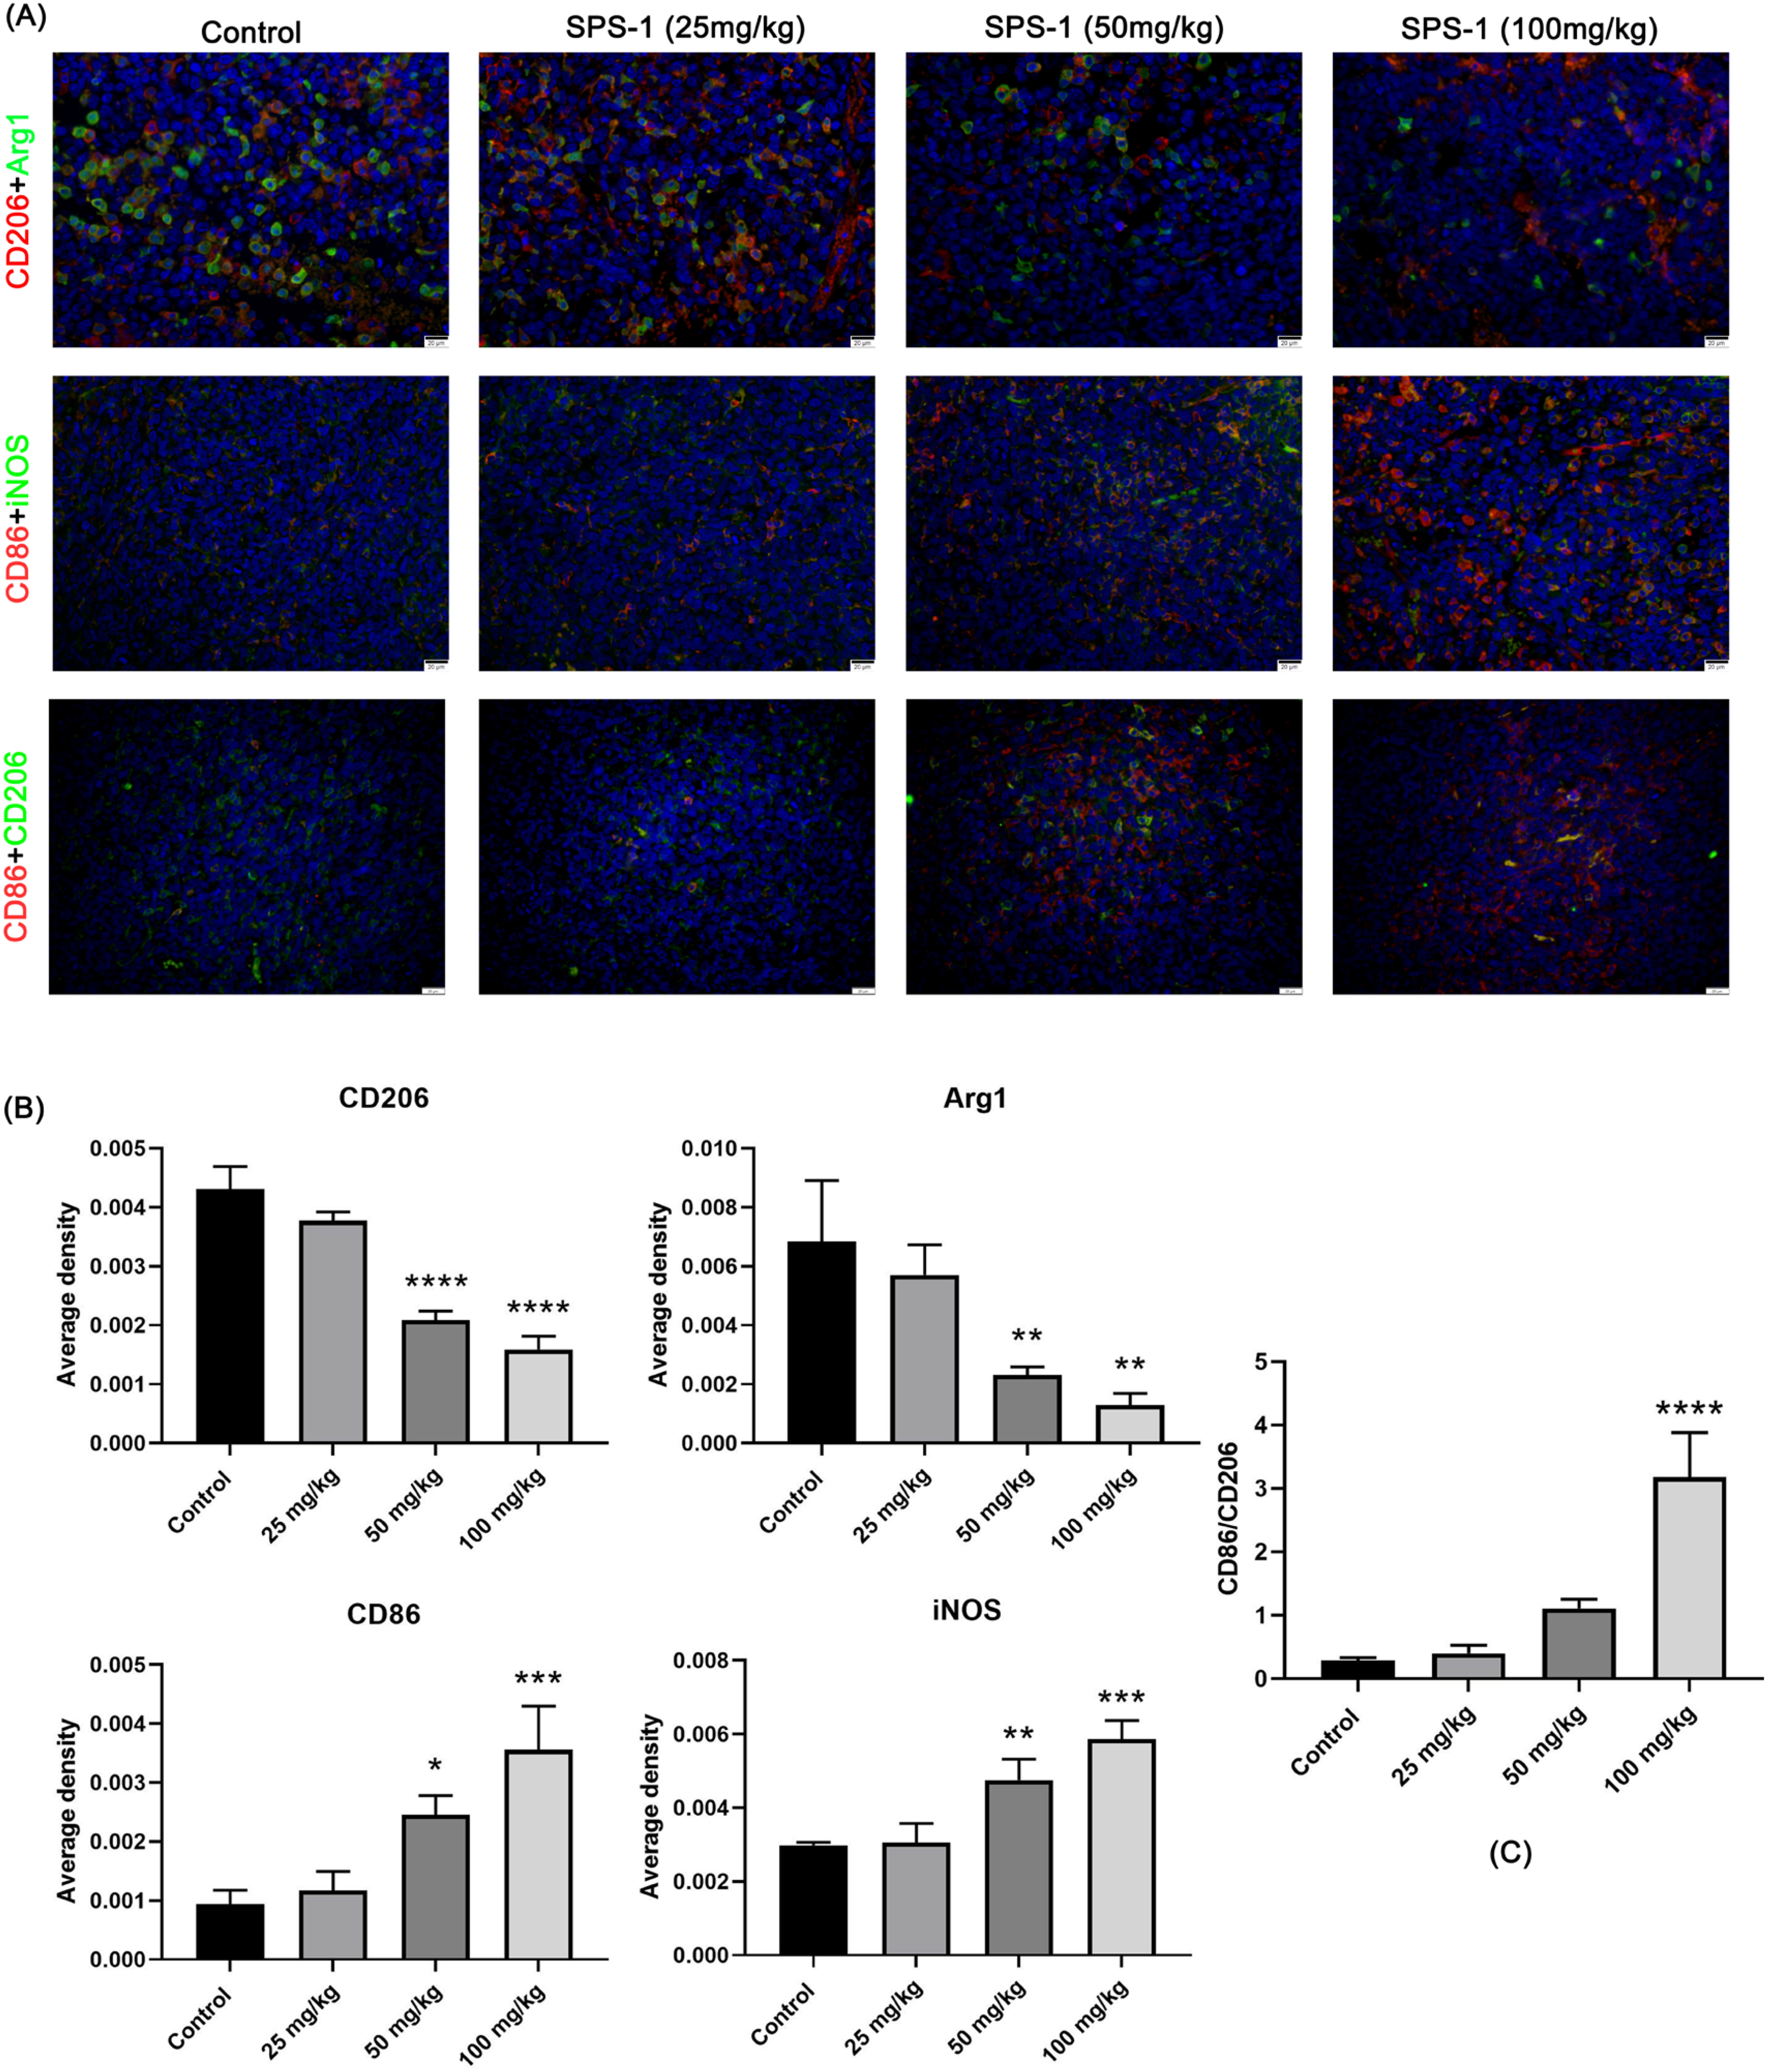
Double immunofluorescence staining of CD206 and Arg-1, CD86, and iNOS in Lewis tumor tissues. (A) Representative photomicrographs of tumor tissues subjected to double immunofluorescence staining after various treatments (×400), (B) Quantitative analysis of tumor tissues subjected to double immunofluorescence staining, (C) Statistical analysis of M2:M1 ratio in macrophages. *P < .05, **P < .01, ***P < .001, ****P < .001.
Conclusions and Discussion
The treatment and prevention of tumors are global concerns. Most medical researchers have been committed to investigating the occurrence, development, prevention, diagnosis, and treatment of tumors. Although several technical methods from medical research have been developed and scientific research results are endless, the tumors remain unconquered.
One of the most important aspects of the antitumor effect of drugs is to promote tumor apoptosis and inhibit angiogenesis. Bcl-2 and Bax are important proteins that regulate cell apoptosis. Bcl-2 is released from the chondriosome after cytochrome C inhibition, prevents the activation of caspase family proteins, and exerts an antiapoptotic effect.11,12 Bax can migrate from the cytoplasm to the chondriosome under the influence of apoptotic factors, combine with the mitochondrial membrane, promote the release of cytochrome C from the chondriosome, activate related proteins, and induce cell apoptosis.13,14 Naumov et al investigated the effect of tumor angiogenesis on tumor growth and found that tumors could not grow in the absence of new blood vessels that provide nutrients and when the tumor diameter was more than 1–2 mm. 15 The VEGF/VEGFR2 signaling pathway is one of the most important pathways in tumor angiogenesis. 16 The combination of VEGF and its receptor VEGFR2 activates the receptor tyrosine kinase domain and upregulates the downstream signaling system, which promotes angiogenesis by enhancing the mitotic and migration ability of endothelial cells and degrades the biological activities of the vascular endothelial extracellular matrix. 17 Considering that SPS-1 can significantly inhibit tumors in mice transplanted with Lewis tumor, we used the immunohistochemical technique to analyze the expression levels of VEGF and VEGFR2 proteins that promote tumor apoptosis (Bcl-2 and Bax) and inhibit angiogenesis. Our results demonstrated that SPS-1 downregulated the expression of Bcl-2 protein and upregulated the expression of Bax protein in the tumor tissues, but the expression levels of VEGF and VEGFR2 proteins were significantly lower than those in the control group, indicating that SPS-1 can inhibit the development of Lewis tumor by promoting tumor apoptosis and inhibiting angiogenesis.
The antitumor effects of polysaccharides have attracted considerable interest. The mechanism of action of polysaccharides is primarily divided into two types; the first one is directly acting on tumor cells, directly inducing tumor cell differentiation and apoptosis, and the second approach is acting on host cells, inhibiting tumor cell growth, or killing tumor cells by enhancing their immune function. 18 Polysaccharides can resist tumor development by activating macrophages and lymphocytes, promoting cytokine secretion, and improving host antitumor immune function.19–21 Macrophages are the primary immunoregulatory cells in tumors and play a vital role in the tumor immune response. 22 The polarization of TAMs is ubiquitous in tumorigenesis and development. M1 and M2 macrophages differ in terms of phenotype, markers, arginine metabolism, and influence on tumors. M1 macrophages generally refer to typical activated proinflammatory cytokines, such as TNF-α, IL-1β, and IL-6, and cell membrane molecules CD40, CD80, and CD86 that are increasingly expressed. 23 M2 macrophages exhibit higher transcriptional expression of mannose receptor (CD206) and can downregulate the immune response and reduce the production of proinflammatory cytokines by secreting the inhibitory cytokines IL-10 and TGF-β. 24 The two categories of macrophages can be distinguished from each other according to the metabolism of arginine. M1 macrophages preferentially metabolize arginine to NO through iNOS, whereas M2 macrophages preferentially metabolize arginine to ornithine through Arg-1. 25 We found that the expression of the membrane surface molecule CD206 of M2 macrophages and its marker Arg-1 protein significantly decreased in the SPS-1 treatment group, whereas the expression of the membrane surface molecule CD86 and the marker iNOS protein of M1 macrophages significantly increased. This result suggested that the antitumor effect of SPS-1 involved indirect inhibition of the development of tumors by regulating the polarization of TAMs.
The chemical structure of polysaccharides is the material basis for their biological activity. It has been demonstrated that the immune-stimulating activity of polysaccharides is related to their molecular weight. In particular, extensive research has shown that polysaccharides with molecular weights between 10 and 1000 kDa exhibit better immune activity, whereas those with molecular weights less <10 or >1000 kDa exhibit weaker immunoregulatory activity. 26 Regarding the glycosidic bond connection mode, β-glucan and α-1,6- and α-1,3-glycosidic bond connection or β-1,4-, β-1,3-, β-1,2-, and β-1,6-glycosidic bond-linked mannan and galactomannan, β-1,4-, β-1,3-, β-1,6-glycosidic bond-linked arabinogalactan, acid pectin polysaccharide, etc, all have immunity-enhancing activity. 27 The molecular weight of SPS-1 is 138.52 kDa, and the major connection method is β-13,6-arabinogalactan. This study also further confirmed that SPS-1, which is abundant in arabinose and galactose, can inhibit tumor development by regulating the immune activity of TAMs.
In conclusion, SPS-1 can regulate the polarization phenotype of macrophages in the tumor microenvironment of lung cancer—transplanted mice, promote tumor apoptosis, inhibit tumor angiogenesis, and improve the tumor inhibition rate. Therefore, it may be used to treat lung cancer by changing the polarization phenotype of macrophages to the M1 type in the microenvironment of lung cancer. This study provides novel material in the form of S. adnata polysaccharide SPS-1 for the immunotherapy of NSCLC and other cancer types.
Materials and Methods
Experimental Animals
Male C57BL/6 mice aged 6–8 weeks (body weight 18-22 g) were purchased from Liaoning Changsheng Biotechnology Co., Ltd, license number: SCXK (Liao) 2020-0001. Animal experiments complied with the Regulations on the Administration of Experimental Animals issued by the National Science and Technology Commission.
Experimental Drug
S. adnata polysaccharide SPS-1 with a sugar content of 94.76% was prepared. 10
Reagents
The mouse lung cancer cell line (Lewis) was purchased from Procell Life Science & Technology Co., Ltd. Moreover, the following reagents were used in this study: Annexin V-FITC/PI apoptosis detection kit, reverse transcription kit, and SYBR Green (Vazyme Biotechnology); iNOS, Bcl-2, and Bax antibodies (Abcam); VEGF antibodies (Bioss Biotechnology Co., Ltd); VEGFR2, CD206, and Arg-1 antibodies (Proteintech Group, Inc.); and CD86 antibodies (Novus). Other chemicals and reagents used in this study were of analytical grade.
Model Grouping, Administration, Tissue Sampling, and Pathomorphological Observation
Lewis tumor cells were injected into the right subaxillary subcutaneous area of each C57BL/6J mouse (2.0 × 10⁶/mouse), and the body weight, tumor long diameter a, and short diameter b were measured every 3 days. When the tumor diameter reached 5 mm, 24 mice with uniform tumor size and in good condition were selected and randomly and equally divided into four groups, viz., control (normal saline) and SPS-1 low-, medium-, and high-dose groups (25, 50, and 100 mg/kg, respectively). SPS-1 (10 μL/g, nine injections) was intravenously injected into the tail once every other day. Twenty-four hours after the last administration (18 days). Blood was collected after an intraperitoneal injection of 10% chloral hydrate, and the tumor was dissected and weighed. The tumor tissue was fixed with 4% paraformaldehyde, embedded, sectioned, and stained with HE.
TUNEL Detection
The tumor tissues were collected, dehydrated, embedded, and sectioned. The TUNEL reaction mixture was added dropwise, and the tumor tissues were incubated at 37 °C for 60 min and then washed three times with PBS. DAPI nuclear stain was added dropwise, and then the tissues were sealed with glycerin. A fluorescence microscope (BX53, Olympus) was used for observation and film analysis.
Immunohistochemical Analysis
The expression of Bax, Bcl2, VEGF, and VEGFR2 proteins in the tumor tissues was examined by immunohistochemistry. After fixing the tumor tissues in paraformaldehyde, the sections were dewaxed, the antigen was repaired, the first and second antibodies were combined and stained, the neutral gum was sealed, and the tissue section image was collected under a pathological imaging system. Then, the image was observed under a microscope. The average optical density values (positive area%) of Bax, Bcl2, VEGF, and VEGFR2 were calculated using the ImageJ image analysis software, and the positive area% = IOD value/positive area was obtained.
Real-Time Quantitative PCR
Total RNA was extracted using the Trizol method. After detecting the purity of RNA using an enzyme marker, cDNA was synthesized by reverse transcription according to the instructions of the reverse transcription kit, and real-time PCR (QuantStudio 6, ABI) was performed. The PCR primer was designed according to the gene sequence in GenBank. The expression levels of TNF-α, iNOS, IL-10, TGF-β, and Arg-1 genes were detected, with β-actin used as the internal reference. The PCR amplification conditions were as follows: predenaturation at 95 °C for 10 min; denaturation at 95 °C for 15 s; and annealing at 60 °C for 60 s, for a total of 40 cycles. Each group had three duplicated holes. The primer design was as follows: the upstream sequence of iNOS was 5′-TTGGCTCCAGCATGTACCCT-3′ and the downstream sequence was 5′-TCCTGCCCACTGAGTTCGTC-3′; the upstream sequence of TNF-α was 5′-AGCACAGAAAGCATGATCCG-3′ and the downstream sequence was 5′-CTGATGAGAGGGAGGCCATT-3′; the upstream sequence of IL-10 was 5′-GCTGGACAACATACTGCTAACCG-3′ and the downstream sequence was 5′-CACAGGGGAGAAATCGATGACAG-3′; the upstream sequence of Arg-1 was 5′-ATCGTGTACATTGGCTTGCG-3′ and the downstream sequence was 5′-CGTCGACATCAAAGCTCAGG-3′; the upstream sequence of IL-4 was 5′-GTAGGGCTTCCAAGGTGCT-3′ and the downstream sequence was 5′-TGCTCTTTAGGCTTTCCAG-3′; the upstream sequence of IL-6 was 5′-CACAGAGGATACCACTCCCAACAGA-3′ and the downstream sequence was 5′-ACAATCAGAATTGCCATTGCACAAC-3′; and the upstream sequence of GAPDH was 5′-ATGGGTGTGAACCACGAGA-3′ and the downstream sequence was 5′-CAGGGATGATGTTCTGGGCA-3′. The value of 2−△△Ct represented the relative expression level of the target gene.
Immunofluorescence Double Staining
Paraffin-embedded tumor sections were cut into slices, hydrated, and then boiled under high pressure in sodium citrate repair solution (pH = 6.0) for 5 min to repair tissue antigens. After free cooling to room temperature, the slices were rinsed three times with PBS solution for 5 min each time. Then, 3% hydrogen peroxide solution was added and incubated at 37 °C for 10 min, followed by the addition of 10% goat serum blocking solution and incubation at 37 °C for 10 min. After shaking off the serum, the primary antibody mixture was added and incubated overnight at 4 °C. Then, the slices were rinsed with PBS and dripped with a mixture of FITC-labeled sheep anti-rabbit (1:100) and cy3-labeled sheep anti-mouse (1:100) fluorescent secondary antibodies, followed by incubation in the dark at 37 °C for 1 h. After rinsing with PBS, DAPI solution was added dropwise to stain the nucleus in the dark for 5 min. An anti-fluorescence attenuation sealing agent was used to seal the slices, after which the slices were observed and photographed for analysis using a fluorescence microscope (BX53, Olympus).
Statistical Analysis
All tests were performed in triplicate, unless otherwise indicated, and the values are expressed as mean ± standard deviation. One-way analysis of variance was performed to evaluate the significance at P < .05 using Duncan's multiple-range tests. In the chart, * represents P < .05, ** represents P < .01, *** represents P < .001, and **** represents P < .0001.
Footnotes
Author Contributions
L.Y. was involved in the data curation and formal analysis and wrote the original draft. Y.H. reviewed and edited the manuscript. All authors have read and agreed to the published version of the manuscript.
Declaration of Conflicting Interests
The author(s) declared no potential conflicts of interest with respect to the research, authorship, and/or publication of this article.
Funding
The author(s) disclosed receipt of the following financial support for the research, authorship, and/or publication of this article: This work was supported by the Natural Science Foundation of Tibet Autonomous Region (grant number XZ202001ZR0071G).
Ethical Approval
Not applicable.
Statement of Human and Animal Rights
Not applicable.
Informed Consent
There are no human subjects in this article and informed consent is not applicable.