
Abstract
Background
Differentiated bone marrow mesenchymal stem cells (BMSCs) may be a therapeutic strategy to treat sarcopenia caused by high glucose. The effects of resveratrol in the myogenic induction of BMSCs under high glucose are unknown. We evaluated the effects and possible mechanisms of high glucose and resveratrol on myogenic induction of rat BMSCs.
Methods
Primary rat BMSCs were isolated and purified from Sprague-Dawley rats aged between 3 and 4 weeks. Rat BMSCs were differentiated into myogenic cells using conditioned medium and treated with glucose and/or resveratrol along with EX527 (a specific silent information regulator 1 [SIRT1] inhibitor). The expressions of MyoD1 and Myogenin were measured. The reactive oxygen species (ROS) level, superoxide dismutase (SOD) activity, and the expressions of FOXO1 and p-AKT/AKT during myogenic induction were also examined.
Results
High glucose decreased cell viability, cell proliferation, and SOD activity, increased intracellular ROS levels, and inhibited the AKT/FOXO1. Resveratrol reversed myogenic induction suppression caused by high glucose, partly through restoring cell proliferation and viability, reducing peroxidative damage, and activating the AKT/FOXO1 pathway; this effect was eliminated by EX527.
Conclusion
Our results indicate that resveratrol promoted myogenic induction and partially reversed the suppression of myogenic induction caused by high glucose through activating the SIRT1/AKT/FOXO1 pathway.
Introduction
Diabetes is a chronic disease, and older diabetic patients are prone to sarcopenia, the age-related loss of muscle mass and strength. Researchers have demonstrated that a long-term high glucose environment in the body can cause muscle tissue atrophy. 1 Sarcopenia is also closely related to frailty, 2 and sarcopenia and/or frailty increase the risk of events such as disability, paralysis, and falling. 3 Various strategies have been proposed for sarcopenia, including exercise and nutrition. Several studies have also shown the potential for regenerative medicine as an attractive strategy to address sarcopenia.4,5
Bone marrow mesenchymal stem cells (BMSCs) are a subgroup of cells with multi-differentiation potential that undergo differentiation through a complex process involving multiple cellular pathways. Because of the multi-differentiation potential of BMSCs, these cells have been explored in the application for the treatment of a variety of diseases and conditions such as type 1 diabetes, inflammatory bowel disease, and angiogenesis.6–8 Several studies demonstrated that BMSCs can be induced to differentiate into muscle cells under specific induction conditions.9,10 Therefore, differentiation of BMSCs may represent a therapeutic strategy to treat sarcopenia caused by high glucose.
Resveratrol, a non-flavonoid polyphenolic compound, is mainly derived from peanuts, grapes, and mulberry. Resveratrol has been shown to exhibit various therapeutic effects, including anti-oxidation, anti-inflammation, anti-tumor, anti-diabetes, anti-aging, and myocardial protection activities. 11 A recent study indicated that resveratrol positively regulates and stimulates the activity of downstream transcriptional molecules by activating silent information regulator 1 (SIRT1). 12 We previously demonstrated that resveratrol promotes angiogenesis in bone marrow mononuclear cells of diabetic mice by activating SIRT1. 13 Resveratrol also induces osteogenic differentiation of BMSCs via the SIRT1/FOXO1 axis. Stimulation of SIRT1 expression by resveratrol leads to a decrease in adipogenesis and an increase in osteogenesis, which was determined by the acetylation levels of Runx2 and Foxo1 transcription factors. 14 FOXO1 also plays a key role in signaling pathways that regulate myogenic differentiation. 15
To the best of our knowledge, the role and mechanism of resveratrol in the myogenic induction of BMSCs under a high glucose environment have not been reported. The main aim of this study was to examine the effects of high glucose and resveratrol on the myogenic induction of BMSCs. We also explored the possible mechanisms by which resveratrol may affect myogenic induction.
Results
Cell Culture and Identification
Primary rat BMSCs were isolated and purified, as described in Materials and Methods. Analysis of cell morphology revealed fibroblast-like adherent cells (Figure 1A). Compared with the morphology of P0 cells, the morphology of P3 cells was more uniform and orderly; the cells exhibited a spiral and fence-like arrangement (Figure 1B). Immunofluorescence showed that P3 cells were positive for CD44 (Figure 1C) and CD90 (Figure 1D) and negative for CD34 (Figure 1E) and CD31 (Figure 1F), indicating that these were BMSCs of high purity. Therefore, P3 cells with good growth status were used for subsequent experiments.

Culture and identification of bone marrow mesenchymal stem cells (BMSCs) derived from rat bone marrow. (A) P0 BMSCs cultured for 72 h (40×), (B) P3 BMSCs (40×), (C) positive CD44 expression in P3 cells (100×), (D) positive CD90 expression in P3 cells (100×), (E) negative CD34 expression in P3 cells (100×), and (F) negative CD31 expression in P3 cells (100×). Scale bars: 100 µm.
Modeling of the Myogenic Induction of BMSCs
After 14 days of myogenic differentiation, BMSCs were examined for MyoD1 and Myogenin, and positive MyoD1 and Myogenin expressions were detected (Figure 2A). These findings confirmed the successful myogenic induction of BMSCs.

The expressions of MyoD1, Myogenin, FOXO1, and p-AKT/AKT during myogenic differentiation of bone marrow mesenchymal stem cells (BMSCs). (A) The expression of MyoD1 and Myogenin at 3, 7, and 14 days of differentiation and (B) the expression of FOXO1 and p-AKT/AKT before (control) and after myogenic differentiation (OM) of BMSCs. N = 3 for each group. *P < .05 is compared with the control group.
To examine the expressions of FOXO1 and p-AKT/AKT in differentiation, we detected the expression of FOXO1 and p-AKT/AKT in differentiated cells. We found that FOXO1 and p-AKT/AKT levels were significantly higher than the levels in the control group (t Foxo1=-14.84, PFoxo1 < .001, tp−AKT/AKT = -6.94, Pp−AKT/AKT = .002, Figure 2B).
The Effect of Different Glucose Concentrations and Culture Times on cell Viability During Myogenic Induction
We next investigated the effect of different glucose concentrations and treatment times on cell viability. No significant difference was observed in the cell viability of the 25 mmol/L glucose group from 24 h to 72 h (F = 3.95, P = .053) (Figure 3). However, the cell viability in the 35 mmol/L glucose group was reduced at 48 h and markedly decreased at 72 h. The cell viability at 72 h was significantly lower than that at other time points (P72h vs 48h = .014, P72h vs 24h = .001, P72h vs 48h = .001). From these results, we selected the concentration of glucose at 35 mmol/L for subsequent experiments, and the cells in all groups were treated for either 72 h or 14 days.

The effect of different glucose concentrations and treatment time on cell viability. The cell viability was significantly inhibited in cells cultured in a glucose concentration at 35 mmol/L or 72 h. N = 3 for each group. *P < .05 is compared with the control group, #P < .05 is compared with the 24 h group, @P < .05 is compared with the 48 h group.
The Decreased Effects of High Glucose and the Increased Effects of Resveratrol on cell Viability and Proliferation During Myogenic Induction of BMSCs
To investigate the effects of high glucose and resveratrol on cell viability and proliferation during myogenic induction of BMSCs, we performed experiments in 6 groups: the control group, myogenic induction group (OM group), myogenic induction + glucose group (OM + G group), myogenic induction + resveratrol group (OM + R group), myogenic induction + glucose + resveratrol group (OM + G + R group), and the myogenic induction + glucose + resveratrol + EX527 group (OM + G + R + EX527 group). After treatment for 72 h, there were significant differences in cell viabilities and the percentage of cells in G2 + S among the 5 groups (Fviability = 20.46, Pviability <.001, Fproliferation = 124.73, Pproliferation < .001, Figure 4). Cell viability and proliferation were highest in the OM + R group and significantly higher than those in the other groups (Pviability OM + R vs OM = .005, Pproliferation OM + R vs OM < .001, Pviability OM + R vs OM + G < .001, Pproliferation OM + R vs OM + G < .001, Pviability OM + R vs OM + G + R = .001, Pproliferation OM + R vs OM + G + R < .001, Pviability OM + R vs OM + G + R + EX527 < .001, P proliferation OM + R vs OM + G + R + EX527 < .001).

The effects of high glucose and resveratrol on cell viability and proliferation index during myogenic induction of bone marrow mesenchymal stem cells (BMSCs). (A) The cell viability in different groups. (B and C) The proliferation index in different groups. N = 3 for each group. *P < .05 is compared with the OM group, #P < .05 is compared with the OM + G group, @P < .05 is compared with the OM + R group, &P < .05 is compared with the OM + G + R group.
Cell viabilities and proliferations in the OM and OM + G + R groups were significantly higher than those in the OM + G and OM + G + R + EX527 groups (P viability OM + G vs OM = .002, Pproliferation OM + G vs OM < .001, Pviability OM + G + R + EX527 vs OM = .003, Pproliferation OM + G + R + EX527 vs OM < .001, Pviability OM + G + R vs OM + G = .006, Pproliferation OM + G + R vs OM + G = .003, Pviability OM + G + R + EX527 vs OM +G + R = .011, P proliferation OM + G + R + EX527 vs OM +G + R = .004).
Compared with the OM group, the cell viability in the OM + R + G group did not significantly change (P = .446). In contrast, the cell proliferation in the OM + R + G group decreased significantly (P < .001). There were no significant differences in cell viability and proliferation between the OM + G group and the OM + G + R + EX527 group (Pviability =.725, P proliferation = .881).
The Effect of High Glucose and Resveratrol on the Expression of MyoD1 and Myogenin
We next investigated the effect of 14 days of treatment of high glucose and resveratrol on the expressions of MyoD1 and Myogenin. We found that there were significant differences in MyoD1 and Myogenin expressions among the 5 treatment groups (FMyoD1 = 70.93, PMyoD1 < .001, FMyogenin = 77.45, PMyogenin < .001, Figure 5). The expressions of MyoD1 and Myogenin were highest in the OM + R group and markedly higher than those in all other groups (P MyoD1 OM + R vs OM < .001, P Myogenin OM + R vs OM =.006, PMyoD1 OM + R vs OM + G < .001, P Myogenin OM + R vs OM + G < .001, P MyoD1 OM + G + R vs OM + R < .001, P MyoD1 OM + G + R + EX527 vs OM + R < .001, P Myogenin OM + G + R vs OM + R = .001, P Myogenin OM + G + R + EX527 vs OM + R < .001).
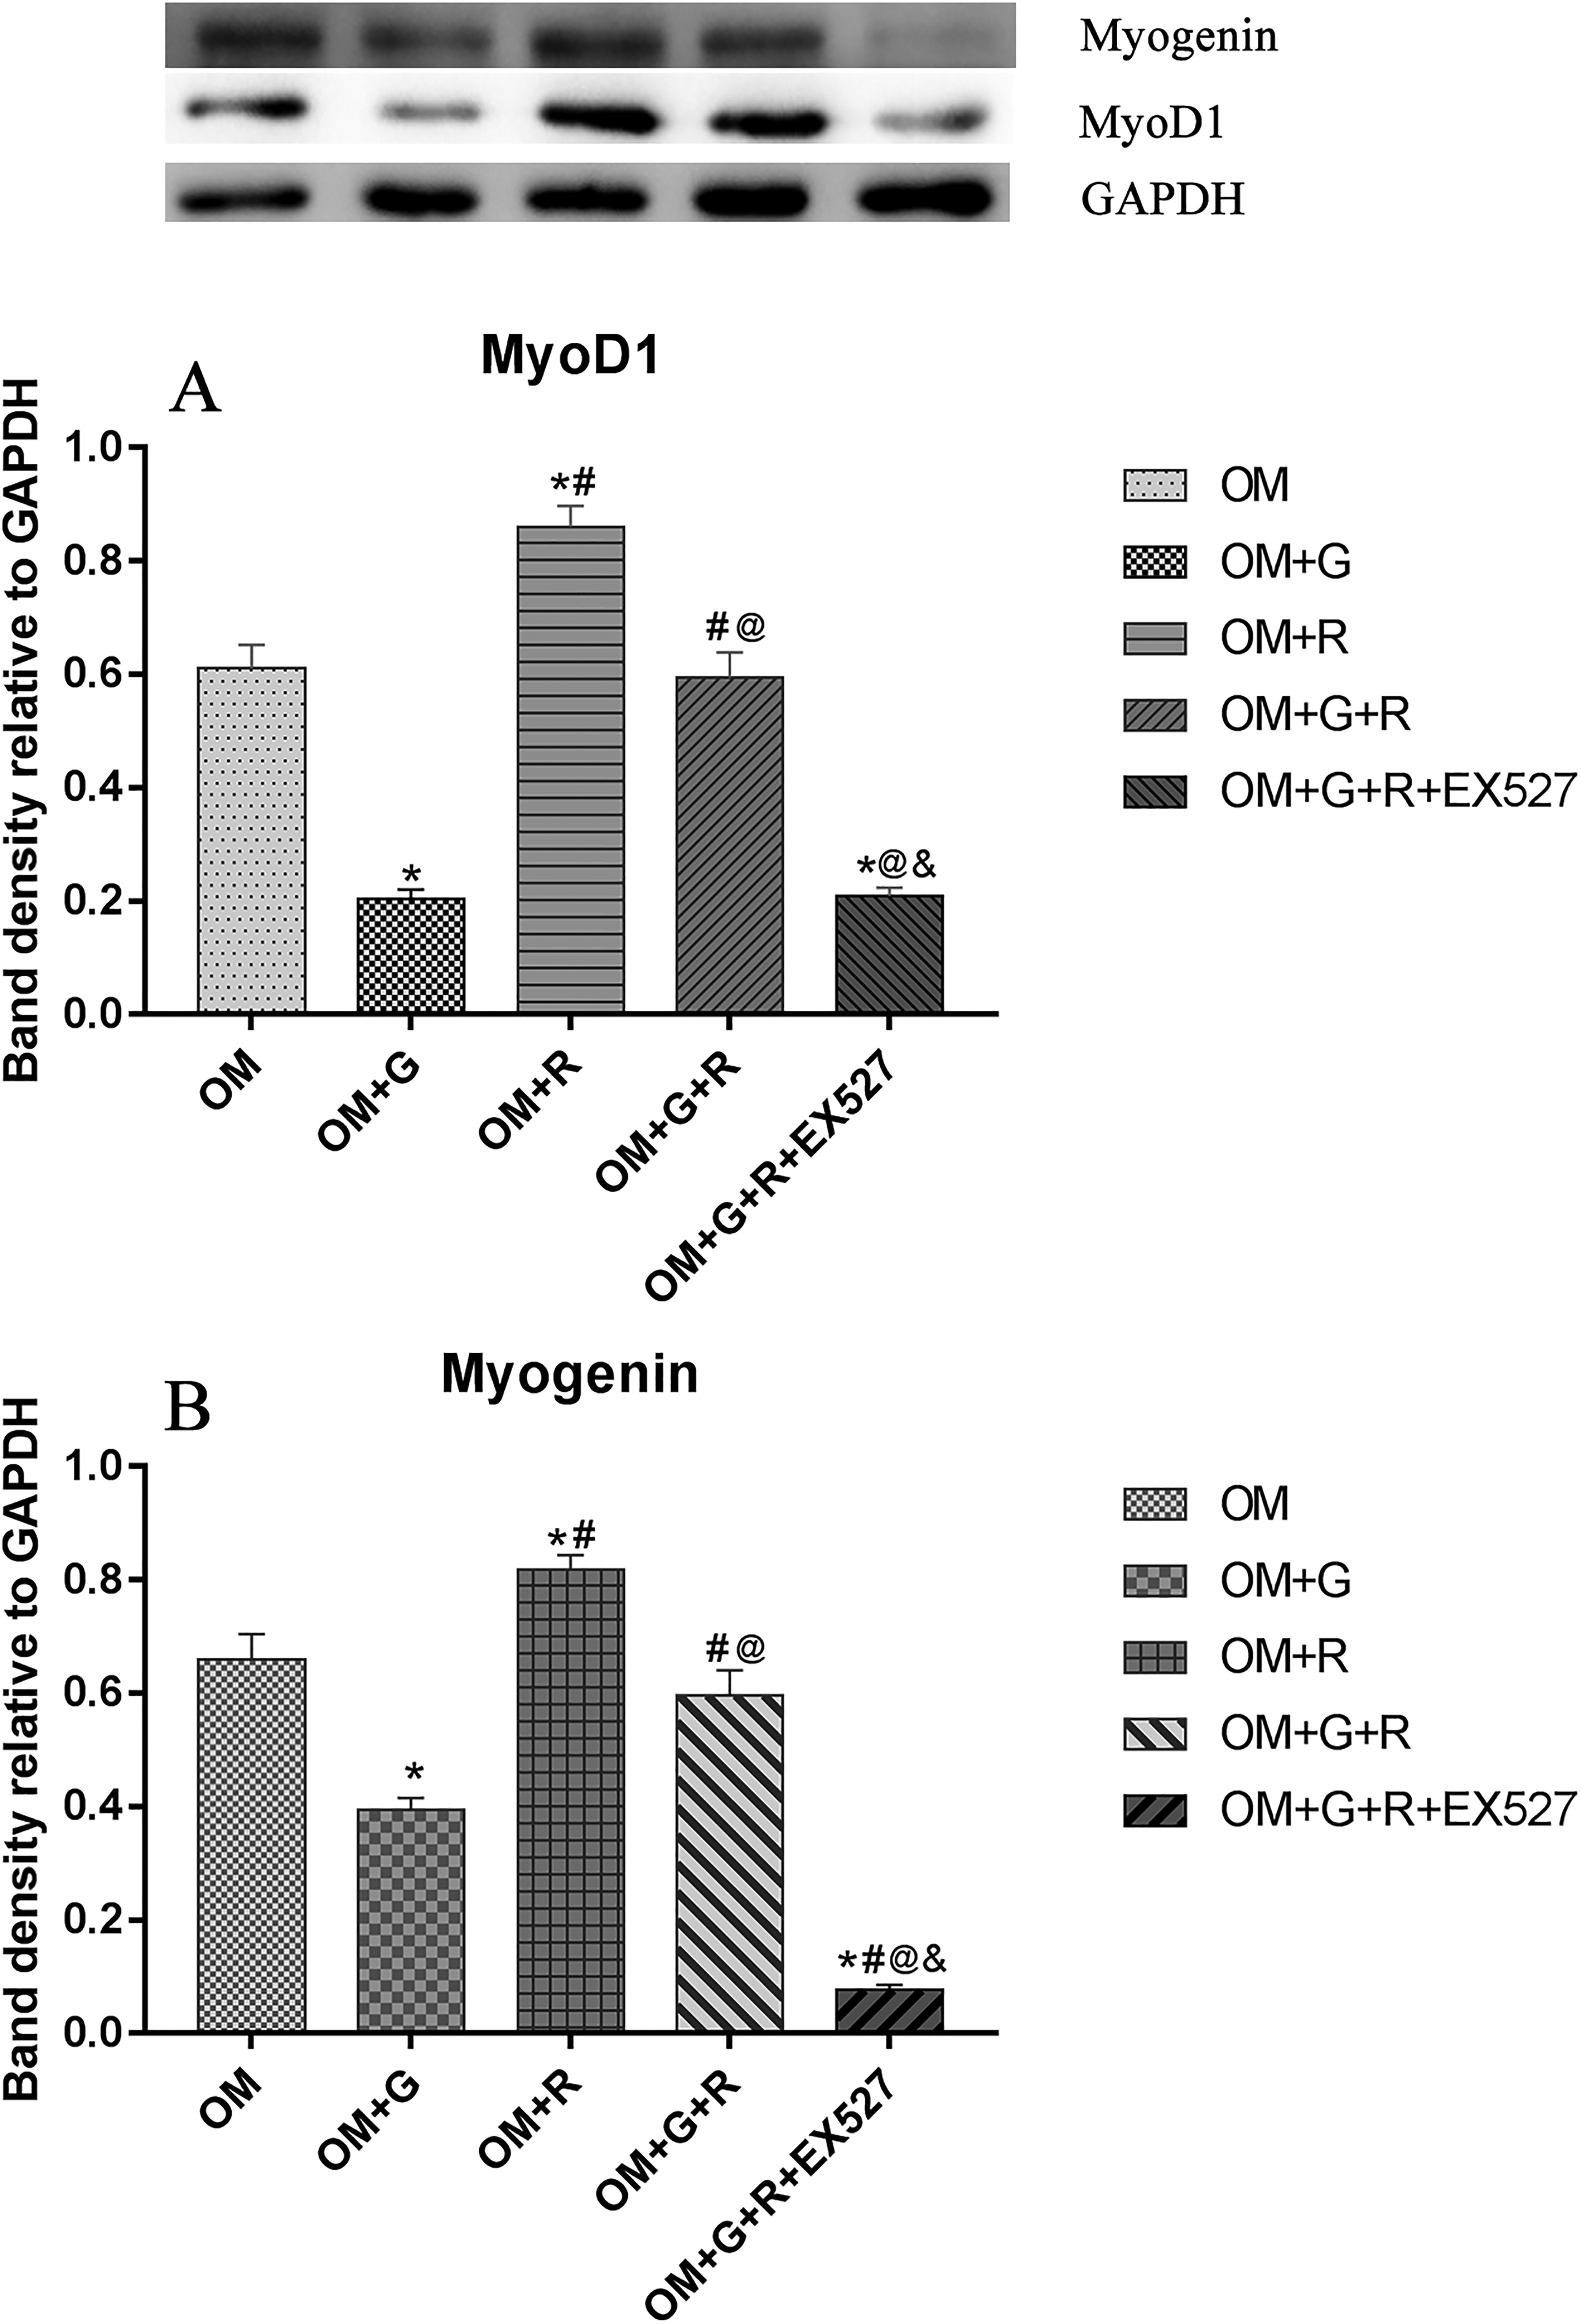
The expressions of MyoD1 and Myogenin in different groups. (A) The expression of MyoD1 in each group and (B) the expression of Myogenin in all groups. N = 3 for each group. *P < .05 is compared with the OM group, #P < .05 is compared with the OM + G group, @P < .05 is compared with the OM + R group, &P < .05 is compared with the OM + G + R group.
The expressions of MyoD1 and Myogenin in the OM and OM + G + R groups were significantly higher than those in the OM + G and OM + G + R + EX527 groups (all P ≤ .001). No changes were seen in MyoD1 and Myogenin expressions between the OM + G + R group and the OM group (P MyoD1 = .727, P Myogenin =.196). Compared with the OM + G group, the expression of MyoD1 in the OM + R + G + E527 group changed slightly (P = .924). However, the expression of Myogenin in the OM + R + G group decreased significantly (P < .001).
The Effect of High Glucose and Resveratrol on Reactive Oxygen Species (ROS) Level and Superoxide Dismutase (SOD) Activity
To study oxidative stress damage caused by high glucose, we examined ROS level and SOD activity. During myogenic differentiation of BMSCs, significant differences were seen in the ROS levels and SOD activities among all 5 groups (FROS = 150.09, PROS < .001, FSOD = 30.42, PSOD < .001, Figure 6). ROS levels in the OM and OM + R groups were significantly lower than those in the OM + G, OM + G + R, and OM + G + R + EX527 groups (all P < .001), while SOD activities in these 3 groups were markedly lower than those in the OM and OM + R groups (all P < .001).

The ROS levels and SOD activities in all groups of BMSCs during myogenic induction. (A) The ROS levels of different groups and (B) the SOD activity of each group. N = 3 for each group. *P < .05 is compared with the OM group, #P < .05 is compared with the OM + G group, @P < .05 is compared with the OM + R group, &P < .05 is compared with the OM + G + R group.
No significant differences were seen in ROS level and SOD activity between the OM + R group and the OM group (PROS = .171, PSOD = .797). The ROS levels in the OM + G + R and OM + G + R + EX527 groups were significantly lower than that in the OM + G group (P OM + G + R vs OM + G < .001, P OM + G + R + EX527 vs OM + G = .019).
In contrast, SOD activity in the OM + G + R group was significantly higher than that in the OM + G group (P OM + G + R vs OM + G = .03), but there was no significant difference in SOD activity between the OM + G + R + EX527 group and the OM + G group (P = .801). Finally, compared with the OM + G + R group, the ROS level in the OM + G + R + EX527 group was significantly increased (P = .001) and the SOD activity was significantly lower (P = .019).
The Expressions of FOXO1 and p-AKT/AKT in Different Groups
We next examined the expressions of FOXO1 and p-AKT/AKT during myogenic induction. No FOXO1 was detected in the OM + G + R + EX527 group (Figure 7). There were significant differences in the expressions of FOXO1 and p-AKT/AKT among the other 4 groups (F = 179.78, P < .001, F = 208.45, P < .001). The expressions of FOXO1 and p-AKT/AKT were highest in the OM + R group and significantly higher than those in other groups (all P < .001).
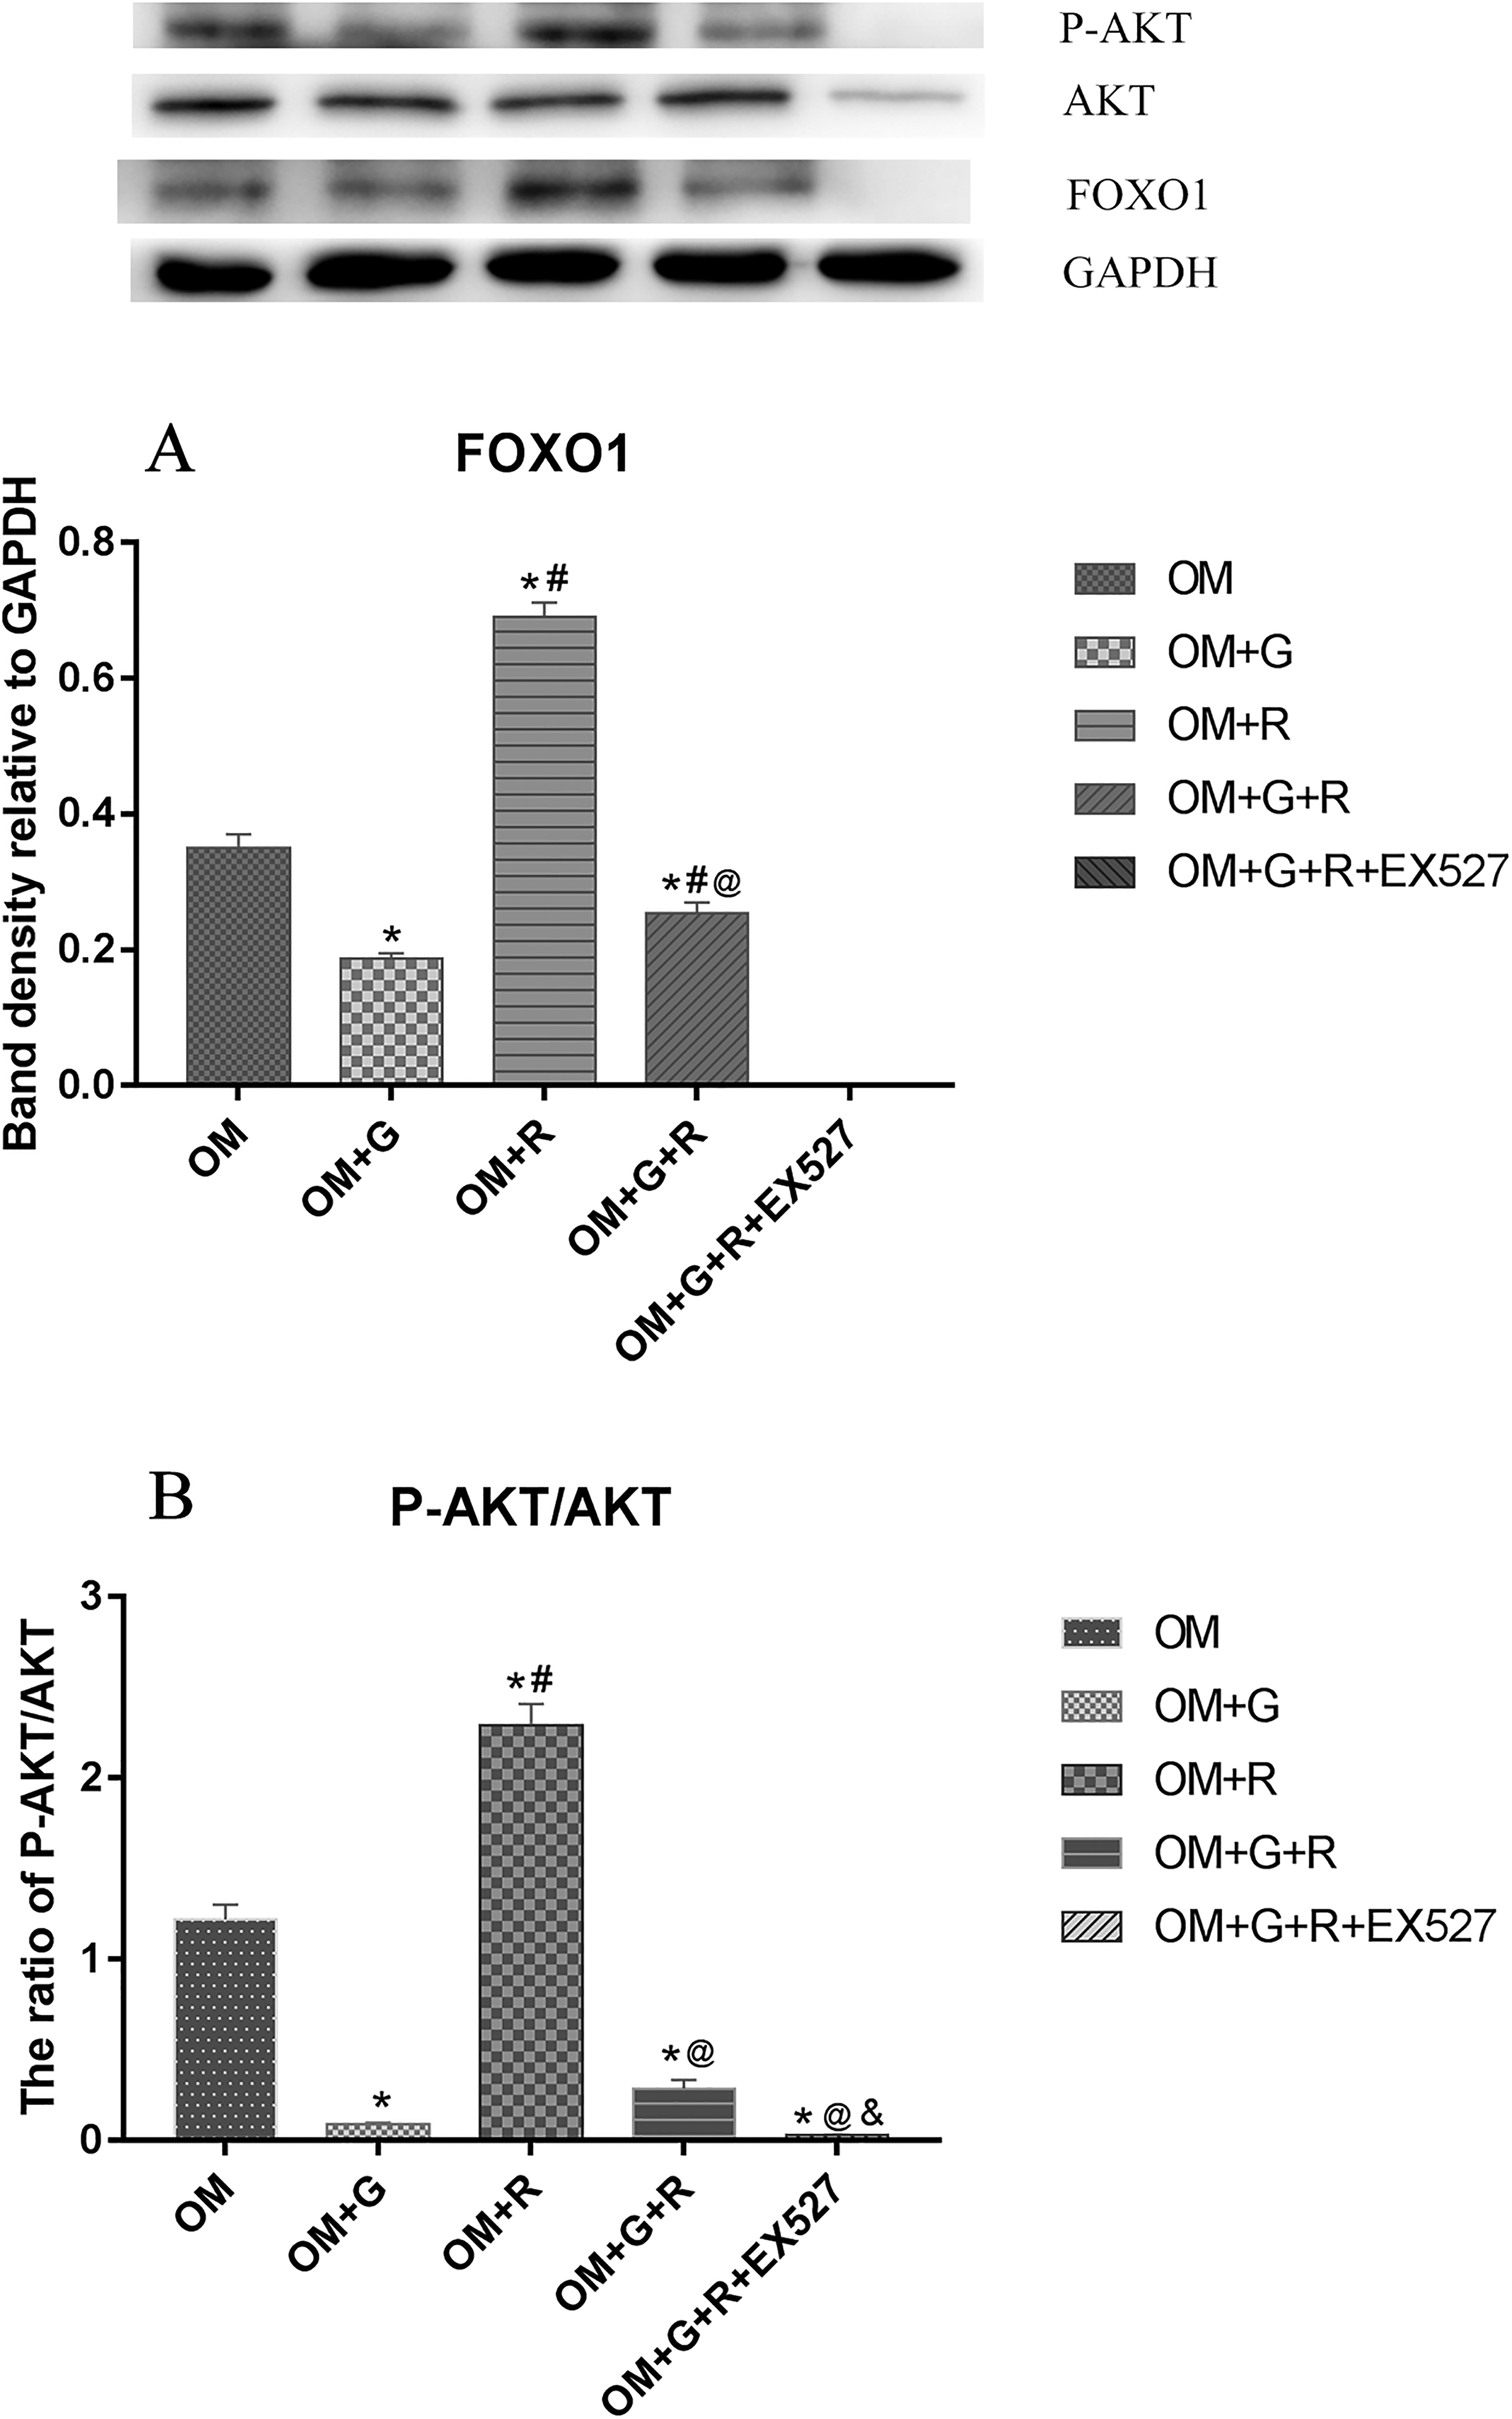
The expression of FOXO1 and p-AKT/AKT during myogenic induction. (A) The expression of FOXO1 in each group and (B) the ratio of p-AKT/AKT in different groups. N = 3 for each group. *P < .05 is compared with the OM group, #P < .05 is compared with the OM + G group, @P < .05 is compared with the OM + R group, &P < .05 is compared with the OM + G + R group.
Expression of FOXO1 in the OM + G was the lowest and lower than those in the OM and OM + G + R groups (P OM vs OM + G < .001, P OM + G + R vs OM + G = .023). Moreover, a significant difference in FOXO1 was seen between the OM group and the OM + G + R group (P = .003, Figure 7A).
p-AKT/AKT in the OM group was markedly higher than those in OM + G, OM + G + R, and OM + G + R + EX527 groups (all P < .001, Figure 7B). No significant difference was seen in p-AKT/AKT among OM + G, OM + G + R, and OM + G + R + EX527 groups (P OM + G + R vs OM + G = .063, P OM + G + R + EX527 vs OM + G = .547), but a significant difference was seen between the OM + G + R group and the OM + G + R + EX527 group (P = .022).
Discussion
In BMSCs, the expressions of CD44 and CD90 are positive while the expression of CD31 and CD34 are negative.16,17 In this study, rat BMSCs were cultured and surface antigen protein expressions of BMSCs were confirmed. MyoD1 and Myogenin determine myogenic differentiation and function as important markers in the early stage of myogenic differentiation.18,19 We showed that MyoD1 and Myogenin expressions increased sharply in BMSCs after 14 days of myogenic differentiation. These results confirmed the successful myogenic differentiation of rat BMSCs.
A high glucose environment inhibits the proliferation of BMSCs and negatively regulates osteogenic and myogenic differentiation in vitro.20,21 In our experiments, high glucose negatively affected myogenic differentiation and decreased cell viability, cell proliferation index, and the expressions of MyoD1 and Myogenin. These results were in agreement with the previous studies cited above. In this study, resveratrol exhibited effects opposite to those of high glucose and partially reversed the above changes caused by high glucose. However, this reversed effect was blocked by EX527 (an inhibitor of SIRT1). These results suggested that SIRT1 may play a role in resveratrol-promoted myogenic differentiation.
Diabetes or high glucose can cause oxidative damage in a variety of cells.22,23 Our results were consistent with this. High glucose lowered SOD activity and elevated ROS level, and these effects were partly reversed by resveratrol. In addition, the reversing effect of resveratrol was blocked by EX527. The changed characteristics of oxidative stress in each group were consistent with the changes in cell viability, cell proliferation index, and the expressions of MyoD1 and Myogenin in the different groups.
The PI3K-AKT-FOXO1 pathway plays an important role in several systems, especially in bones and muscles.24,25 Activation of AKT enhances the activity of MyoD in myogenesis, induces the differentiation of myocytes, and causes integration of myocytes into regenerated muscle fibers. 26 We found that the expressions of FOXO1 and p-AKT/AKT increased with the increased expressions of MyoD1 and Myogenin. These results indicate that the AKT/FOXO1 pathway was activated and may play a role during myogenic differentiation. Furthermore, p-AKT/AKT and FOXO1 showed similar trends in response to high glucose, resveratrol, and EX527. High glucose decreased p-AKT/AKT and FOXO1 levels while resveratrol increased their levels. Notably, the promoting effect of resveratrol was blocked by inhibition of SIRT1 with EX527. These trends were observed in oxidative stress, cell viability, cell proliferation index, and expressions of MyoD1 and Myogenin in different groups.
Together, our results indicated that high glucose negatively regulates the myogenic induction of rat BMSCs by inhibiting cell proliferation, reducing cell viability and oxidative damage, and inactivating the AKT/FOXO1 pathway. Resveratrol positively regulated this process through restoring cell proliferation and viability, reducing peroxidative damage, and activating the SIRT1/AKT/FOXO1 pathway. Therefore, resveratrol not only promoted the myogenic induction of rat BMSCs but also reversed myogenic induction suppression of rat BMSCs caused by high glucose through activating the SIRT1/AKT/FOXO1 pathway.
Materials and Methods
All animal experiments were approved by the Ethical Committee of the Second Affiliated Hospital of Harbin Medical University (KY2018-140).
Materials and Reagents
Male Sprague-Dawley rats (SPF grade) were provided by the Animal Experimental Center of The Second Affiliated Hospital of Harbin Medical University. DMEM/F12 was purchased from Hyclone Laboratories (Logan, UT, USA), dexamethasone from Solarbio Science & Technology (Shanghai, China), the SOD detection kit from Nanjing Institute of Bioengineering (Nanjing, China), the Reactive Oxygen Detection Kit and SDS-PAGE gel preparation kit from Beyotime Institute of Biotechnology (Shanghai, China), anti-CD44, anti-CD90, anti-CD31, anti-CD34 and goat anti-rabbit IgG-Cy3 from Absin Bioscience Inc. (Shanghai, China). MyoD1 and Myogenin primary antibodies from Abcam (Cambridge, UK), anti-Caspase-3, anti-FOXO1, anti-AKT, and anti-P-AKT from Cell Signaling Technology, Inc. (Danvers, MA, USA), and IgG-FITC, (H + L)/HRP and (H + L)/HRP secondary antibodies from Zhongshan Golden Bridge Biotechnology (Beijing, China).
Muscle differentiation induction (OM) medium including DMEM/Ham's F12, horse serum (2%), glutamine (1%), bFGF (1 ng/mL), and dexamethasone (0.4 µg/mL) was prepared according to a previous study. 27
Methods
Cell Culture and Identification
Primary cultures of rat BMSCs were prepared from Sprague-Dawley rats aged between 3 and 4 weeks. The animals were sacrificed by cervical dislocation and soaked in 75% ethanol for 10 min. The bilateral femur and tibia of rats were removed under aseptic conditions. The periosteum and muscle tissue were dissected and then washed with PBS 3 times. Next, the medullary cavity was cut and washed repeatedly with DMEM/F12 medium containing 10% fetal bovine serum. The sample was centrifuged, and the pellet (cells) was inoculated into cell bottles and cultured in a humidified atmosphere at 37 °C with 5% CO2. The medium was changed after 48 h. When the cells achieved 80% confluence, the cells were passaged. Third-generation (P3) cells were used for experiments. 8
Cell Identification
P3 cells were fixed with paraformaldehyde for 15 min at room temperature, followed by incubation in blocking solution and gentle shaking for 30 min on a horizontal shaker. The samples were incubated with anti-CD44, anti-CD90, anti-CD31, and anti-CD34 antibodies overnight at 4 °C. Secondary antibody was added and samples were then incubated for 1 h at room temperature. Cells were stained with DAPI for 5 min, and stained cells were observed under a fluorescence microscope.
Treatment and Grouping
P3 cells were cultured in muscle differentiation induction (OM) medium with different concentrations of glucose (25 mmol/L and 35 mmol/L) and resveratrol (15 μmol/L) with or without EX527 (Cayman, USA) (SIRT1 inhibitor, 20 μmol/L) 28 according to the experimental design. The OM medium included DMEM/Ham's F12, horse serum (2%), glutamine (1%), bFGF (1 ng/mL), and dexamethasone (0.4 µg/mL), as previously described. 27
Six experimental groups were established: the control group, myogenic induction group (OM group), myogenic induction + glucose group (OM + G group), myogenic induction + resveratrol group (OM + R group), myogenic induction + glucose + resveratrol group (OM + G + R group), and the myogenic induction + glucose + resveratrol + EX527 group (OM + G + R + EX527 group). The cells in the OM + G + R + EX527 group were pretreated with EX527 for 24 h. 9 Both glucose and resveratrol were added together with OM medium.
MTT Assay
Cells were treated as indicated for 72 h and then 20 μL MTT solution (5 g/L) was added to each well; cells were incubated for 4 h at 37 °C in 5% CO2. Next, the medium was removed and 100 μL of DMSO was added; the plate was shaken at room temperature for 10 min. The optical density values at a wavelength of 490 nm were measured on an imaging reader. The absorbance of non-treated cells was considered 100%, and viability results were expressed as percentages.
Measurement of Intracellular ROS Levels
Cells were treated according to the experimental grouping. DFCH-DA (20 μmol/L) diluted in serum-free medium was added to each well, and the plate was incubated at 37 °C for 30 min in the dark. The fluorescence intensity of each well was measured by a fluorescence microplate reader.
SOD Activity
Total protein was extracted from treated cells and the total protein concentration was determined with a BCA assay kit (Beyotime Institute of Biotechnology). The SOD activity was determined using a SOD detection kit. The assays were performed and the results were calculated following the manufacturers’ instructions.
Cell Cycle Analysis
Treated cells were collected and washed; pre-cooled ethanol (75%) was added to the cells, which were fixed at 4 °C overnight. The cells were then stained and evaluated by flow cytometry; approximately 2 to 3 million cells were counted. The results were analyzed using cell cycle fitting software (ModFit) (Verity Software House).
Immunofluorescence Detection
After 14 days of myogenic induction, cells were incubated with primary antibody for MyoD1 and Myogenin at 4 °C overnight. Cells were then incubated for 1 h at room temperature in the dark with a fluorescent secondary antibody. Cells were observed using a fluorescence microscope.
Western Blot
Total cellular protein was extracted from treated cells, and protein concentrations were determined with a BCA assay kit. Equal amounts of protein samples were mixed with loading buffer and the samples were heated at 100 °C for 5 min. Samples were then separated on 12% polyacrylamide gels and transferred onto polyvinylidene difluoride membranes. The membrane was blocked, followed by incubation with primary antibodies overnight at 4 °C and incubation with secondary antibody for 1 h. Signals were detected by an Imaging System and data were expressed as normalized ratios to GAPDH.
Statistical Analyses
All experiments were repeated at least 3 times independently. Statistical analysis was performed using SPSS 19.0 software (International Business Machines Corporation). Data, presented as mean ± standard deviation (mean ± SD), were evaluated with Student’s t-test between 2 groups, and one-way analysis of variance (one-way ANOVA) among the experimental groups. Dunnett's T3 and the least significant difference tests were used for two-group comparisons following inter-group comparison. All tests were two-tailed, and P values less than .05 were considered statistically significant.
Footnotes
Author's Contribution
LG designed the study. ML and LC carried out the experiments. XL analyzed the data. HW performed literature searches. ML, LC, and MW wrote and revised the manuscript. All authors read and approved the final manuscript.
Declaration of Conflicting Interests
The authors declared no potential conflicts of interest with respect to the research, authorship, and/or publication of this article.
Data Availability Statement
The datasets used and/or analyzed during the current study are available from the corresponding author upon reasonable request.
Ethical Approval
All animal experiments were approved by the Ethical Committee of the Second Affiliated Hospital of Harbin Medical University (KY2018-140).
Funding
The authors disclosed receipt of the following financial support for the research, authorship, and/or publication of this article: This work was supported by the Science and Technology Department of Heilongjiang Province and Second Affiliated Hospital of Harbin Medical University (grant numbers LC201007 and BS2010-12).
Statement of Human and Animal Rights
All procedures in this study were conducted in accordance with the Ethical Committee of the Second Affiliated Hospital of Harbin Medical University (KY2018-140) approved protocols.