
Abstract
Although tremetone [5-acetyl-2-(1-methylvinyl)-2,3-dihydrobenzofuran] has only one stereogenic center, the absolute configuration (AC) determination of its naturally occurring 11-acyloxy derivatives
Keywords
Introduction
Levorotatory 11-coumaryloxytremetone (
From our three lustrous vibrational circular dichroism (VCD) experience, accumulated since the first study
6
of alkaloids from plants of Chilean origin, through the years during which a few VCD reviews7,8 were put forward,
9
until current times,
10
it could be expected that the structural attributes of
Moreover, other naturally occurring compounds with a high conformational flexibility have also shown unexpected problems in their VCD studies, apparently related to their complex conformational distributions. This situation has encouraged us to develop
11
new computational tools that could aid in cases were widely used VCD methodologies fail. This effort rendered in the creation of a software named Vibrational Spectra Similarity and Analysis Tool (VISSAT), a group of computational tools that allows to conduct similarity calculations between observed and calculated IR/VCD spectra, as well as the search and optimization of different spectra parameters of interest. In the present study, we used VISSAT to conduct a very detailed stereochemical and conformational analysis of
In the present, predominantly computational work, some limitations of density functional theory (DFT) VCD calculations for AC assignments are highlighted. Considering that AC determinations by VCD are relevant mainly for pharmaceutical industry, where in many cases band analogy is invoked, and for natural products where unexpected molecules can still be found, the present forum for the publication of these results seems ideal.

Formulas of 11-acyloxytremetones.
Results and Discussion
A molecular model of (R)-11-coumaryloxytremetone (

Comparison of observed and calculated IR (lower traces) and vibrational circular dichroism (VCD) (upper traces) spectra of
Calculated frequencies, gained from the same calculations, were scaled with an anharmonicity or global scale factor (GSF) of 0.984, found as the optimal value for the maximization of the IR similarity index function (SIR),
12
which in turn showed only a modest matching value of around 0.85 (Table 1). Furthermore, comparison between calculated and observed VCD spectra using the enantiomeric similarity index (ESI),
13
which is the VCD similarity difference between the calculated isomer (SE) and its enantiomer (S−E),
12
showed a close to zero ESI value. The inclusion of conformers lying above the initial 2 kcal/mol limit into the conformational distribution produced nearly identical IR/VCD spectra and showed no improvement in the SIR and ESI values. These results suggest that the AC of
Similarity values
a
of Observed and Calculated IR (SIR) and vibrational circular dichroism (VCD) (SE–S−E = ESI) spectra of

SIR: IR spectral similarity; SE: VCD spectral similarity for the (R) enantiomer; S−E: VCD spectral similarity for the (S) enantiomer; ESI: enantiomeric similarity index (SE−S−E).
In an attempt to overcome this adverse situation, the molecular size of the studied tremetone derivative was reduced by chemical means, thereby reducing the molecular flexibility. Thus, the replacement of the p-hydroxycumaryl ester residue of
As in the case of
In attempts to improve these results, several combinations of DFT functionals and basis sets were tested for
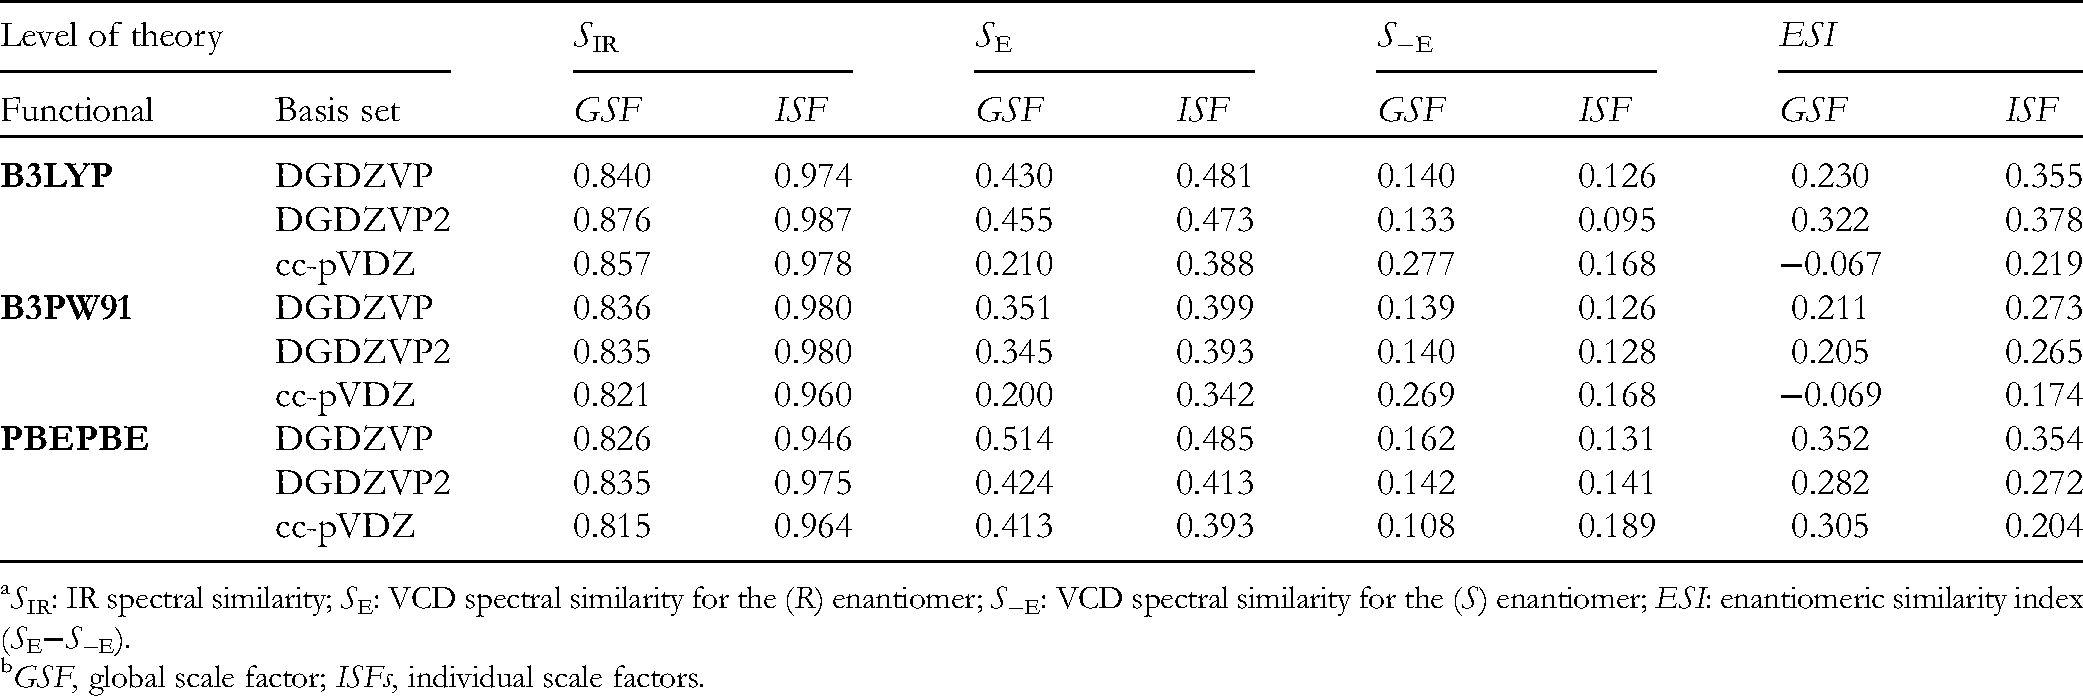
SIR: IR spectral similarity; SE: VCD spectral similarity for the (R) enantiomer; S−E: VCD spectral similarity for the (S) enantiomer; ESI: enantiomeric similarity index (SE−S−E).
GSF, global scale factor; ISFs, individual scale factors.
At this point, a search was started to find procedures that might improve the matching between theory and observation, and eventually explain the reasons why a widely used and successful methodology, like VCD, was not providing adequate results in cases like those studied herein.
First, the nonoptimal obtained SIR values suggest that calculated frequencies are not satisfactorily matching the experimental data. Since it was recently evidenced
11
that instead of using an anharmonicity (anH) factor,
13
which means a global scaling factor (GSF), calculated frequencies can be scaled more efficiently using individual scaling factors (ISFs) to generate an optimized SIR value, and eventually improve ESI values. To obtain these ISFs values, a sequential search algorithm was applied to the most abundant conformer, which is then used for all remaining conformers, thus yielding very high SIR values. This computational procedure, included in the recently created VISSAT software,
11
showed to be effective for the probe molecule 3-methylcyclopentanone,
11
but gave unsatisfactory results when it was applied to compound
Using this approach for
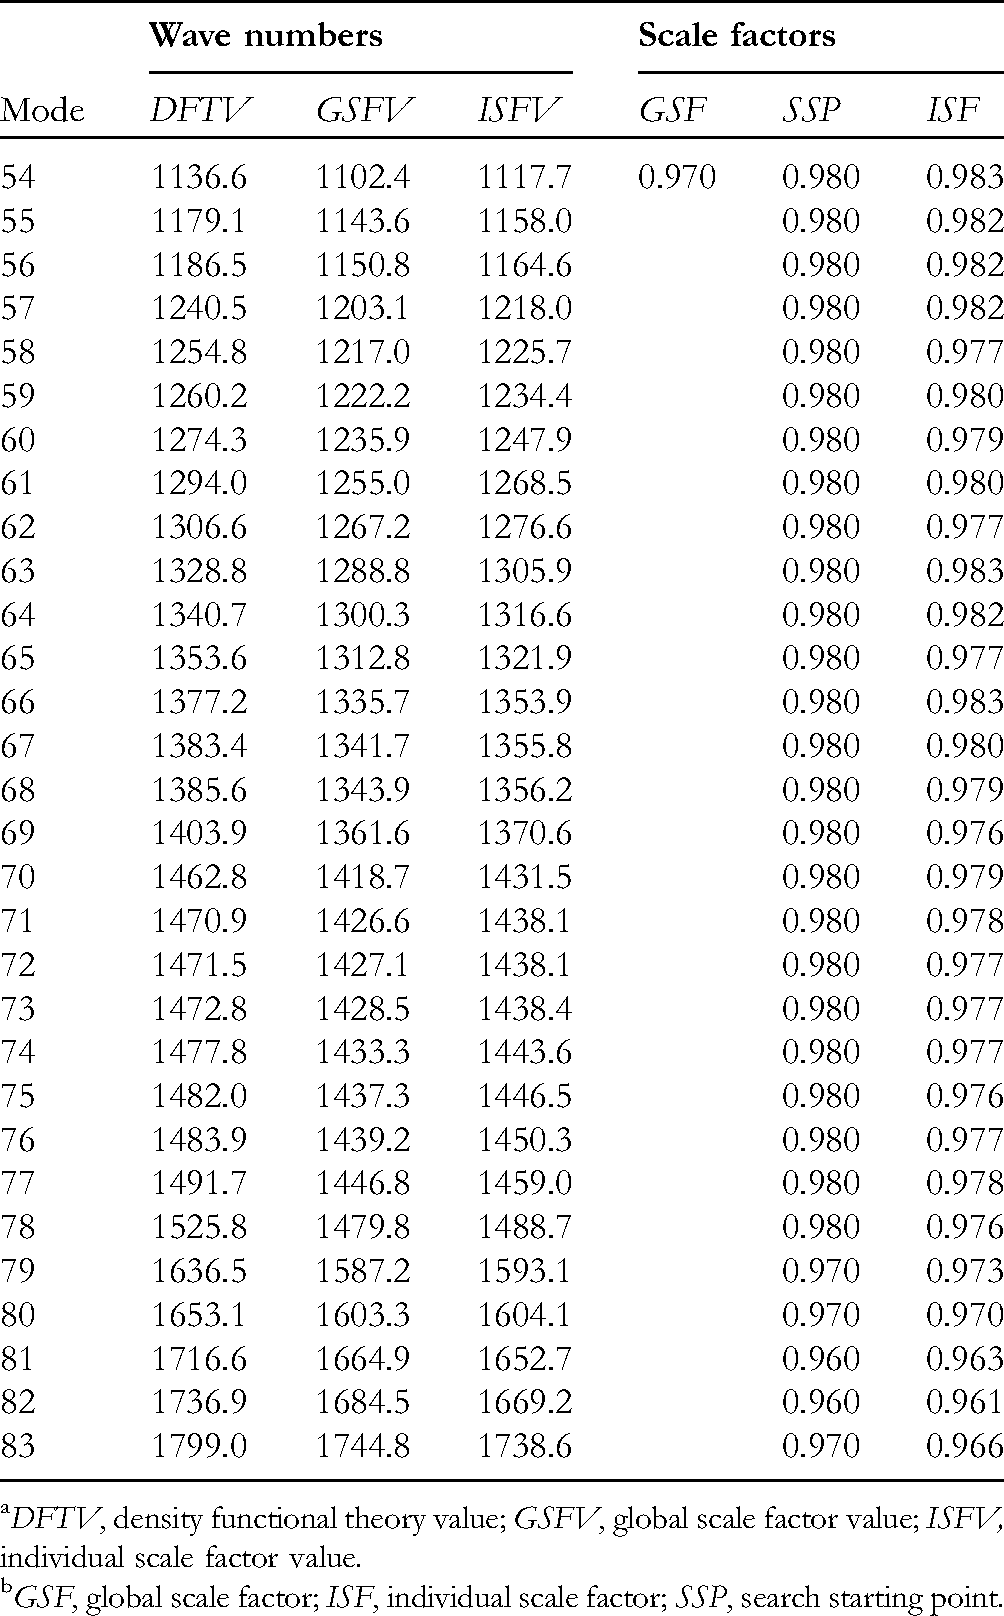
DFTV, density functional theory value; GSFV, global scale factor value; ISFV, individual scale factor value.
GSF, global scale factor; ISF, individual scale factor; SSP, search starting point.
These increments in similarity, particularly the high SIR value, suggest that the use of ISFs effectively reduces the negative effects produced by the inaccuracy of the calculated frequencies. Nevertheless, the still low obtained ESI value suggests the presence of other effects that are precluding the correct prediction of the VCD spectrum. From these, of high importance in flexible systems is the incorrect calculation of the conformational distribution abundances, which in turn can be the result of solvent effects not considered in a gas phase DFT calculation.
Consequently, in an attempt to further improve the VCD similarity, the recalculation of Gibbs free energies and vibrational parameters was performed for each conformation using the same level of theory, but this time using the polarizable continuum model (PCM) to include the solvent presence in the DFT calculations. In the case of the B3LYP/DGDZVP2 level of theory, the PCM framework inclusion resulted to be detrimental to the similarity between calculated and observed VCD spectra, with SIR and ESI similarity values of 0.987 and 0.309, respectively.
Considering the above result, it was decided to engage in a deeper analysis of the conformational preferences of

Abundances (upper trace), IR similarities (SIR) (central trace), and vibrational circular dichroism (VCD) enantiomeric selectivity indexes (ESI) (bottom trace) of each conformation of
From the mathematical standpoint of view, a weighted spectrum is a linear combination of the individual spectra produced by all possible conformers of a given compound, in which the contributions of each conformation depend on their relative stability. If these individual spectra are being correctly predicted by DFT calculations, and frequency shifts are being corrected to a high degree, it follows that spectra similarity will mostly depend on these individual contributions, which are commonly obtained from the same ab initio calculations. Nevertheless, it has been shown that DFT calculated thermochemical parameters can show significant errors, 14 even when high-end levels of theory and very dense integral grids are used. 15 Such errors appear to be particularly troublesome in highly flexible compounds, were the appearance of low-frequency vibrational modes (5-50 cm−1) produce severe errors in the computed entropy contributions to the Gibbs free energies. 16 These low energy modes, that can be characterized as internal rotations of functional groups, rather than as molecular vibrations, could be the main source of the difficulties found herein and in other cases.17–19
Alternatively, applying the same principle used by VISSAT to obtain a set of ISF values that maximizes IR similarity, it is also possible to search for the optimal linear combination that maximizes similarity between observed and calculated VCD spectra. Since enantiomers produce antipode VCD spectra, the searches need to be performed independently for each enantiomer, producing separated similarity values for the (R) and the (S) enantiomer. With this idea in mind, an iterative optimization algorithm that uses the DFT relative abundances as starting points was implemented in the VISSAT software to search for new conformational distribution sets that maximize VCD similarity. These procedures were performed using the ISF scaled frequencies, with their corresponding dipole and rotational strengths, calculated at the B3LYP/DGDZVP2 level of theory for each conformer of
At first glance, these results seem to suggest that the entire conformational set is needed to produce a weighted VCD spectrum having high similarity with the observed spectrum. However, the computational algorithm will use the best available spectra combination from a given set, even when it is possible that other combinations, composed by more stable conformers, as determined by DFT free energies, could also have high similarities. To test this, VCD-guided conformational distributions, using progressively smaller conformer sets were obtained by decreasing the energy threshold of each distribution and calculating the corresponding similarity values. As shown in Figure 4, several interesting features appear when ESI values are correlated with the considered conformational energy window. First, the contraction of the conformational pool tends to have a detrimental effect over the final similarity obtained for each conformational distribution, and remains high with a small decrease below 1.5 kcal/mol. This is in line with previous observations made in the VCD study of catechin and epicatechin peracetates, 20 where consideration of conformers above this energy threshold appears to be unnecessary to allow a good prediction of the conformational distribution. Furthermore, the preference toward the (R) enantiomer is a constant throughout the energy window, pointing toward this as the correct AC

Vibrational circular dichroism (VCD) enantiomeric selectivity indexes (ESI) of
When only the most stable conformational distributions are constructed using restricted energy windows, like those on the left-hand side of the graph, positive or very small negative ESI values are obtained for the S-guided distributions, while ESI values above 0.5 are observed for the R-guided counterparts. Since these conformations correspond to the most stable conformers, this suggests that these calculations are roughly predicting the group of most abundant conformations, although not accurately enough to properly predict their abundances.
The general analysis used for the smaller acetate

Abundances (upper trace), IR similarities (SIR) (central trace), and vibrational circular dichroism (VCD) enantiomeric selectivity indexes (ESI) (bottom trace) of each conformation of

Vibrational circular dichroism (VCD) enantiomeric selectivity indexes (ESI) of
As shown in Figure 7, a VCD-guided conformational distribution produced highly similar IR and VCD spectra when compared with the corresponding observed spectra, that in turn contrast with their free energy counterparts (Figure 2), clearly suggesting the incapacity of the DFT calculations to predict correct conformational abundances.

Comparison of observed and calculated IR (lower traces) and vibrational circular dichroism (VCD) (upper traces) spectra of
It is of relevance to note that the VCD spectra of
As already mentioned in the introduction, some limitations of DFT VCD calculations for AC assignments are highlighted. It is just of further relevance to mention that they are in line with other natural products cases like perezone17,18 and guaiaretic acid diacetate. 19
Although a single-crystal XRD study of 11-coumaryloxytremetone (

PLUTO plot of the x-ray crystal structure of 11-coumaryloxytremetone (
Once some limitations of classical DFT VCD calculations to determine the AC of
Conclusions
Albeit the AC determination of 11-coumaryloxytremetone (
Experimental Section
11-Acyloxytremetones
Pure 11-coumaryloxytremetone (
VCD Measurements
Samples of 6.5 mg of
Vibrational Circular Dichroism Calculations
Monte Carlo conformational searches for
Single-Crystal x-ray Diffraction Study of 11-Coumaryloxytremetone (1)
Suitable colorless crystals of (
Footnotes
Acknowledgments
The authors thank partial financial support from CONACYT-Mexico grant 284194 and FONDECYT-Chile grant 1220075.
Declaration of Conflicting Interests
The author(s) declared no potential conflicts of interest with respect to the research, authorship, and/or publication of this article.
Funding
The author(s) disclosed receipt of the following financial support for the research, authorship, and/or publication of this article: This work was supported by the Consejo Nacional de Ciencia y Tecnología (grant number 284194) and the Fondo Nacional de Desarrollo Científico y Tecnológico (grant number 1220075).
Ethical Approval
Ethical approval is not applicable for this article.
Statement of Human and Animal Rights
This article does not contain any study with human or animal subjects.
Statement of Informed Consent
There are no human subjects in this article and informed consent is not applicable.
Trial Registration
Not applicable, because this article does not contain any clinical trials.