
Abstract
The phytopathogen Fusarium oxysporum produces considerable losses in economically important crops, making alternative control measures urgently required. Piper plants are widely distributed in tropical regions, and they are also known to produce metabolites with biological activity against infectious agents. As part of our continuous search for antifungals, 18 Piper-derived ethanolic extracts were evaluated by their in vitro effect on F oxysporum mycelial growth inhibition. The total content of phenol and flavonoid measurements and liquid chromatography-electrospray ionization-mass spectrometry analysis served as the chemical characterization of the investigated extracts. Piper pulchrum, Piper barcoense, and Piper tuberculatum exhibited the highest mycelial growth inhibition (>74%). The integration of chemical fingerprints and bioactivity datasets led to recognizing 4 bioactive candidates among extracts through single-Y orthogonal partial least squares regression and univariate statistics. These candidates were 2 amides (
Introduction
The Piperaceae family comprises many basal angiosperms in different habitats such as grasses, shrubs, lianas, epiphytes, and medium-sized trees. 1 This family is classified in the Piperales order along with the families Aristolochiaceae, Hydnoraceae, Lactoridaceae, Piperaceae, Asaraceae, and Saururaceae. 2 Within the Piperaceae family, ca. 3500 species have been described, which are widely distributed in tropical regions, 3 having its center of origin in Peninsular Malaysia and a broad dispersion in the American tropics. 4 From this plant family, the Piper genus is highly representative due to the high number of species (ca. 2172) 3 and the exciting chemodiversity and biological activities reported for several Piper plants. 5 In this regard, the bioactivities exhibited by Piper-derived end-products (ie, extracts, essential oils, and isolated phytochemicals) have a broad outlook. However, the antibacterial and antifungal activities against human and plant pathogens can be highlighted. 6 In the last few decades, several studies have been oriented to scrutinize the antifungal potential of Piper-derived end-products, involving various metabolite classes such as flavonoids, amides, butenolides, piperolides, lignans, phenylpropanoids, prenylated benzoic acid derivatives, and alk(en)ylphenols, among others. 7 Indeed, some of these compounds exhibited relevant activities against different fungal pathogens, having promising potential to be used as lead compounds for antifungal development. 7 Therefore, Piper species can be considered an excellent source of antifungals and, consequently, several of them remain to be explored.8,9
A critical current fungal-related problem concerns Fusarium oxysporum, a phytopathogen that infects and negatively affects above 100 crop plants worldwide and even humans. 10 Therefore, various strategies based on physical, biological, and/or chemical actions have been implemented to control this fungus. 11 However, chemical control is mainly used. Still, the uncontrolled and nonprotocolized exposure of fungicidal agents in crops has generated various problematic issues, such as environmental and health risks and the emergence of F oxysporum resistant strains to different commercially available treatments commonly used in medicine and agriculture. 12 For these reasons, it is still necessary to search for alternatives against F oxysporum, involving the most negligible impact on human health, other surrounding species, and the environment, and comprising the highest efficiency.
An alternative route for controlling this phytopathogen is oriented to naturally occurring compounds from plants, 13 particularly Piper species. 7 Bio-guided fractionation is the most employed approach to identifying active components within a bioactive plant-derived extract or fraction, but this practice is time-consuming and expensive. 14 Other approaches have recently emerged to overcome these disadvantages, such as statistically- based integration to recognize chemical/bioactivity-related patterns. 15 This (un)targeted metabolomics-based strategy associates both biological and chemical datasets to disclose putatively bioactive compounds within plant mixtures, which can be subsequently selected for isolation. 16 In fact, we focus our interest on Piper species because, in a previous study, 2 Piper plants were the most-active extracts within a group of 44 botanical extracts. 17 Hence, as part of our research on naturally occurring antifungals, a set of 18 Piper-derived extracts were assessed against F oxysporum. The mycelial growth inhibition (MGI) was then measured using a microscale amended medium assay and statistically associated with mass spectrometry (MS)-based chemical composition. Hence, antifungal bioactive compounds were recognized and identified using this integration.
Results and Discussion
Antifungal Activity of Piper-Derived Extracts
The MGI percentages of the set of extracts (n = 18) obtained from leaves and stems of each Piper plant (n = 9), evaluated using an extract concentration of 0.1% (w/v), are presented in Table 1. The investigated extracts showed antifungal activity against F oxysporum at different levels, indicating that these Piper plants can be a source of antifungals. 7 The MGI ranged from 24.4% to 89.0%, involving an average of 50.9% and a median of 48.8%, whereas positive controls (mancozeb and prochloraz) exhibited MGI values of 97.3% and 93.8%, respectively. The post hoc Tukey test classified the extract population through multiple comparisons. This classification found that those MGI averages were significantly different from each other (p < .05). Thus, the most-active extracts were found forming the significantly different groups A to E (MGI > 60%). These groups comprised extracts from Piper pulchrum leaves and stems (PpL and PpS), Piper barcoense leaves and stems (PbaL and PbaS), Piper tuberculatum leaves and stems (PtL and PtS), and Piper hispidum stems (PhS). The most-active extracts were PpS and PbaL (MGI > 80%), whereas the least-active ones were Piper marginatum leaves and stems (PmL and PmS), Piper bogotense stems (PboS), and Piper crassinervium leaves (PcL) (MGI < 30%).
MGI, Yields, and TPC and TFC, respectively, of Piper-Derived Extracts.
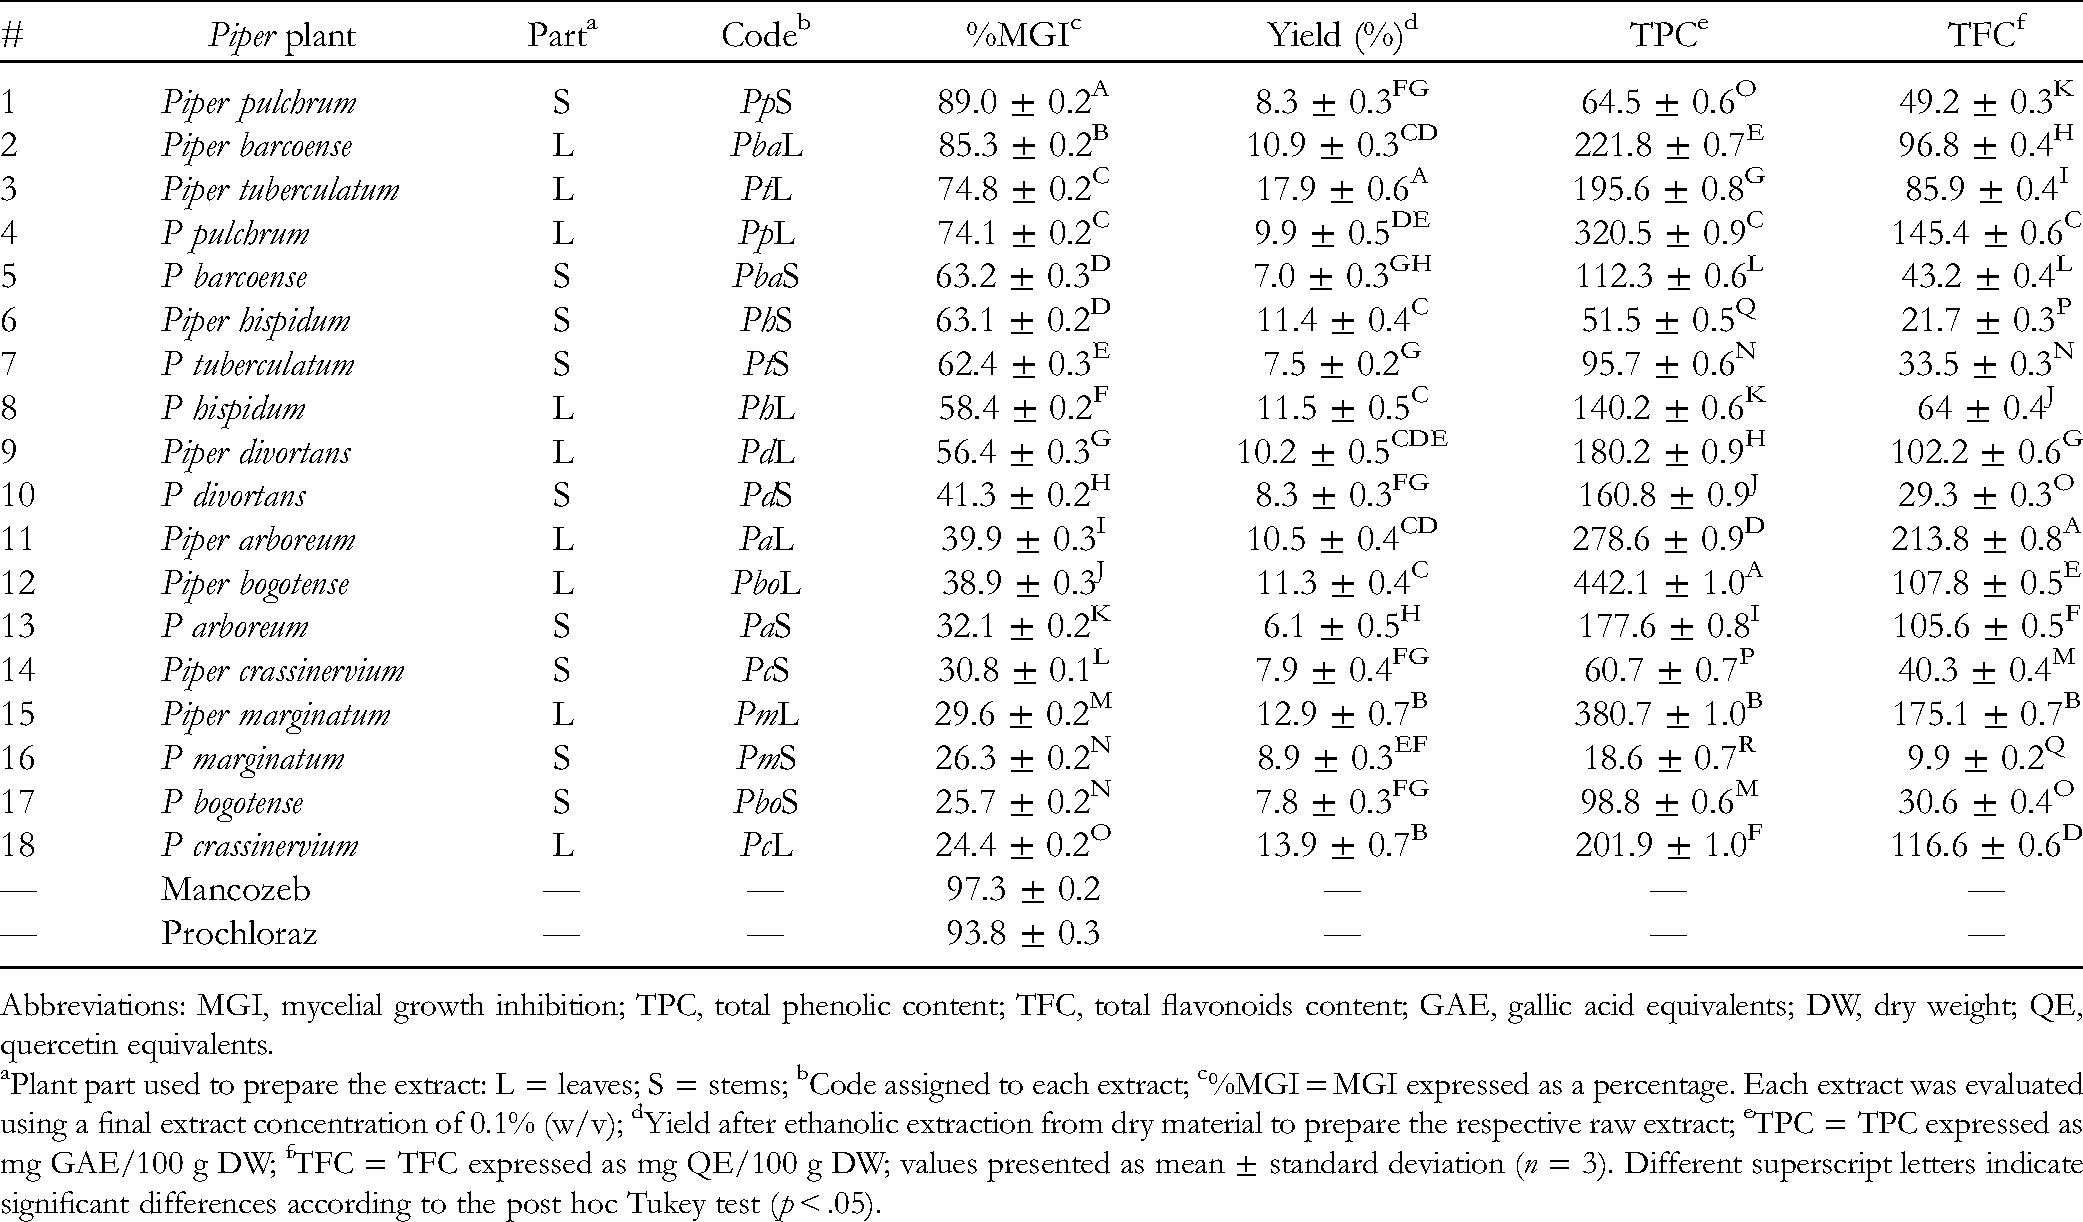
Abbreviations: MGI, mycelial growth inhibition; TPC, total phenolic content; TFC, total flavonoids content; GAE, gallic acid equivalents; DW, dry weight; QE, quercetin equivalents.
Plant part used to prepare the extract: L = leaves; S = stems; bCode assigned to each extract; c%MGI = MGI expressed as a percentage. Each extract was evaluated using a final extract concentration of 0.1% (w/v); dYield after ethanolic extraction from dry material to prepare the respective raw extract; eTPC = TPC expressed as mg GAE/100 g DW; fTFC = TFC expressed as mg QE/100 g DW; values presented as mean ± standard deviation (n = 3). Different superscript letters indicate significant differences according to the post hoc Tukey test (p < .05).
None of the investigated extracts have been previously studied for bioactivity against F oxysporum mycelial growth. In addition, P pulchrum and P barcoense have no previous antifungal studies. However, P tuberculatum and P hispidum have been described as a source of antifungal amides, whose bioactivity against Cladosporium sphaerospermum by thin-layer chromatography (TLC)-mediated direct bioautography was evaluated, affording minimal inhibitory amounts between 0.1 and 8.0 µg.18,19 Similarly, amides from Piper arboreum were active against Cladosporium cladosporioides and C sphaerospermum. 20 P crassinervium against the fungi above, through a bioautography-based bio-guided fractionation, was also studied, and 3 prenylated hydroquinones, a benzoic acid derivative, and 2 known flavanones were isolated as antifungal metabolites.21,22 However, we found that P arboreum and P crassinervium exhibited low inhibitory capacity on the mycelial growth of F oxysporum (MGI < 40%). On the other hand, the essential oils of several Piper plants (including P tuberculatum, P hispidum, P bogotense, and P marginatum) were evaluated against F oxysporum conidia through microdilution, obtaining minimal inhibitory concentrations ≥500 µg/mL. 23
Yields, and Total Phenolic and Flavonoid Contents of Piper-Derived Extracts
The materials from the Piper plants yielded raw ethanolic extracts at different levels (Table 1). In general, leaves afforded higher yields than stems. In this regard, leaves of P tuberculatum, P marginatum, and P bogotense exhibited the highest yields (>11%). In contrast, the lowest yields were obtained from the stems of P arboreum, P barcoense, and P tuberculatum (<7.5%). No relationship was found between yields and MGI. On the other hand, extracts were also characterized by measuring their total phenolic and total flavonoid contents (TPC and TFC, respectively). The resulting values are presented in Table 1. Leaf extracts generally showed higher TPC and TFC than those of the stems (mean TPC for leaves = 262.4 ± 100.9 mg gallic acid equivalents [GAE]/100 g dry weight [DW], mean TPC for stems = 93.4 ± 51.6 mg GAE/100 g DW). Hence, leaf extracts from P bogotense, P marginatum, and P pulchrum exhibited the highest values (TPC > 320 mg GAE/100 g DW). In contrast, stem extracts from P crassinervium, P hispidum, and P marginatum showed the lowest contents (TPC < 61 mg GAE/100 g DW).
In the case of TFC, leaf extracts also exhibited higher values than stems (mean TFC for leaves = 123.1 ± 47.0 mg quercetin equivalents [QE]/100 g DW, mean TFC for stems = 40.4 ± 27.1 mg QE/100 g DW). The highest TFC values were shown by leaf extracts of P arboretum, P marginatum, and P pulchrum (TFC > 145 mg QE/100 g DW), while stem-derived extracts from Piper divortans, P hispidum, and P marginatum showed the lowest values (TFC < 29.3 mg QE/100 g DW). These total contents are in agreement with previous studies measuring TPC and TFC for different Piper plants, whose respective values resulted in ranges of 30 to 860 mg GAE/100 g DW and 20 to 440 mg QE/100 g DW, respectively, for different types of extracts of Piper nigrum, Piper auritum, Piper betle, Piper betleoides, and Piper wallichii.24‐26 Considering that phenolics (eg, benzoic acid derivatives and prenylated hydroquinones) and flavonoids (eg, flavones and chalcones) are often reported as antifungals, 7 the linear relationship between MGI with TPC and TFC was further studied (Figure 1). However, no clear correlation was found (Pearson's correlation coefficient <0.3), indicating that the global set of phenolics or flavonoids is not associated with the inhibitory activity shown by the whole set of extracts and, therefore, certain metabolites should be responsible for the observed bioactivity that deserve to be explored. Thus, an liquid chromatography (LC)-MS-based chemical characterization of the Piper extracts was then performed.

Correlation between %MGI with TPC and TFC, respectively, of extracts from Piper plants. TPC and TFC are depicted as green circles and blue squares, respectively. TPC is expressed as mg GAE/100 g DW and TFC as mg QE/100 g DW.
Characterization Based on LC-Electrospray Ionization-MS Data of Piper Extracts
The 18 extracts of Piper plants were analyzed by reverse-phase LC coupled to MS using electrospray ionization (RP-LC-ESI-MS). This analysis led to expanding their chemical characterization. Thus, the resulting raw data were used to retrieve the entire set of m/z features per extract and compiled into a matrix to build the feature intensity table (FIT). Once this compilation was achieved, 4947 features were gathered from the 18 extracts, suggesting a considerable chemodiversity. In this sense, several features (ie, metabolites) were shared between extracts of the same species and extracts from different plant parts of other species, with varying intensity. In contrast, other features were found to be unique for particular extracts. A heat map-based intuitive visualization is presented in Figure 2 to illustrate the mentioned MS-based chemical distribution.
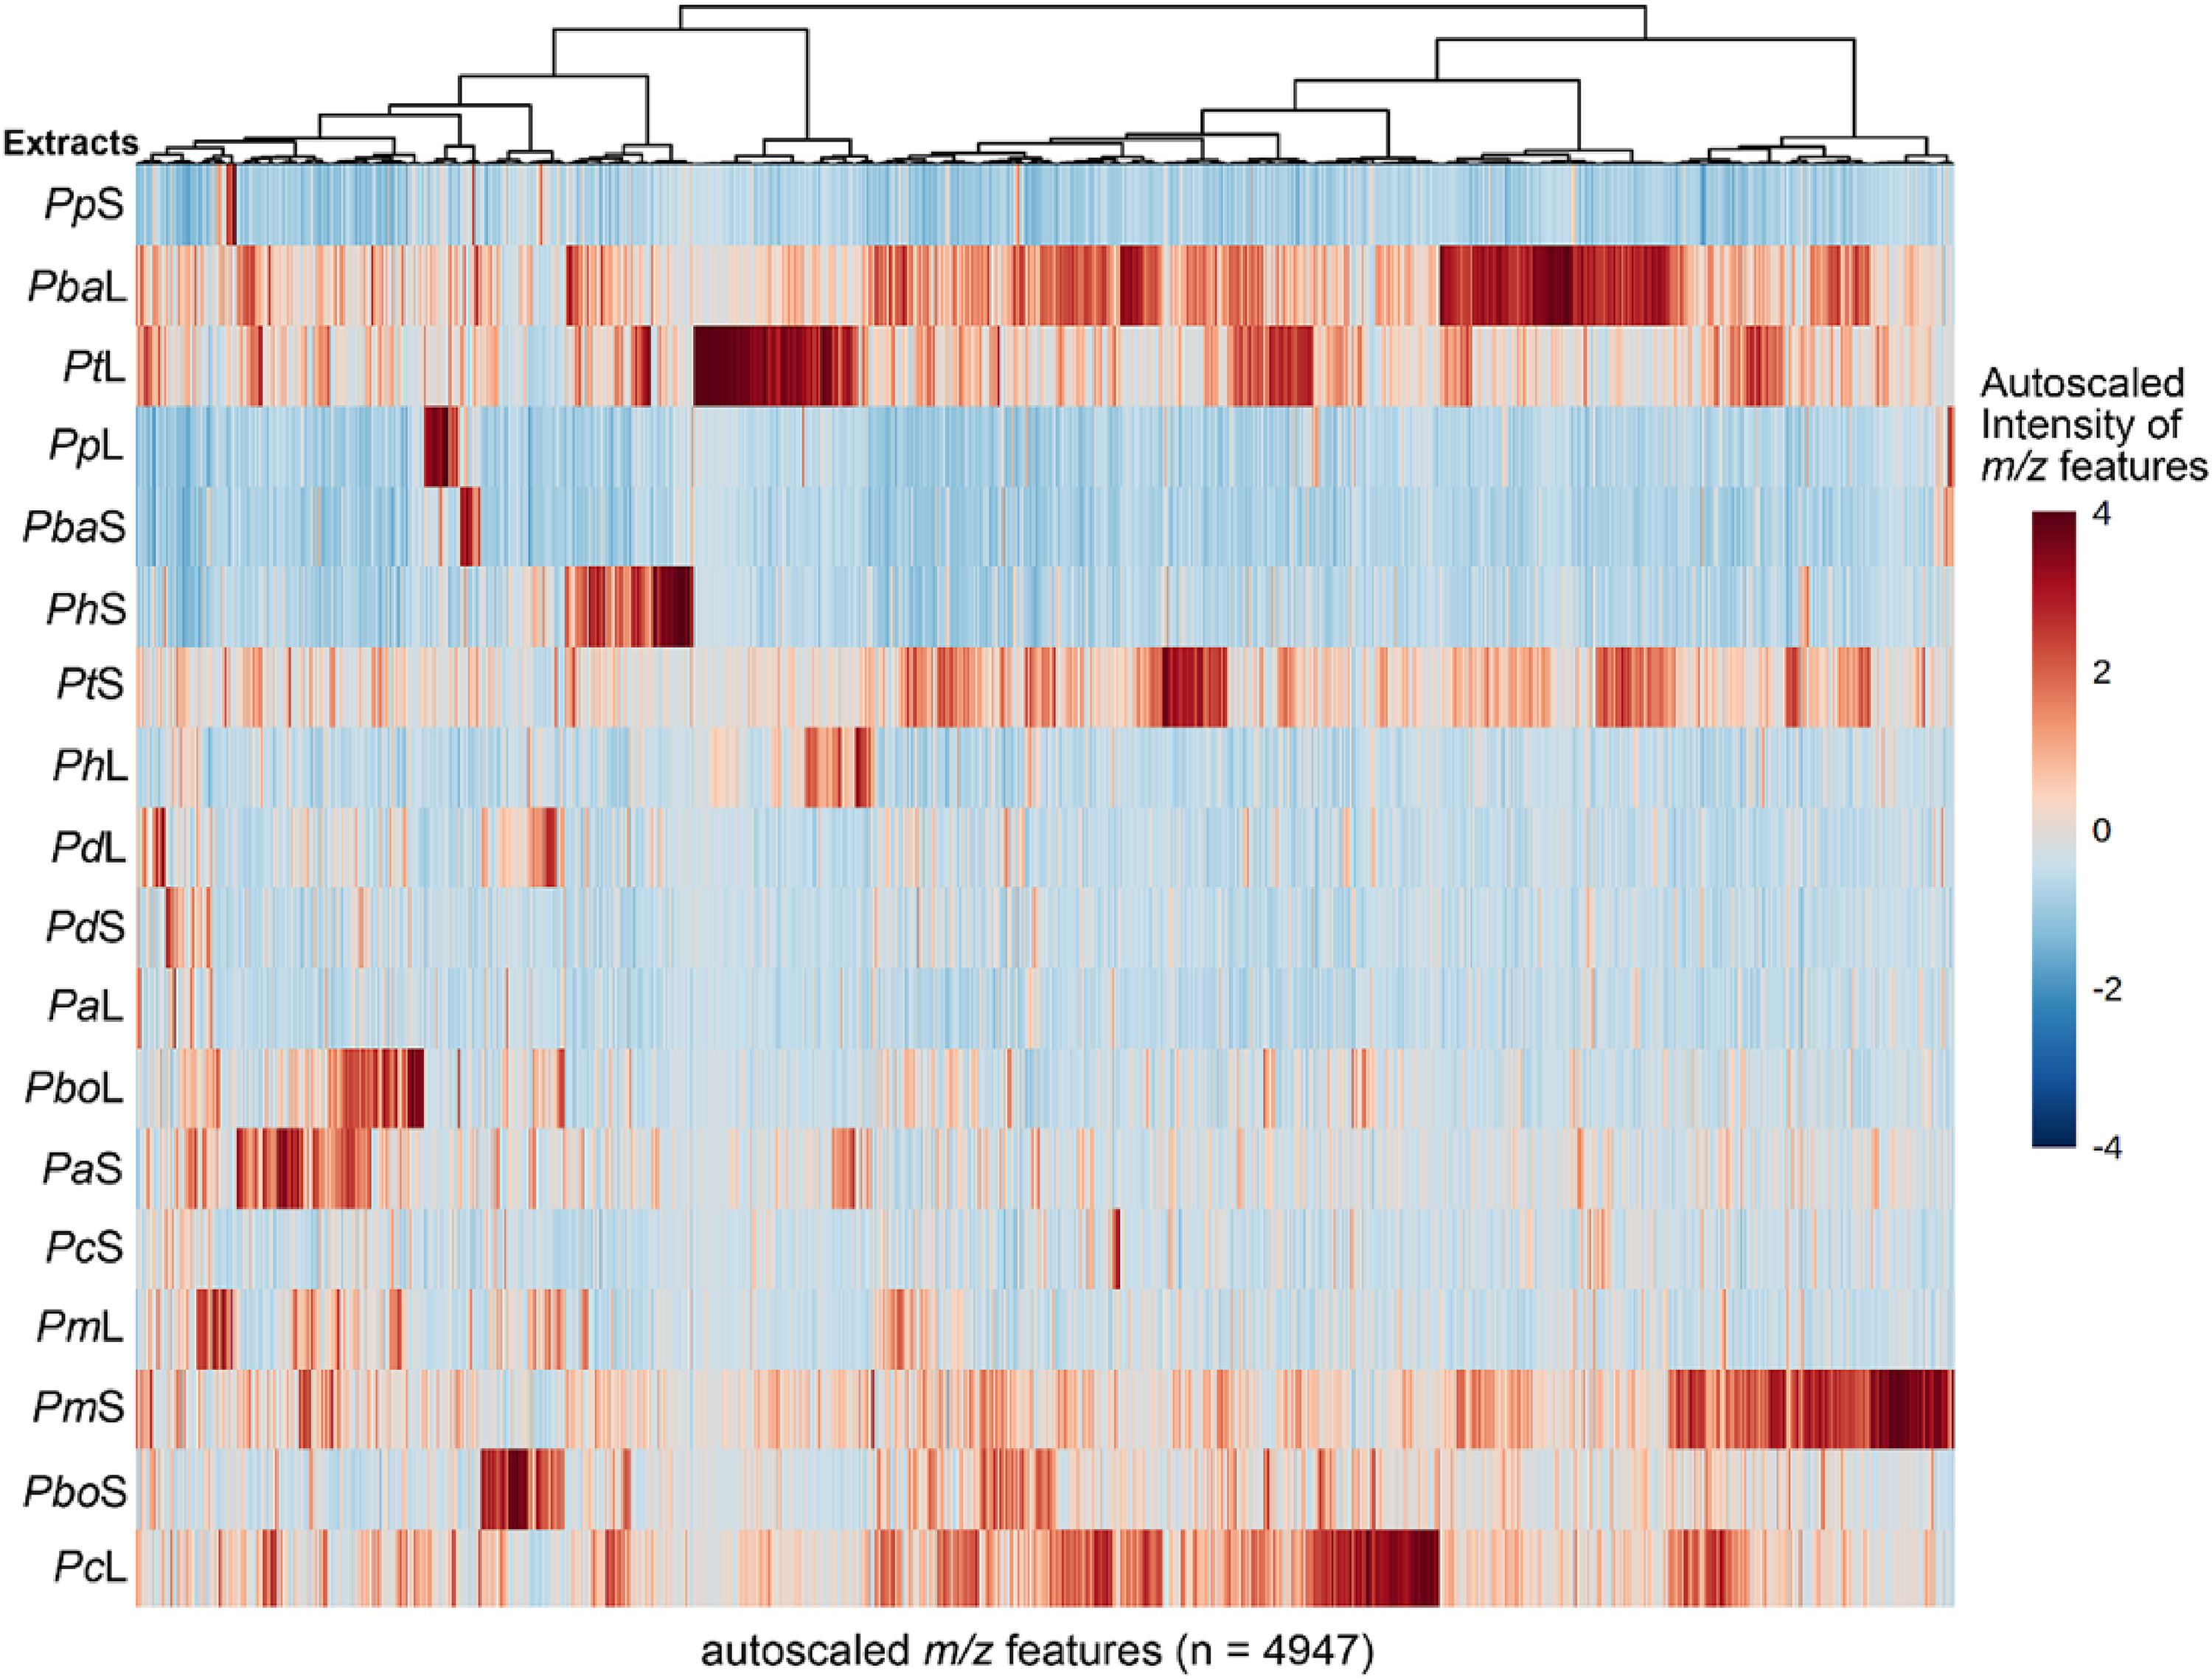
Distribution of the intensity of the m/z features detected in extracts of Piper plants (n = 18) after analysis through reverse-phase liquid chromatography coupled to mass spectrometry using electrospray ionization (RP-LC-ESI-MS). The heat map is organized by rows for each extract, using the codes presented in Table 1. Each colored cell was associated with an autoscaled (scaled to unit variance, prior heatmap generation) intensity of each detected m/z feature, depending on the color scale (dark red: high intensity; dark blue: low intensity).
After scaling the features to unit variance (ie, autoscaling), the metabolite richness of some extracts could be evidenced. Hence, leaves of Piper barbatum, P tuberculatum, and P crassinervium and stems of P tuberculatum, P marginatum, and P bogotense exhibited the highest number of metabolites with higher abundance (Figure 2). However, such abundant metabolites are not often shared between these extracts. In addition, apparent differences between plant parts of the same Piper species were also evidenced, indicating tissue-specific chemical profiles observed previously in other reported Piper species, eg, Piper methysticum or Piper gaudichaudianum.27,28 Remarkably, the most-active extracts, such as PpL, PpS, PbaS, and PhS, exhibited fewer abundant metabolites, suggesting that these extracts contained particular metabolites possibly responsible for the activity. In contrast, other active extracts, ie, PtL and PtS, exhibited abundant metabolite-rich chemical profiles. Based on these facts, to focus the efforts on identifying antifungal compounds, it was decided to integrate statistically the MS-based chemical dataset of each extract with the respective antifungal activity.
Detection of Antifungal Candidates From Piper Species Through the Integration of Chemical Fingerprints and Bioactivity Datasets
The LC-MS-based chemical composition and MGI-based antifungal activity datasets were then integrated through supervised statistics to distinguish plausible antifungal compounds within Piper plants. Thus, a first statistical analysis integrated the plant chemical composition and the bioactivity of extracts through a single-Y orthogonal partial least squares (OPLS) regression (using MGI as continuous Y variable). The resulting statistical OPLS model, comprising one predictive score (t[1]) and one orthogonal component (to[1]), could discriminate extracts based on antifungal activity (Y-data) and chemical composition (X-data), revealing a reasonable explained variance, ie, R2X = 0.85, R2Y = 0.79, and predictability, ie, Q2Y = 0.62. In this sense, the OPLS-derived scores plot (Figure 3A) revealed the respective discrimination mode of Piper extracts, explaining the variance according to the MGI activity (45.3% along t[1]) and chemical composition (39.7% along to[1]), respectively. This 2-dataset pattern recognition was very relevant for our purpose since the scores plot exposed those extracts grouped by chemical composition and conditioned by the MGI activity. A color scale (20%-100% scaling) depicts the antifungal-dependent discrimination between high (green) and low (red) MGI values as a key trend. In this regard, the most-active extracts were right-side located in the scores plot, but had distinct profiles since they were highly dispersed, while the least-active extracts exhibited a lower dispersion. This fact suggested that the most-active extracts might have particular compounds responsible for the observed antifungal action. Therefore, the predictive component loadings were examined using an S-plot transformation to discriminate the differential variables’ relative importance and facilitate model interpretation. The S-plot (a p[1] × p(corr)[1] scatter plot taking the letter “S” shape using Pareto and centering scaling) provided visualization of both the covariance and the correlation structure among the X-data and t[1].
29
Consequently, the most relevant differences between least-active (p[t1] < 0) and most-active (p[t1] > 0) extracts were evidenced through those features situated far out of each wing, indicating high model influence with high reliability (Figure 2B). After this transformation, 4 features (numbered as

Integration of chromatographic data and Fusarium oxysporum mycelial inhibition datasets of Piper extracts by single-Y OPLS. %MGI was used as a continuous Y-variable depicted as a color scale (green = high value; red = low value).
The statistical performance of this S-plot-based recognition of compounds

Selection of top-ranked features by volcano plot (
The previous results indicated that our aim of integrating the chemical composition and the antifungal activity datasets could be successfully achieved through single-Y OPLS for pattern recognition. The covariance maximization of independent variables (ie, discriminating features) regarding a continuous or categorical dependent variable (ie, antifungal activity) can be adequately achieved by supervised methods such as OPLS or partial least squares,
30
which diverges from principal component analysis (PCA) since it cannot maximize the independent variable covariance. Therefore, PCA was not employed as a first-line analysis, as commonly used. In addition, the relevant fact about the utility of single-Y OPLS is the use of a continuous variable. It is more advantageous than data-derived categorical variables because much information is lost. It is often tricky to identify the cutoff point and even the objective function to define the extent of the categories.
31
Consequently, it is preferable to keep continuous variables instead of categorizing them to explore the integration of metabolite/bioactivity datasets.
32
In this regard, metabolite profiling has increasingly been employed to associate the metabolite fingerprints and the biological activity of mixtures of natural origin. The main advantage of this approach is the use of chemical fingerprints as the source of independent variables to be integrated with a dependent variable.
33
In addition, the main challenge during fractionation procedures is overcome since this integration can also recognize unstable compounds.
34
Therefore, once the bioactive candidates are statistically predicted, they must be depurated or isolated to validate the correlative differentiation.
34
In this regard, the targeted isolation of
Isolation and Identification of Antifungal Candidates
The chemical fingerprints and bioactivity integration distinguished compounds

Structures of isolated compounds after statistical pattern recognition.
The antifungal activity of the isolated compounds was then evaluated against F oxysporum, and their resulting IC50 values are listed in Table 2. Compound
Antifungal Activity of Isolated Compounds from Piper species.

Half-maximal inhibitory concentration (IC50 in μM) on Fusarium oxysporum mycelial growth. Data are expressed as best-fit value of IC50 after nonlinear regression.b95% confidence interval (CI) (n = 4). cPositive controls: P = prochloraz; M = mancozeb.
To the best of our knowledge, compounds
Conclusions
The present study constitutes the first endeavor to evaluate the inhibitory capacity of the studied Piper-derived extracts (n = 18) on F oxysporum mycelial growth. Four Piper-derived extracts (PpS, PbaL, PtL, and PpL) showed the best inhibitory activity on F oxysporum mycelial growth (MGI > 74%) among the botanical extracts tested (n = 18). The observed antifungal activity of extracts exhibited no relationship with the respective TPC or TFC values. On the other hand, the indirect detection of plausible antifungal candidates through metabolic profiling by associating the fingerprints and the antifungal activity datasets led to the recognition of the 4 metabolites 8,9-dihydropiplartine (
Materials and Methods
Plant Material and Preparation of Extracts
Leaves and stems of 9 Piper species (P arboreum Aubl., P barcoense Yunck., P bogotense C.DC., P crassinervium Kunth, P divortans Trel. & Yunck., P hispidum Sw., P marginatum Jacq., P pulchrum C. DC., and P tuberculatum Jacq.) were collected in Meta, Casanare, and Cundinamarca, Colombia (coordinates 3.543, −73.669; 5.190, −72.547; 4.931, −74.008, respectively) between 2015 and 2017. Voucher specimens are kept at Colombian National Herbarium. The selected healthy plant materials (without visible damage) were separately air-dried and extracted using 96% ethanol at a constant shaking speed (120 rpm) using a Heidolph Rotamax 120 platform orbital shaker (Heidolph Instruments GmbH & Co. KG). The extraction lasted 1 week with daily removal of the extract-containing solvent and replacement by fresh 96% ethanol. These mixtures were separated by filtration. The resulting solution was concentrated by distillation under reduced pressure at 40 °C using an IKA RV 10 Control rotary evaporator (IKA® RV 10, IKA® Werke GmbH & Co. KG) to afford the crude extracts. The resulting extracts from each plant from each daily extraction were collected, dried, and subsequently stored at −20 °C until use.
In Vitro Bioassay Against F Oxysporum
F oxysporum LQB-03, a virulent isolate obtained from wilting Physalis peruviana plants, was used as the assessed phytopathogen.
43
This isolate had been preserved on Whatman paper # 1 at −20 °C and further reactivated in potato dextrose agar (PDA) to be used in the present antifungal assays. The in vitro antifungal activity against F oxysporum was evaluated by inhibiting mycelial growth (12-well plate amended semisolid medium assay). The assay was performed using the respective monosporic culture of the fungal isolate, developed in a PDA medium for 8 days. A microscale amended medium protocol was performed following the previously reported procedure.
44
Briefly, 12-well plates (autoclavable glass), semisolid medium (1.2 g of potato-dextrose broth, and 0.5 g of agar per 100 mL of distilled water) were used. The final volume (for treatments and controls) was 200 μL per well (1 cm diameter). The concentration (ie, 0.1% w/v) was prepared by supplementing the fresh semisolid medium with the required amount of each dry, crude extract (n = 18). A stock dispersion was reached by a direct mixture between the semisolid medium (5 mL) and the required extract (5 mg). This mixture was vigorously stirred until achieving a homogenous dispersion before solidifying. Tween-20 (5%) was used to assist the dispersion of the extracts. The resulting homogeneously amended medium was added into 3 wells of the 12-well plate. Subsequently, a 1 mm agar-mycelial plug from 5 days actively growing cultures of F oxysporum was inoculated onto the center of each well. Each 12-well plate was placed into a 17 mm Petri dish, under the appropriate conditions of humidity and sterility, and sealed with plastic films. Each trial comprised a randomized design with 3 replicates for each extract compared to an absolute control (untreated semisolid medium). Sportak (prochloraz) and Dithane (mancozeb) were employed as positive controls using the same concentration (ie, 0.1% w/v). After inoculation and sealing, this assembly was incubated at 25 °C. Once the colony on the negative control had covered the whole well (after ca. 48 h), the mean colony area (mm2) was measured for treated and untreated wells by processing with software Image J® using photographic records. The percent of MGI was calculated for each replicate. This calculation was made employing the equation: % MGI = [(absolute control area − treatment area)/absolute control area)] × 100. In the case of pure compounds
TPC and TFC
The TPC and TFC were measured following the previous protocols. 45 In the case of TPC, the extract solution (20 µL, 5 mg/mL) was combined with 10% Folin-Ciocalteu reagent (40 µL) and 7.35% sodium carbonate solution (150 µL). The mixture was incubated under darkness at room temperature for 2 h, and the absorbance of the solutions at 765 nm was then measured. For TFC, an aliquot of ethanolic extract solution (70 µL, 5 mg/mL) was added to a mixture comprising ethanol (50 µL), 10% aluminum trichloride (10 µL), and 0.1 M sodium acetate (10 µL). Subsequently, the mixture was reacted for 40 min under darkness, and finally, its absorbance at 420 nm was measured. Three replicates were evaluated for each determination. A quantitation through a standard curve of gallic acid and quercetin was employed, respectively. Therefore, the TPC was expressed as mg GAE/100 g DW, and TFC was expressed as mg QE/100 g DW.
High-Performance LC Coupled to MS
Metabolite profiles of test extracts were recorded on a Shimadzu Prominence (Shimadzu Corporation) equipped with 2 binary pumps, an autoinjector, a photodiode array detector, and an LCMS2020 mass spectrometer detector with a single quadrupole analyzer and ESI. Each Piper extract was dissolved in absolute ethanol (5 mg/mL) and injected (20 µL) into the HPLC system. The separation system consisted of a Synergi C18 column (Phenomenex) (4.6 mm × 150 mm, 4 μm), and a combination of solvent A (1% formic acid in Mili-Q H2O) and solvent B (1% formic acid in acetonitrile [ACN]). A gradient elution method was used as follows: 0 to 2 min 0% B, 2 to 20 min 0% to 50% B, 20 to 30 min 50% B, 30 to 45 min 50% to 100% B, 45 to 50 min 100%, and 50 to 55 min 100% to 0% B, at 0.7 mL/min. The monitoring wavelength was 270 nm. Mass spectra were simultaneously acquired using ESI in the positive ion mode (scan 100-2000 m/z). The MS parameters involved a voltage detector at 1.5 kV, a curved desolvation line at 250 °C, a heat block temperature of 400 °C, and a nebulization gas flow of 1.5 L/min.
Statistical Analysis
A Shapiro-Wilk test was performed to determine the data normality of the inhibition percentage, extraction yield, and TPC and TFC data. Once normality was verified, analysis of variance tests were conducted on all samples (type I error, significance value p < .05), followed by post hoc Tukey tests to determine the significant differences between data. These statistical tests were performed using software R version 3.4.1 (R Foundation). On the other hand, the MS data obtained from LC-ESI-MS were preprocessed in MZmine 2.17, comprising peak detection, baseline correction, and deconvolution, 46 whose parameters are summarized in Table 3. The preprocessed data were exported as a .csv format to build the FIT, ie, (18 samples × 4947 features), and the data were autoscaled (unit-variance scaling) for adequate comparisons. Thus, a heat map was built to intuitively visualize the autoscaled feature distribution using MetaboAnalyst 5.0 (McGill University). 47 The pretreated FIT was also combined with the respective antifungal data (ie, %MGI as a continuous variable) to assemble the integrated dataset. The resulting matrix was then imported into SIMCA software (v 14.0) (Umetrics) to build the respective models by single-Y OPLS. The obtained results were visualized using the scores plot and S-plot. Finally, the pretreated FIT was also used for univariate statistics to build the volcano plot (FC threshold (X-axis) of 1.5 and a t-test threshold (Y-axis) of 0.05 (p-value) and the cross-validation through ROC curves using MetaboAnalyst 5.0 (McGill University). For this, the integrated FIT dataset was subdivided into 2 sub-datasets, such as the most-active (MGI>62%) and the least-active (MGI<58%) extracts to be used as categorical variables in the univariate analysis.
Summary of MZmine Parameters Used to Preprocess the Liquid chromatography-Mass Spectrometry (LC-MS) Data of Piper Extracts.

Purification and Identification of Antifungal Candidates 1-4 by Semipreparative-Scale HPLC
Portions of the PpS, PbaL, and PtL extracts (500 mg) were separately pretreated with solid-phase extraction (SPE) Strata® C18-U cartridges (55 µm, 70 Å, 500 mg, 6 mL) (Phenomenex). These SPE cartridges were previously conditioned with methanol (6 mL) and then water (6 mL). After loading the extracts, the cartridges were washed with water (5 mL). The adsorbed components were eluted with methanol (5 mL). Collected eluates containing depurated extracts were used for semipreparative HPLC-mediated isolation after geometrical transfer from optimized analytical conditions to maintain resolution and profile. Thus, the target compounds
Footnotes
Authors’ Contributions
DCL and SRA performed the chemical and biological experiments and analyzed the raw data; ECB designed the research, supervised the study and revised and validated the data and manuscript; ECB, and DCL wrote the draft article together. All authors read and approved the final manuscript.
Declaration of Conflicting Interests
The authors declared no potential conflicts of interest with respect to the research, authorship, and/or publication of this article.
Ethical Approval
Ethical approval does not apply to this article.
Funding
The authors disclosed receipt of the following financial support for the research, authorship, and/or publication of this article: This study was funded by the Vicerrectoría de Investigaciones de Universidad Militar Nueva Granada through the project INV-CIAS-1788, validity 2015.
Statement of Human and Animal Rights
This article does not contain any studies with human or animal subjects.
Statement of Informed Consent
There are no human subjects in this article, and informed consent is not applicable.