
Abstract
Sargassum is a genus of brown macroalgae in the class Phaeophyta, distributed widely in all oceans, including those of Vietnam. Species of this genus have been proven to possess diverse biological activities, such as antioxidant, anti-fungal, and anti-inflammatory, along with many benefits and applications for human health, including anti-diabetic, obesity, and thrombosis. These benefits arise from a diverse chemical composition, with compounds such as fucoidan, mannitol, and especially phlorotannin—a group of phenolic derivatives found predominantly in brown algae. In this study, we evaluated and optimized the factors that affected the extraction process of phlorotannins from Sargassum swartzii (Turn.) C. Ag., a common species of brown macroalgae in Vietnam. The process utilized ethanol and water as the solvent system, and the extraction process was assisted with the use of microwaves. To carry out optimization studies, Response Surface Methodology (RSM) was adopted according to a Central Composite Desisgn (CCD), taking four processing factors into consideration, ethanol concentration (%, v/v), extraction time (minutes), solvent/material ratio (v/w), and microwave output power (W) as independent variables. Phlorotannin concentration (mgPhE/g) and extract mass (mg) were regarded as optimization outcomes. Experimental conditions that produced the highest phlorotannin yield from 10 g of S. swartzii are as follows: Extraction time of 65 minutes, ethanol concentration of 52%, microwave output power of 613 W, and solvent/material ratio of 33/1 (v/w). These conditions corresponded to a phlorotannin concentration of 5.59 ± 0.11 mg PhE/g, and a total extract content of 27.88 ± 0.13 mg/g.
Keywords
The brown macroalgal genus Sargassum is one of the four largest genera in the family Sargassaceae, class Phaeophyta. They dominate in terms of structure and biomass, living on submerged reefs in waters spanning from tropical to polar regions. 1 -3 This genus includes 691 species and subspecies, distributed mainly in China, Japan, Korea, the Philippines, and Australia.4,5 Polysaccharides derived from species of Sargassum have been found to exhibit numerous useful biological activities, including antioxidant, anti-bacterial, anti-fungal, anti-inflammatory, anti-cancer, anti-thrombotic, and anti-UV-B radiation properties, as well as wound healing and cellular structure reformation properties. 4,5 These effects could be attributed to the presence of major chemical constituents, which include polysaccharides (alginic acid, laminarans, fucoidans), mannitol, gibberellin, cytokinin, polyphenol (ie, phlorotannin), inorganic minerals, fucoxanthin, chlorophyll, and vitamins. In addition, some of these compounds have also been found to possess unique and highly applicable properties in food and pharmaceutical industries, such as organ fat content reduction and anti-vein obstructions. 4,6,7 In a study related to S. wightii, experimental results showed that polysaccharide sulfates from this species could be used as an anti-coagulant agent. 5 Additionally, proteins that are found in macroalgae in the concentration range from 5% to 15% are usually bound to iodine, allowing the possibility for Sargassum species to be used as medication for prevention and treatment of Basedow’s disease. 6
Phlorotannins are a group of secondary metabolites consisting of mixtures of phenolic compounds and can be found predominantly in many families of the class Phaeophyta, especially in brown macroalgal species where phlorotannins may account for up to 15% of the dry weight of the alga. 8,9 Phlorotannins present in the free form chemically bind to different plant cell walls. 10 Chemically, phlorotannins are polymers of phloroglucinols (1,3,5-trihydrobenzene), and consist of monomers that are linked together in many different chemical arrangements, at different degrees of polymerization, which cause the molecular weight of phlorotannins to greatly vary, ranging from 126 Da to 650 kDa. 2,11,12 Phlorotannin components in some seaweed species have been studied in detail. 12 -19 Based on the types of bonds, phlorotannins are classified into four subclasses of ether-linked phlorotannins (fuhalols and phlorethols), substances with phenyl-bonding (fucols), substances with both ether and phenyl bonds (fucophlorethols) and substances with dibenzodioxin (eckols) binding. 20,21 The chemical composition of the phlorotannin compounds in marine algae is complex. As reported by Montero et al, 53 different phlorotannin compounds belonging to the fuhalol and phlorethol classes were detected in Sargassum muticum collected in Norway. 9 Furthermore, despite having an equal molecular weight, there are various structural isomers of phlorotannins due to different monomer binding positions. 22 Phlorotannin plays an important role in the chemical defense system of brown macroalgae, warding of algal eaters, as well as absorbing and filtering UV rays. 23 -27 Phlorotannin has also been reported to possess valuable pharmacological activities such as antioxidant, anti-HIV, anti-bacterial, anti-fungal, anti-diabetic, anti-cancer, anti-inflammatory, and anti-enzymatic properties. 4,28 -30 In a recent study, phlorotannin-containing raw extract obtained from Fucus vesiculosus has been reported to be able to inhibit the enzymatic activity of α-glucosidase, α-amylase, and pancreatic lipase, highlighting the applicability of phlorotannin in the manufacture of functional foods and pharmaceuticals used to treat diabetes and prevent obesity. 31 Concerning phlorotannin extracted from the genus Sargassum, aside from literature on chemical structure, 32 studies on biological activities (eg, antioxidant properties) also exist. 33,34 To clarify further, phlorotannin extracted from S. kjellmaniannum could help prevent fish oil from spoilage, possessing antioxidant activity 2.6 times higher than that of 0.02% BHT (butylated hydroxytoluene). 35 Activity against superoxide anions exhibited by phlorotannin from S. patens was found to be five times stronger than that of catechin. 36 Phlorotannin isolated from S. patens was also able to inhibit strongly carbohydrate hydrolysis enzymes, such as α-amylase in human saliva, α-glucosidase in mice GI tract, enabling its potential use as a natural medicine for diabetes prevention. 37
In Vietnam, Sargassum sp. are dominant, accounting for up to 98% of total seaweed reserves and distributed widely in the sea of many provinces spanning from the south to the north, including Quang Nam-Da Nang, Quang Ngai, Khanh Hoa, Vung Tau, Hue, Kien Giang, Quang Ninh, Hai Phong, Thanh Hoa, and Nghe An. 6,38 S. swartzii (Turn.) C. Ag. is one of 5 common macroalgal species in Vietnam. Raw polysaccharides isolated from S. swartzii were previously reported to be capable of reducing acetaminophen levels, indicating liver-protective properties. 39 To our knowledge, studies on phlorotannin isolated from the genus Sargassum are limited to the following species: S. angustifolium, S. aemulum, S. assimile, S. binderi, S. brevifolium, and S. mcclurei. In addition, newly developed extraction techniques, such as microwave-assisted extraction, which is a novel and environmentally friendly approach that reduces the amount of required solvent and extraction time, as well as increases the extraction yield has not been adopted. 40 -42 Up to the present, in Vietnam, only 1 study related to phlorotannin extraction from seaweed has been published. 43 However, only preliminary results were presented. Research suggested that 30% to 50% ethanol should be used to extract phlorotannin from S. fusiforme. Besides, the technological parameters for the highest extraction efficiency of phlorotannin was selected as extraction temperature 25 °C, solvent/material ratio (25/1, v/w) and extraction time of 30 minutes. 12 This is also the basis for our research to use ethanol as solvent at different concentrations to extract phlorotannin from S. swartzii.
Therefore, in this study, we conducted the extraction of phlorotannins from S. swartzii collected from the Vietnamese sea. The extraction process used ethanol as the solvent with microwave assistance, and optimization work was carried out for four variables, which were ethanol concentration, solvent/material ratio, extraction time, and microwave output power, using Response Surface Methodology (RSM) according to a Central Composite Design (CCD). The obtained results were expected to justify the valorization of S. swartzii as a material in manufacture of phlorotannins. Besides, the obtained results are the premise for us to continue researching and scaling up the process to exploit efficiently the great benefits from S. swartzii in Vietnam.
Materials and Methods
Materials
S. swartzii samples were collected from Co To Island, Quang Ninh province, Vietnam in March 2019. Collected samples were washed to remove contaminants, chopped, and dried until the moisture content was less than 10%, followed by grinding and cryopreservation at 4 °C until further experiments.
Extraction Procedure
Ten g of S. swartzii was weighed and transferred to a 2 L round bottomed flask. To this, selected volumes of ethanol were added according to the pre-determined concentrations and solvent/material ratio. A reflux condenser was set up, and the microwave (Samsung, Korea, 100‐800 W), connected to a 0‐220 V voltage regulator, was turned on at different power output levels for different experiments. Extraction time was recorded from the moment the microwave was turned on. At the end of the extraction process, the extract was filtered through a Buchner funnel, and the solvent removed under reduced pressure in a rotary evaporator, yielding the total extract (TE). This was accurately weighed (mg), stored at 4 °C, and evaluated. The total extract content (TEC) was determined from the following formula.

Determining Total Phlorotannin Content (TPC)
The total phlorotannin content was determined according to the Folin-Ciocalteu method, using the standard curve constructed based on phloroglucinol. 44,45
In a glass vessel, 2.5 ml of 10% Folin-Ciocalteu solution was added to 0.5 ml of total extract. After 5 minutes, 2 ml of 7.5% Na2CO3 was added, and the reaction was left to proceed in the dark at room temperature. After 45 minutes, the mixture was centrifuged, and the supernatant was collected and measured in a UV-Vis spectrophotometer (Shimadzu UV-Vis 1800, Japan) at 730 nm. Based on the standard curve equation, which reflects the relationship between phloroglucinol concentration and absorbance, the phlorotannin equivalent in the analyzed sample was calculated and expressed as mg phloroglucinol equivalent/ g dried materials (mgPhE/g dried materials).
Experimental Design for Response Surface Methodology Optimization
Using response surface methodology, a statistical model was estimated to describe the effect of selected experimental conditions (ethanol concentration, extraction temperature, ratio of solvent to raw material and microwave power) on total phlorotannin output and total extract content. 46 Box-Wilson central composite design was used to generate parameters for 25 experiments with a coefficient of α = 1.414, which were actually attempted to obtain the data of the two outcomes used for model estimation. The input for experimental design was obtained from results of preliminary single-factor investigations, which were carried out in the following order: effects of ethanol concentration, solvent/material ratio, extraction time and microwave output power on total phlorotannins yield and total extract content. The model was then evaluated for validity using Analysis of Variance (ANOVA) and then optimized to find the optimal set of conditions, which were then experimentally verified. The following second order equation represents the general function form that describes 1 desired outcome as a function of independent variables.

where Ŷ is the predicted response, X represents experimental conditions, and b is model parameters. The subscript 0, j, jj, and uj represent the constant term, coefficient of the linear jth term, coefficient of quadratic jth term and coefficient of interaction terms between u and j, respectively.
Evaluation of Total Antioxidant Capacity (TAC Assay)
The principle for TAC assay is established through the reaction at acidic pH of the antioxidant with Mo(VI), which is then reduced to Mo(V) and forms a phosphate/Mo (V) complex whose green color can be measured at 695 nm. 47 The extract (0.3 ml) was mixed with 3 ml of reagent solution (0.6 M H2SO4, 28 mM sodium phosphate and 4 mM ammonium molybdate), incubated at 95 °C for 90 minutes and then allowed to cool to room temperature. Then, the absorbance of the mixture was measured at 695 nm using a Spark multimode microplate reader (Tecan, Switzerland) against a blank, which was methanol, the volume of which was equal to that of the sample. Ascorbic acid was used as a positive control and the antioxidant activity was expressed as ascorbic acid equivalents (mg AAE/g extract).
Scavenging Ability Toward DPPH Radicals (DPPH Assay)
This assay is based on the loss of the dark purple color of 2,2-diphenyl-1-picrylhydrazyl (300 µM DPPH in ethanol) solution when reduced by an antioxidant. 48 For the assay, 20 µL diluted phlorotannin extract (in DMSO) was mixed with 180 µL of the DPPH solution in a microplate well. After 30 minutes of incubation in the dark at 37 °C, the absorption change was monitored spectrophotometrically at 517 nm using an Infinite F50 microplate reader, (Tecan, Switzerland). The scavenging capacity, SC%, was calculated against the blank:

where ODblank is the absorbance of the control reaction (containing all reagents except the test compound) and ODsample is the absorbance of the test compound.
Ferric Ion Reducing Antioxidant Potential (FRAP Assay)
The modified method of Benzie & Strain was adopted to assess ferric ion reducing antioxidant potential. 49 The fresh FRAP solutions consisted of 10 mM TPTZ (2, 4, 6-tripyridyl-s-triazine), 40 mM HCl, and 20 mM FeCl3, prepared in 300 mM acetate buffer (pH 3.6) and warmed to 37 °C before using. 500 µL of the FRAP solution was incubated for 30 minutes at 37 °C, then the absorbance was measured at 593 nm. The assay was then proceeded by diluting 20 µL of samples to 1 ml using 100% DMSO. TEAC was expressed as mgFe2+/g extract relative to the linear range of the standard curve.
Results
Single Factor Investigaton
Based on previous works related to extraction processes for S. swartzii and some preliminary experiments, we selected the following initial parameters for the extraction process: ethanol concentration 60%, extraction time 60 minutes, solvent/material ratio 30/1 mL/g, microwave output power 400 W. The effects of these parameters on the total phlorotannin concentration and the total extract content are shown in Figure 1.

The effects of ethanol concentration (A), solvent/material ratio (B), extraction time (C), and microwave output power (D) on the total phlorotannin content and total extract content from S. swartzii.
Firstly, we investigated the effects of ethanol concentration on the extraction process. Other technological factors were held constant at their initial levels. Experimental results are shown in Figure 1(A). The surveyed ethanol concentration ranged from 20% to 96%. Results showed that as the solvent concentration increased from 20% to 60%, the phlorotannin content increased from 2.51 to 5.28 mgPhE/g. As the ethanol concentration was increased to 80%, the phlorotannin content was also slightly improved and attained its maximum at 5.32 mgPhE/g. For total extract content, the maximum was attained at an ethanol concentration of 40%. When ethanol concentration was increased, the total extract content decreased to its lowest level when the ethanol concentration was 96%. These results could be explained as follows. Ethanol is a solvent with average polarity whereas water is a highly polar solvent, thus rising ethanol concentration causes the overall polarity of the solvent system to decline, which is favorable for extraction of phenolic compounds and phlorotannin. 12,50,51 In addition, due to the abundance of polysaccharides in macroalgae, which usually dissolve well in strongly polar solvent, the use of ethanol at low concentrations led to a higher total extract content. Specifically, when the ethanol concentration was 60%, fucoidan precipitated, while laminaran precipitated at a concentration of 80%. Therefore, increasing ethanol concentration would result in a decrease in total extract content, as many components were not dissolved, except for phlorotannin. 3 Based on experimental results, we realized that at the ethanol concentration of 60%, the phlorotannin content reached 5.28 mgPhE/g and total extract content reached 27.7 mg/g, both of which are close to their maximum respective values. Therefore, we selected an ethanol concentration of 60% for successive experiments.
In the subsequent experiment, the solvent/material ratio was surveyed in a range from 15/1 to 40/1 (v/w). Figure 1(B) shows that, as the solvent/material ratio increased from 15/1 to 30/1, the phlorotannin content and total extract content both increased significantly from 2 to 4.4 mgPhE/g and from 19.9 to 27.7 mg/g, respectively. When this ratio was increased to 35/1 (v/w), the phlorotannin content continued to increase to 5.4 mgPhE/g, while the total extract content remained unchanged. When the ratio was increased to 40/1 (v/w), the phlorotannin content reached its maximum at 5.42 mgPhE/g, while the total extract content remained constant. This could be explained by the fact that an increased solvent/material ratio could improve the surface contact between material and solvent, enabling the compounds to dissolve more easily. At first, the imbalance in solute concentration between material and solvent was high, so, according to the principle of equilibrium, the outward movement of solutes from intracellular spaces into the solvent occurred at a high rate. When equilibrium was attained, the diffusion process would gradually slow down, despite the increase in solvent volume. 6,31,50 Based on the experimental results, we selected a solvent/material ratio of 30/1 (v/w) for successive experiments.
Figure 1(C) shows variations of total extract content and total phlorotannin content over the course of 90 minutes. Extraction time seemed to be proportionate to phlorotannin content and total extract content. Specifically, as the extraction time increased from 15 to 60 minutes, the phlorotannin content significantly increased from 2.24 to 5.51 mgPhE/g, and the total extract content increased from 18.7 to 26.6 mg/g. When the extraction time was increased to 75 minutes, the phlorotannin content and total extract content only increased slightly to 5.54 mgPhE/g and 26.8 mg/g, respectively. Prolonging the extraction time to 90 minutes caused the phlorotannin content to decline to 5.22 mgPhE/g, while the total extract content did not change. This pattern could be explained as follows. Initially, an increase in extraction time allowed more solutes to diffuse into the solvent. However, at a certain threshold, equilibrium would be established, and even a great increase in extraction time would not cause any noticeable change in extraction yield. 52 On the contrary, phlorotannin is a heat labile phenolic compound, and easily degrades when the extraction time is increased at high temperatures, leading to a decrease in content. These experimental results agree with a previous work where the extraction process of polyphenols from Glycine max L. seedlings was investigated. 51 Based on the obtained results, we selected an extraction time of 45 minutes as the central value, 30 minutes as the minimum and 60 minutes as the maximum for successive experiments as, within this range of extraction times, the increase in total contents of extract and phlorotannins was the most significant.
Lastly, the effects were studied of microwave output power in a range from 80 to 720 W on phlorotannin content and total extract content. Figure 1(D) shows that at a microwave output power of 400 W, the phlorotannin content reached its maximum at 5.47 mgPhE/g and the total extract content nearly reached its maximum at 26.8 mg/g. As the output power continued to increase up to 560 W, the phlorotannin content decreased to 5.23 mgPhE/g, while the total extract content only increased slightly and reached its maximum at 26.9 mg/g. When output power reached 720 W, the phlorotannin content continued to decrease to 5.16 mgPhE/g, and total extract content remained unchanged. Microwave output power is directly related to the temperature of the extraction process. As output power increased, temperature also increased, which led to more rapid molecular motion. This in turn led to a decrease in viscosity and surface tension of the solvent, which allowed the extraction process to occur at a faster rate and increased extraction yield. However, high temperature can easily oxidize the phlorotannin, which would lead to a decrease in phlorotannin content, affecting the quality of the extract. 53 Additionally, maintaining high output power over a long period of time is uneconomical and introduces additional manufacturing costs that are not justifiable by minor, improbable improvements of the yield. Therefore, we selected a microwave output power of 400 W for successive experiments.
Predicted Model and Statistical Analysis
The response variables include total phlorotannin content (Y1) and total extract content (Y2) from S. swartzii, obtained by microwave-assisted extraction. The ethanol concentration (%), solvent/material ratio (v/w), extraction time (minutes), and microwave output power (W) were selected as independent variables and their considered values are summarized in Table 1. Table 2 describes the planned parameters, and their corresponded predicted and actual responses. After the estimated function had been obtained, real experiments were performed, and the values were recorded and compared with the expected values in order to determine the model’s validity.
Independent Variables and Their Corresponding Levels.

Coefficient α = 1.414.
Experimental Design and Response Values.

Based on separate single factor investigations, 25 experiments were constructed according to the experimental design matrix in order to generate the data used for linear regression of the second order function. To justify Y1 and Y2 response functions, F-values, P values, and R2
values were used to evaluate the linear regression analysis results. Predicted response surfaces for phlorotannin (Y1) and total extract content (Y2) could be described by independent variables by a second-degree polynomial equation, as shown in Table 3. ANOVA analysis of the second order regression model had proven that the model was highly significant, with sufficient compatibility. F-values for Y1 and Y2 were computed to be 33.5 and 18.72, respectively, and the very low
Regression Coefficients of Second-Degree Polynomial Models for Phlorotannin Content (Y1), and Total Extract Content (Y2).

*P < 0.05; NS = not significant.
ANOVA analysis results in Table 3 also show that the regression function Y1 (phlorotannin content) depended on 8 interactions, including 4 single variable ones, 3 pairs of double convolution interactions (AB, AD, BC), and 1 square interaction (B. 2 Of the interactions above, single variable interactions affected the target function Y1 the most. In terms of effect on the target function, single variable interaction levels decreased in the order of A > C > B > D, corresponding to their coefficients. Similarly, target function Y2 (total extract content) depended on 7 interactions, including 4 single variable ones (A, B, C, D), 2 pairs of double convolution interactions (AD, BC), and 1 square interaction (B. 2 In terms of effect on the target function, single variable interaction levels decreased in the order of A > B = C > D, corresponding to their coefficients.
Response Surface Analysis
Twelve 3 dimensional spaces illustrating pair-wise interaction of process parameters on the response were drawn using Design Expert 7.0.0 (Figure 2). The X and Y axes of the response surfaces in 3 dimensions represent the two varying factors, while other factors were held at their central value. The Z-axes represent one of the two target functions, which were phlorotannin content (mgPhE/g), and total extract content (mg/g).

Response surface of phlorotannin content (A) and total extract content (B).
For target function Y1, based on the response surfaces, the interactions between factor pairs and the target function decreased in the order of AC > AB > AD > BC > CD > BD. Similarly, for function Y2, the interactions between factor pairs and the target function decreased in the order of AB = AC > AD > BS > BD = BC.
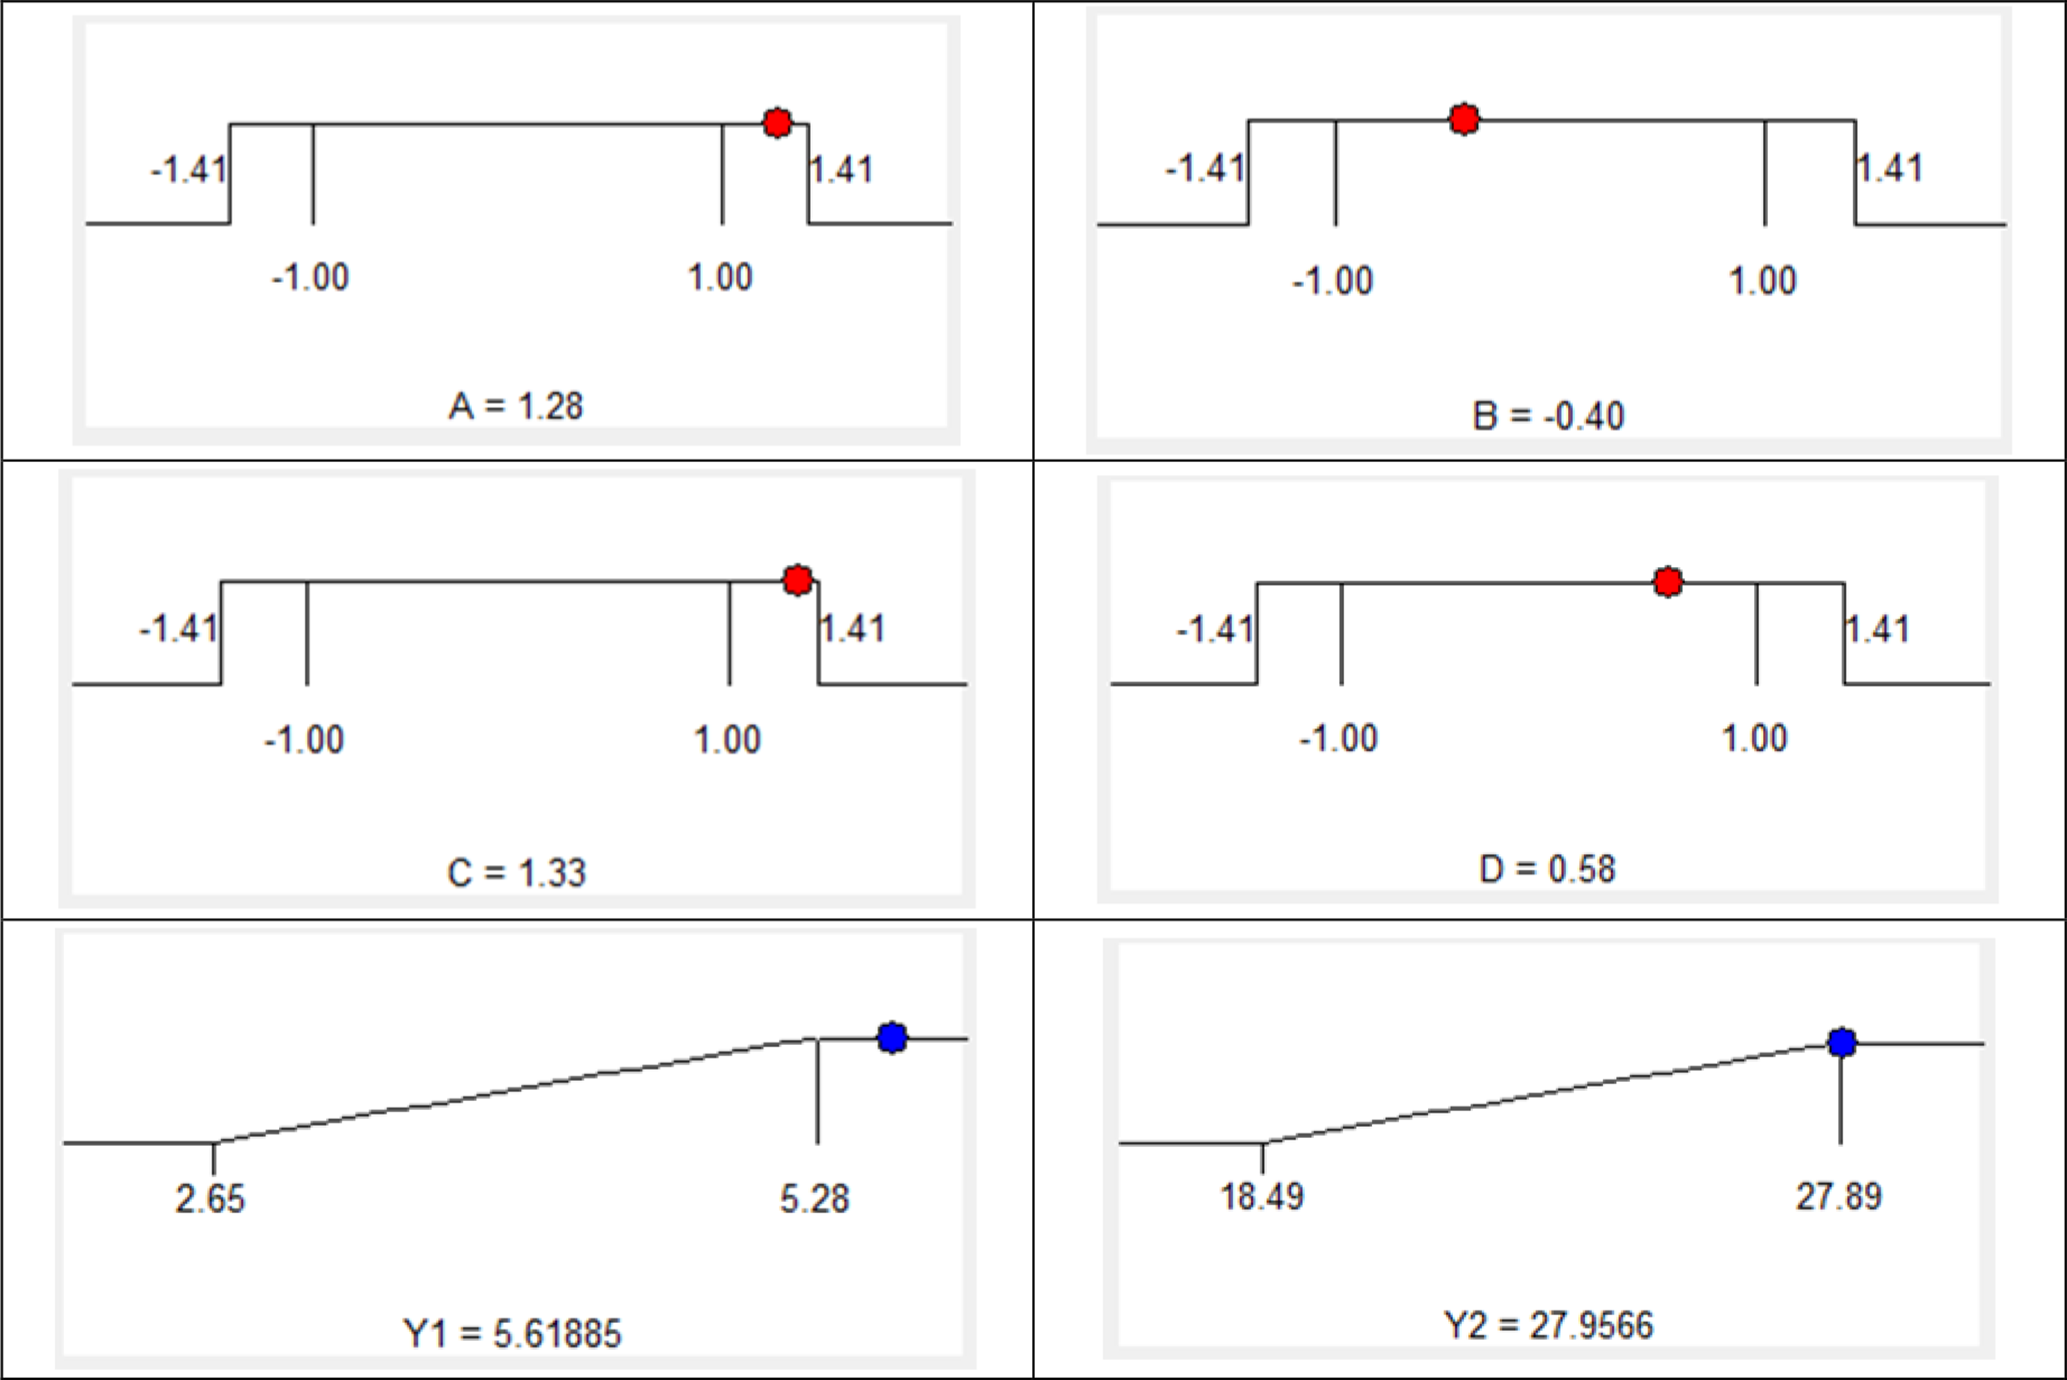
Optimization and Model Verification
The estimated functions (Table 4) were then solved to determine the optimal technological factors of the process and maximize both phlorotannin content and total extract content. The level of importance of the two responses was chosen as follows: phlorotannin content (Y1) at level 4, and total extract content (Y2) at level 3. Predicted values showed that phlorotannin content and total extract content attained their maxima under the following conditions: extraction time of 64.2 minutes, ethanol concentration of 52%, microwave output power of 612.8 W, and solvent/material ratio of 32.9/1 (v/w). (Table 5 and Figure 3). In order to conform with realistic experimental conditions, we modified those optimized conditions to: Extraction time 65 minutes, ethanol concentration 52%, microwave output power 613 W, and solvent/material ratio of 33/1 (v/w). At these optimized conditions, the predicted and realistic values of the phlorotannin content were 5.62 mgPhE/g and 5.59 ± 0.11 mgPhE/g respectively; predicted and realistic values of the total extract content were 27.96 mg/g and 27.88 ± 0.13 mg/g, respectively. As the predicted and experimental values were approximately equal, we could once again assert that our established model has high compatibility.
Optimal conditions by solution of ramps.
Empirical Second-Order Polynomial Model of Phlorotannin Content and Total Extract Content.

Values of the Independent and Real Variables.

Antioxidant Activity of the Total Extract
Previous studies showed that polyphenols from macroalgae possess potent antioxidant activity. Of which, phlorotannin has in vitro free radical neutralization activity similar to that of the positive control, tocopherol, and is a potential antioxidant in in vitro free radical assays such as DPPH, hydroxyl, superoxide, and peroxyl. 23,54,55 In this study, the antioxidant activity of the phlorotannin extract obtained after extraction was evaluated using TAC, FRAP, and DPPH assays. The results of all three tests indicate that the phlorotannin extract exhibited strong activity. Specifically, the IC50 value (representing the ability to neutralize 50% of free radicals) in TAC, FRAP, and DPPH assays were 3.6 ± 0.5 mg AAE/g, 7.2 ± 0.4 mgFe2+/g and 9.4 ± 0.5 mg/L respectively. These results further proved that the optimized extraction process produced extracts with sufficient phlorotannin content from S. swartzii, while maintaining the original biological activities of these compounds in the extract sample.
Conclusions
In this study, phlorotannin was extracted from S. swartzii harvested in Vietnam with the assistance of microwave irradiation, and the process was optimized using response surface methodology according to a central composite design, with four independent variables: extraction time (minutes), ethanol concentration (%, v/v), microwave output power (W), and solvent/material ratio (v/w). Dependent variables were phlorotannin content (mgPhE/g), and total extract content (mg/g). The obtained optimal conditions for this process were: extraction time 65 minutes, ethanol concentration 52%, microwave output power 613 W, and solvent/material ratio 33/1 (v/w). With these conditions, the phlorotannin content and total extract content were 5.59 ± 0.11 mgPhE/g and 27.88 ± 0.13 mg/g, respectively. The antioxidant activity of the extract obtained at optimized conditions was evaluated using three assays: TAC, FRAP, and DPPH. For these tests, IC50 values were 3.6 ± 0.5 mg AAE/g, 7.2 ± 0.4 mgFe2+/g and 9.4 ± 0.5 mg/L, respectively. These values proved that the optimized microwave-assisted extraction process still preserved the original antioxidant activity of the extract samples.
Footnotes
Declaration of Conflicting Interests
The author(s) declared no potential conflicts of interest with respect to the research, authorship, and/or publication of this article.
Funding
The author(s) disclosed receipt of the following financial support for the research, authorship, and/or publication of this article: This work was supported by grant VT-CB.13/18‐20 of Space Science and Technology Program from Vietnam Academy of Science and Technology.