
Abstract
Huperzine A, isolated from Huperzia serrata, is a potent, specific, and reversible inhibitor of acetylcholinesterase with high efficiency and low toxicity. To evaluate the presence of huperzine A in Vietnamese H serrata, a reliable capillary zone electrophoresis method was developed. The analytical conditions were established using 80 mM ammonium acetate buffer, pH 6.0, hydrodynamic injection at 50 mbar for 5 s, applied voltage of 20 kV, temperature at 25 °C, uncoated fused-silica capillary, 56 cm (50 cm effective length) × 70 µm inner diameter, and ultraviolet detection at 310 nm. The recovery rates ranged from 98.05% to 100.64%, with a relative standard deviation <2%. Good linear regression was observed in the concentration range of 1 to 500 µg/mL, with a correlation coefficient of 0.9994. The limit of detection and limit of quantification were 0.33 and 1.0 µg/mL, respectively. These results demonstrate that this method is simple, selective, and suitable for performing quality control for huperzine A derived from Vietnamese H serrata.
Alzheimer's disease (AD) is one of several brain disorders classified under the broad category of dementia, affecting older individuals worldwide. The incidence of AD has increased with the aging population, which is considered a significant public health problem. The functional deficits associated with AD include hypoactivity of cholinergic neurons. 1 The primary class of drugs currently used for the treatment of AD is acetylcholinesterase/cholinesterase (ChEs) inhibitors.2-4 ChEs inhibitors, such as tacrine, galantamine, and donepezil, have been used to enhance the cholinergic neurotransmission activity of the central nervous system. However, ChE inhibitors that are currently available on the market are often no longer used due to high hepatotoxicity.3-7 Depending on their mechanisms of action, ChE inhibitors can be classified as either short-acting/reversible agents (tacrine, donepezil, and galantamine) or intermediate-acting/pseudo-irreversible agents (rivastigmine).4,8,9 Due to gastrointestinal side effects, medicinal chemistry and pharmaceutical delivery studies have investigated additional solutions to improve the pharmacological activities of ChE inhibitors, and new pharmacotherapeutic resources remain necessary for the treatment of AD.2,5
Huperzine A is an alkaloid that was first isolated from Huperzia serrata. Huperzine A is a potent, reversible, and selective ChE inhibitor (Figure 1).10,11 Huperzine A has been approved as a therapeutic agent for AD in China and is marketed in the United States of America as a dietary supplement.8,10 Huperzine A has been identified mostly in Lycopodiaceae sp10,11; however, due to the lack of natural resources, the cultivation of Huperzia plant tissue, chemical synthesis, and entophytic fungal fermentation are the primary methods used for the large-scale production of huperzine A.10,12

Chemical structure of huperzine A.
Recently, a method for determining the presence of huperzine A in Chinese medicinal plants using a high-performance liquid chromatography (HPLC) method was published. 13 Capillary electrophoresis (CE) methods have previously been used to investigate huperzine A quantification in pharmaceutical products and even serum using acetate buffer (pH 4.60; 20 mM) as a background electrolyte of CE condition. 14 However, a specific and sensitive analytical method for the determination of huperzine A in plants remains necessary. In this study, we aimed to develop a fast and selective method for determining the presence of huperzine A in Vietnamese H serrata using capillary zone electrophoresis (CZE), combined with ultraviolet (UV) detection. The optimal electrophoresis conditions for separation of huperzine A in the plant extract matrix were acetate buffer solution (pH 6.0; 80 mM) based on the results of investigating the effect of pH and buffer concentration on the resolution of huperzine A.
Experimental
Standards, Reagents, and Samples
The standard sample of huperzine A and the internal standard (IS) imidazole were purchased from Sigma-Aldrich. Methanol, ammonium acetate, monobasic potassium phosphate, and sodium hydroxide were obtained from Merck. All other chemicals were of analytical grade purity. H serrata samples were collected from the tropical forest in Lam Dong (L), Kon Tum (K), and Gia Lai (G) provinces, Vietnam, in November 2019 and were identified by Prof Tran Cong Luan, Department of Pharmacy, Faculty of Pharmacy and Nurse, Tay Do University, Can Tho, Vietnam. Their voucher specimens were deposited at the Herbarium of the Research Center of Ginseng and Medicinal Materials, Ho Chi Minh City, Vietnam. The whole plant was dried at 40 ± 1 °C and reduced to powder form using a cutter mill.
Apparatus
An OP-208 precision digital pH-meter of Radelkis and pH-sensitive combined glass electrode were used to measure pH. An ultrasonic bath was used to sonicate and remove dissolved air. The CZE experiment was carried out using an Agilent-7100 CE system (Germany) equipped with diode array detection, operating on a 3D-CE CHEMStation. An uncoated fused-silica capillary was also purchased from Agilent with a total length of 56 cm (50 cm to the detector) and 70 µm inner diameter (ID). The UV absorbance was monitored at 310 nm.
Standard Preparation
Stock IS solution (1 mg/mL) was prepared by weighing 5 mg of imidazole (1) and dissolving it in 50 mM hydrochloric acid in tared 5 mL volumetric flasks. Stock standard solution (1 mg/mL) was prepared by dissolving 5 mg of huperzine A (2) in 50 mM hydrochloric acid in tared 5 mL volumetric flasks. The stock standard solutions were stored in a freezer. These solutions, after adequate dilution, were used for the validation study. The working solution ranges were diluted with double distilled water into 5 mL volumetric flasks containing 150 µL of IS solution to give final concentrations ranging from 1 to 500 µg/mL and 30 µg/mL of IS.
Sample Preparation
Approximately 0.5 g of the sample was extracted with 30 mL methanol for 10 min in an ultrasonic bath. The combined methanol extracts were evaporated under reduced pressure in a rotary evaporator. The residue was then dissolved in 50 mM hydrochloric acid in a 5 mL volumetric flask containing 150 µL of IS solution to give a final concentration of 30 µg/mL of IS. The samples, after sonication for 10 min, were filtered through a 0.22 µm Millipore filter to obtain clear solutions that were adequately diluted before injection.
Background Electrolyte and Method Development and Optimization
A buffer solution for CZE was prepared with sodium dihydrogen phosphate and ammonium acetate. The pH was adjusted with either 0.2 M sodium hydroxide or 0.1 M acetic acid. Huperzine A is an unsaturated sesquiterpenic compound with a pyridone moiety and primary –NH2 group which can be protonated in slightly acidic media, and thus, a cationic behavior of huperzine A during the electrophoresis may be expected. The pH of buffer solution in a range below 7.0 can be used for CZE determination of huperzine A. Under appropriate conditions, the end of the capillary containing the sample is the anode, and the solutes migrate toward the cathode at a velocity determined by their electrophoretic mobility and the electroosmotic flow (EOF). Cations elute first, with smaller, more highly charged cations eluting before larger ones with smaller charge. Finally, anions are the last to elute. As our initial condition, the background electrolyte was 80 mM ammonium acetate buffer, pH 6.0. The analytical solutions were injected hydrodynamically at 50 mbar and hydrodynamic injection for 5 s. A separation voltage of 20 kV was applied. The experiments were run at a temperature of 25 °C. In order to optimize the CZE method, several analysis parameters, such as detection wavelengths, background electrolyte (BGE) composition, pH, concentration, applied voltage, temperature, injection pressure, and time of injection, along with the use of an organic modifier, are the most common parameters that are required to be examined. The optimal conditions were evaluated through resolution, efficiency, and analysis time.
Validation of Method
The method validation was undertaken according to the International Council on Harmonization (ICH) guidelines. Imidazole was selected as an IS because it is closely related to huperzine A and gave good shape peak and clear resolution.
Validation entails evaluating various parameters of the method such as system suitability, selectivity, linearity, limit of detection (LOD), limit of quantitation (LOQ), precision, and accuracy. The system suitability was assessed by 5 replicate analyses of the standard solution at a 75 μg/mL concentration. System suitability of the method was evaluated by analyzing the repeatability, peak symmetry, theoretical plates of the column, the resolution between the peaks of huperzine A, IS, and relative retention.
Selectivity is the ability of a method to discriminate between the analyte of interest and other components that are present in the sample. The method was evaluated to ensure the separation of huperzine A from the IS. The method's linearity was evaluated at 7 different concentrations that ranged from 1 to 500 μg/mL for huperzine A. LOD and LOQ were calculated by the equation given in ICH guidelines. To test the method's precision, triplicate determinations of each analyte were carried out interday and on 3 different nonconsecutive days. The accuracy of the method was evaluated from the recovery assay made on the samples. Thus, known amounts of each standard were prepared in triplicate at 3 levels (80%, 100%, and 120%) and spiked into their corresponding samples, and the average recovery was calculated as the mean value obtained.
Results and Discussion
Detection of Wavelength
The UV spectrophotometer scan in the range of 190 to 400 nm showed that huperzine A (migration time [tm] = 9.12 min) was associated with absorption peaks at 230 and 310 nm; IS (tm = 5.94 min) had a maximum sensitivity at 310 nm. Therefore, a detection wavelength of 310 nm was selected to quantify the analytes (Figure 2).

Electropherogram of standard mixture of IS (peak 1; 30 μg/mL) and huperzine A (peak 2; 75 μg/mL). Electrophoretic conditions: 80 mM ammonium acetate buffer, pH 6.0; 50 mbar injection pressure and hydrodynamic injection for 5 s; applied voltage, 20 kV; temperature, 25 °C; uncoated fused-silica capillary, 56 cm (50 cm effective length) × 70 µm ID; detection, 310 nm.
Buffer Composition, pH, and Concentrations
The selection of an appropriate running buffer is significant for the success of any separation because the buffer can alter the selectivity. Three buffer solutions, sodium acetate, ammonium acetate, and sodium dihydrogen phosphate, at acidic pH values, were used as BGEs to determine which buffer would provide the best separation of huperzine A (pKa = 7.7) from the sample. The results of BGE optimization are shown in Figure 3. In sodium acetate buffer (a), the peak corresponding to huperzine A presented a very poor separation and symmetry. When using the sodium dihydrogen phosphate buffer (c), huperzine A separation was obtained, but the peak resolution was not good. The best result was obtained when using ammonium acetate buffer (b), which resulted in a better peak shape and resolution for huperzine A.

Electropherogram of the sample: peak (1): IS; peak (2): huperzine A. The effects of BGE composition, pH, and concentration. (a) Sodium acetate, 80 mM, pH 5.5. (b) Ammonium acetate, 80 mM, pH 6.0. (c) Sodium dihydrogen phosphate, 60 mM, pH 6.5. Electrophoretic conditions: 50 mbar injection pressure and hydrodynamic injection for 5 s; applied voltage, 20 kV; temperature, 25 °C; uncoated fused-silica capillary, 56 cm (50 cm effective length) × 70 µm ID; detection, 310 nm.
The pH of the selected BGE is a critical parameter for developing a CZE method because ionic analytes demonstrate remarkably different electron affinities based on migration of charged components in an electric field. Moreover, the pH value also has a remarkable effect on the EOF generated in the fused-silica capillary. The effects of pH on the resolution and analysis time were investigated over a pH range of 4.0 to 6.5. When the pH was higher and lower than 6.0, the separation of huperzine A became less well defined and its resolution was below 1.5; thus, a pH of 6.0 was used to obtain the optimal separation from the closest peak migrating before and after huperzine A. The tm of huperzine A increased with increasing pH, possibly due to an increase in the negative charge of the compound and a change in the EOF. However, at higher pH values, the EOF became faster, reducing tm values. The best resolution for huperzine A was found at pH 6.0.
In addition, different ammonium acetate buffer concentrations in the 60 to 100 mM range were investigated. At the 60 mM concentration, the separation of analytes was incomplete. The 100 mM concentration required extended analysis times with a high intensity of current, which do not make this procedure easy to perform for routine analyses. Therefore, a buffer concentration of 80 mM was selected, which yielded results with a better resolution and a shorter analysis time.
Effects of the Applied Voltage
For the optimization of separation voltage, the analysis of various applied voltage values was performed, ranging from 10 to 30 kV (Figure 4). At 30 kV, the separation of analytes was incomplete. At a low voltage, 10 kV, separation of all the analytes was achieved, but the analysis time increased to 12 min, with broadening of the peaks. The optimal value was selected as 20 kV, which produced the best values for electric current of 25 µA and the complete separation of analytes.

Electropherogram of the sample: peak (1): IS; peak (2): huperzine A. Effects of applied voltage: (a) 10 kV; (b) 20 kV; and (c) 30 kV. Electrophoretic conditions: 80 mM ammonium acetate buffer, pH 6.0; 50 mbar injection pressure and hydrodynamic injection for 5 s; temperature, 25 °C; uncoated fused-silica capillary, 56 cm (50 cm effective length) × 70 µm ID; detection, 310 nm.
Organic Modifier
Several organic modifiers, including acetonitrile, methanol, ethanol, and acetone, were added to the BGE at a concentration of 5% for each used in order to improve the peak shape. However, no significant improvements were obtained, and the tm increased. Therefore, no organic modifier was selected.
Influence of Temperature
Increasing the system temperature led to decreased buffer viscosity, increased electrophoretic mobility, and decreased tm values. Temperatures of 25 °C, 30 °C, and 40 °C were investigated. The studied factors were stable at 25 °C and thus the optimal working temperature was set at 25 °C to obtain a better separation, resolution, and lower tm values.
Influence of the Injection Pressure and Time of Injection
The injection pressure and time of injection only slightly influenced the tm values of the analytes, resulting in a decrease in tm values. An increase in injection pressure from 50 to 100 mbar and time of injection from 5 to 10 s only slightly influenced the tm values. A 50 mbar injection pressure and hydrodynamic injection time of 5 s were selected to avoid peak splitting and band broadening to obtain the best separation resolution. Based on the experimental design results, the optimal resolution would be achieved with a BGE consisting of 80 mM ammonium acetate, pH 6.0; temperature, 25 °C; voltage, 20 kV; and injection parameters of 50 mbar and hydrodynamic injection for 5 s. By adopting these optimized conditions, a baseline separation of huperzine A was achieved, with a resolution (Rs) value of 1.95.
System Suitability
The system suitability test is performed to verify the excellent operation of an instrument used for analytical measurements. The results demonstrated that the system could produce accurate and reproducible data. According to the US Food and Drug Administration (FDA), 15 the theoretical plate number must be higher than 2000, tailing factor asymmetry (As) ≤ 2, and Rs > 2. Table 1 shows the results obtained for huperzine A (75 µg/mL) standard solutions containing 30 µg/mL of IS. All parameters are according to FDA recommendations.
System Suitability Testing for the CZE Method.

Abbreviations: CZE, capillary zone electrophoresis; IS, internal standard.
Selectivity
Selectivity was evaluated by comparing chromatograms and the migration of the blank, huperzine A standard, and sample solution. The results were demonstrated by the baseline separation of the huperzine A peak in the electropherograms. No significant electrophoretic interference material was identified. The evaluation of peak purity was based on the diode array detector and the operation of the CZE system. A purity index superior to 98.8% was obtained, confirming the method specificity. The results indicated that no interference was detected between huperzine A and other compounds.
Linearity
Linearity was demonstrated by analyzing 7 huperzine A standard solutions, at concentrations of 1, 12, 37.5, 75, 150, 300, and 500 µg/mL, containing 30 µg/mL of IS These standard solutions were injected in triplicate, and the average corrected peak area ratios were plotted against the corresponding huperzine A concentrations. From the regression analysis, a linear relationship was obtained (ŷ = 0.0167x − 0.0026), with a correlation coefficient of 0.9994. For the determination of the LOD, the injection of a huperzine A standard solution at a low concentration was tested to identify a concentration with a corresponding signal-to-noise (S/N) ratio similar to that of the chromatograms of the blank samples (S/N = 3 for LOD and S/N = 10 for the LOQ). The experimental results for the LOD and LOQ of huperzine A were 0.33 and 1 μg/mL, respectively. The intra- and interday precisions of the proposed analytical method were determined at concentrations in the low-, middle-, and high-linearity range, containing a constant IS concentration. The relative standard deviation (RSD, in %) values for the peak area ratios are given in Table 2. Average RSD values of 1.4% and 1.3% were obtained for intra- and interday precision, indicating a good agreement among individual test results. The criterion for precision demands an RSD value below 2%.
Intra- and Interday Precision of the Proposed CZE Method for the Quantitative Determination of Huperzine A.
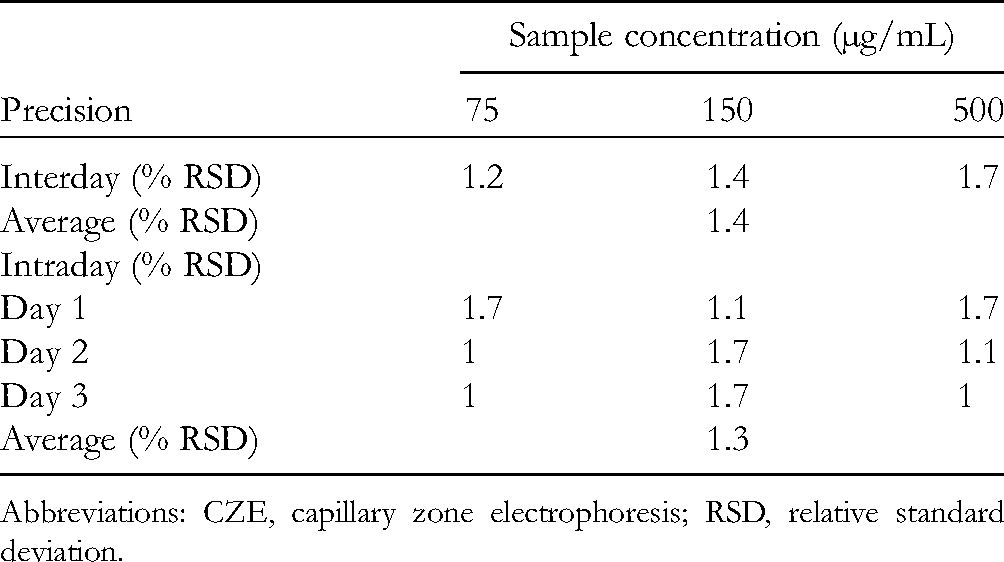
Abbreviations: CZE, capillary zone electrophoresis; RSD, relative standard deviation.
Accuracy
The method's accuracy was evaluated as the percent recovery across 3 samples with wide intervals of concentration levels, using 3 replicates each. Samples were analyzed by adding a known quantity of huperzine A standard, equivalent to 125, 150, and 175 µg/mL huperzine A, to sample extracts. Table 3 shows that the recovery rates ranged from 98.05% to 100.64% for the 3 concentration levels. The mean recovery values were within 100% ± 2% at each concentration level, over the range of 80% to 120% of the target concentration.
Recovery of a Standard Solution of Huperzine A Added to Samples and Determined Using the Proposed CZE Method.
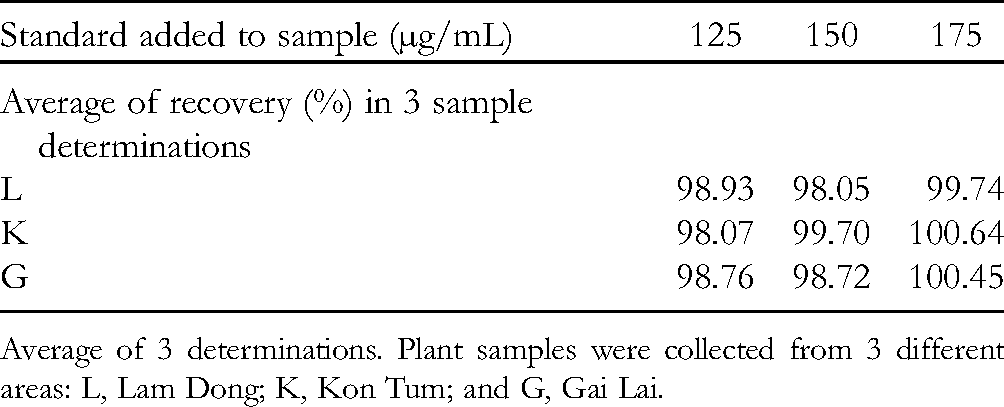
Average of 3 determinations. Plant samples were collected from 3 different areas: L, Lam Dong; K, Kon Tum; and G, Gai Lai.
Applications
The analysis of actual samples was performed using dried powdered H serrata obtained from 3 different locations in Vietnam. The quantitation of the alkaloid was performed using the proposed method. The analytical results are summarized in Table 4.
Sample Analysis Results.

The average huperzine A content was 155 ± 1.7 (µg/g) in the dried herb samples. Figure 5 illustrates the typical electropherogram of the sample (L) that was collected from Lam Dong province.

Electropherograms of plant sample (L). Electrophoretic conditions: 80 mM ammonium acetate buffer, pH 6.0; 50 mbar injection pressure and hydrodynamic injection for 5 s; applied voltage, 20 kV; temperature, 25 °C; uncoated fused-silica capillary, 56 cm (50 cm effective length) × 70 µm inner diameter (ID); detection, 310 nm.
Discussion
In studies that have examined the quantification of huperzine A in medicinal herbs, many researchers have used an HPLC method. The test sample is extracted according to the general principles of alkaloid extraction and can include extraction with MeOH, extraction with acidic water, extraction with acidic alcohol, and alkalizing medicinal powders combined with chloroform extraction. The HPLC quantitative process meets the requirements for sensitivity, specificity, and accuracy, especially for alkaloids. However, few published documents have described the application of the CE method for determining the huperzine A contents in extracts derived from plants of the Lycopodiaceae family. Based on its chemical structure, huperzine A has been identified as an alkaloid that is alkaline under neutral conditions and becomes ionized in an acidic environment at suitable pH values. Therefore, it is possible to apply the CZE method to quantitatively analyze the concentration of this active ingredient in herbs belonging to the Lycopodiaceae.
In this study, for the first time, the CZE technique was applied to develop a quantitative process for evaluating huperzine A contents in Vietnamese Huperzia. The advantages of capillary column separation include significant improvements in the resolution of analytical components identified in complex sample bases, the consumption of minimal amounts of solvents and analytical samples, and the ability to be performed rapidly, with short analysis times while meeting accuracy and precision requirements. Furthermore, the CE method is highly effective for the separation of optical isomers.
Natural enantiomers of huperzine A have much stronger biological activity than the chemically synthesized racemic mixture.15,16 In our experiment, the basis for analyzing substances using the CZE method is the different electrophoretic mobility of ions in the fused-silica capillary and the osmotic current moving toward the cathode. The pH value plays a critical role in the CZE method because pH affects the analyte ionization level and affects the electrophoretic mobility of the analyte. This factor plays an essential role in the separation of substances using the CZE technique. Huperzine A has a pKa of 7.7, 17 and the chemical formula of huperzine A features a pair of free electrons in the –NH2 group, which will accept a proton (H+) in an acidic environment, transforming it into a positively charged ion, which is favorable during the electrophoresis process.
Therefore, buffer solutions with pH values below 7 were selected to investigate the optimal huperzine A electrophoresis conditions. Conversely, when the pH is decreased, the huperzine A peak cannot be separated from the test sample. The best resolution was observed when the pH was 6.0. Considering the influence of the buffer solution and buffer concentrations, the ammonium acetate buffer system at 80 mM was determined to be the best condition among the buffers and concentrations tested.
In addition, the effects of multiple applied voltage levels were investigated, and 20 kV was determined to be the optimal due to the improved purity and resolution obtained for the huperzine A peak in the test sample. During the implementation of the CE method, imidazole was used as the IS to standardize the peak area and the displacement time of the huperzine A peak. The correlated area parameter was determined by taking the ratio of the peak area to the travel time for huperzine A. Huperzine A has 2 absorption peaks, at 232 and 310 nm. When the 232 nm wavelength was used, the UV absorption of the internal imidazole standard was not suitable. Therefore, 310 nm was used for all following investigation steps.
From the survey results of the electrophoresis conditions, the procedure used to quantify huperzine A in 3 medicinal herbs was designed using the CE machine CZE 7100 Agilent; a diode array detector to detect the absorption at 310 nm; a silica column with an ID of 50 µm; a column length of 56 cm, with an effective length of 50 cm; the buffer solution was 80 mM ammonium acetate, pH 6.0; the column temperature was 25 °C; the applied voltage was 20 kV; the sample was injected at 50 mbar for 5 s; and the electrophoresis time was 15 min.
Our process was suitable and validated according to International Council on Harmonisation (ICH) guidelines. 18 The linear range of huperzine A detection was established for concentrations of 0.001 to 0.5 mg/mL, resulting in a regression equation of ŷ = 0.0167x − 0.0026, with a correlation coefficient (R2) of 0.9994. The LOD for huperzine A was 0.33 µg/mL, and the LOQ was 1 µg/mL. The recovery rates ranged from 98.05% to 100.64%, with RSD < 2%. Applying this CZE process, the concentration of huperzine A in all 3 samples was ∼0.015%.
Conclusion
A fast, simple, and reliable CZE method was developed and validated for the determination of huperzine A contents in H serrata. This electrophoretic assay fulfilled all the requirements to be identified as a reliable and feasible method, including linearity, accuracy, and precision data. The developed CZE method is a highly specific and precise analytical procedure. Therefore, the performance of this method indicates that it is suitable for implementation in pharmaceutical laboratories for the routine analysis of huperzine A in natural resources and can be used as a stability-indicating method.
Footnotes
Acknowledgments
The authors would like to thank the Hochiminh University of Medicine and Pharmacy for funding this work.
Declaration of Conflicting Interests
The authors declared no potential conflicts of interest with respect to the research, authorship, and/or publication of this article.
Funding
The authors received no financial support for the research, authorship and/or publication of this article.