
Abstract
Chemical composition of essential oils (EOs) of Calycolpus genus have been reported in the literature. However, there is only 1 report about volatile profile from Calycolpus goetheanus. This work aims to evaluate the seasonal and circadian influences on EO composition and yield of C. goetheanus collected in Marajó Island, Brazilian Amazon. For the circadian study, the leaves were collected in January (rainy season) and July (dry season) every 3 hours during a period of 15 hours. The EOs were obtained by hydrodistillation and their chemical compositions analyzed by gas chromatography coupled to mass spectrometry and flame ionization detectors. The major compound identified in all EO samples was 1,8-cineole with amounts ranged from 14.4% (January, 6
Calycolpus goetheanus (Mart. ex DC.) O. Berg [syn. Calycolpus glaber (Benth.) O. Berg, Calycolpus ovalifolius O. Berg, Calycolpus schomburgkianus O. Berg, Calycolpus angustifolius L. Riley, Calycolpus cordatus L. Riley, Compomanesia goetheana O. Berg. ex Hemsl., Compomanesia glabra Benth., Myrtus goetheana Mart. ex DC., and Eugenia maranhaoensis G. Don] is a native and nonendemic species from Brazil, commonly known as Goiaba-araçá. It occurs in the Brazilian biomes as Amazon (Pará and Amazonas states) and in the Cerrado (Maranhão state). 1
This species is characterized by shrub or arboreal size, inhabiting water courses or dry land forest as in savannas and in the Amazon. This plant is almost completely glabrous, except for some floral characters like bracts (inner face of sepals and petal margins). Its leaves usually have visible tertiary and marginal ribs, and its flowers have chalice with conspicuous appendages, foliaceous, whose greatest width is positioned in the median region of its lengths. From the morphological point of view, C. goetheanus is very close to Calycolpus roraimensis and Calycolpus revolutus. 1
The chemical analysis of essential oils (EOs) obtained from C. goetheanus has been the subject of only 1 study and reported the occurrence of 1,8-cineole chemotype with predominance of other monoterpenes and sesquiterpenes. 2 Based on the few reports, the present study aimed to evaluate the seasonal and circadian rhythms influences in the yield and chemical composition of the C. goetheanus EO from Marajó island (Amazon), to contribute to the knowledge of its chemotaxonomy.
Results and Discussion
The plant material was collected in Salvaterra (Marajó Island, Brazilian Amazon) (Figure 1). The plant was monitored during an entire day of the months of January (rainy Amazon season) and July (dry Amazon season). For more information, see the Materials and Methods section.
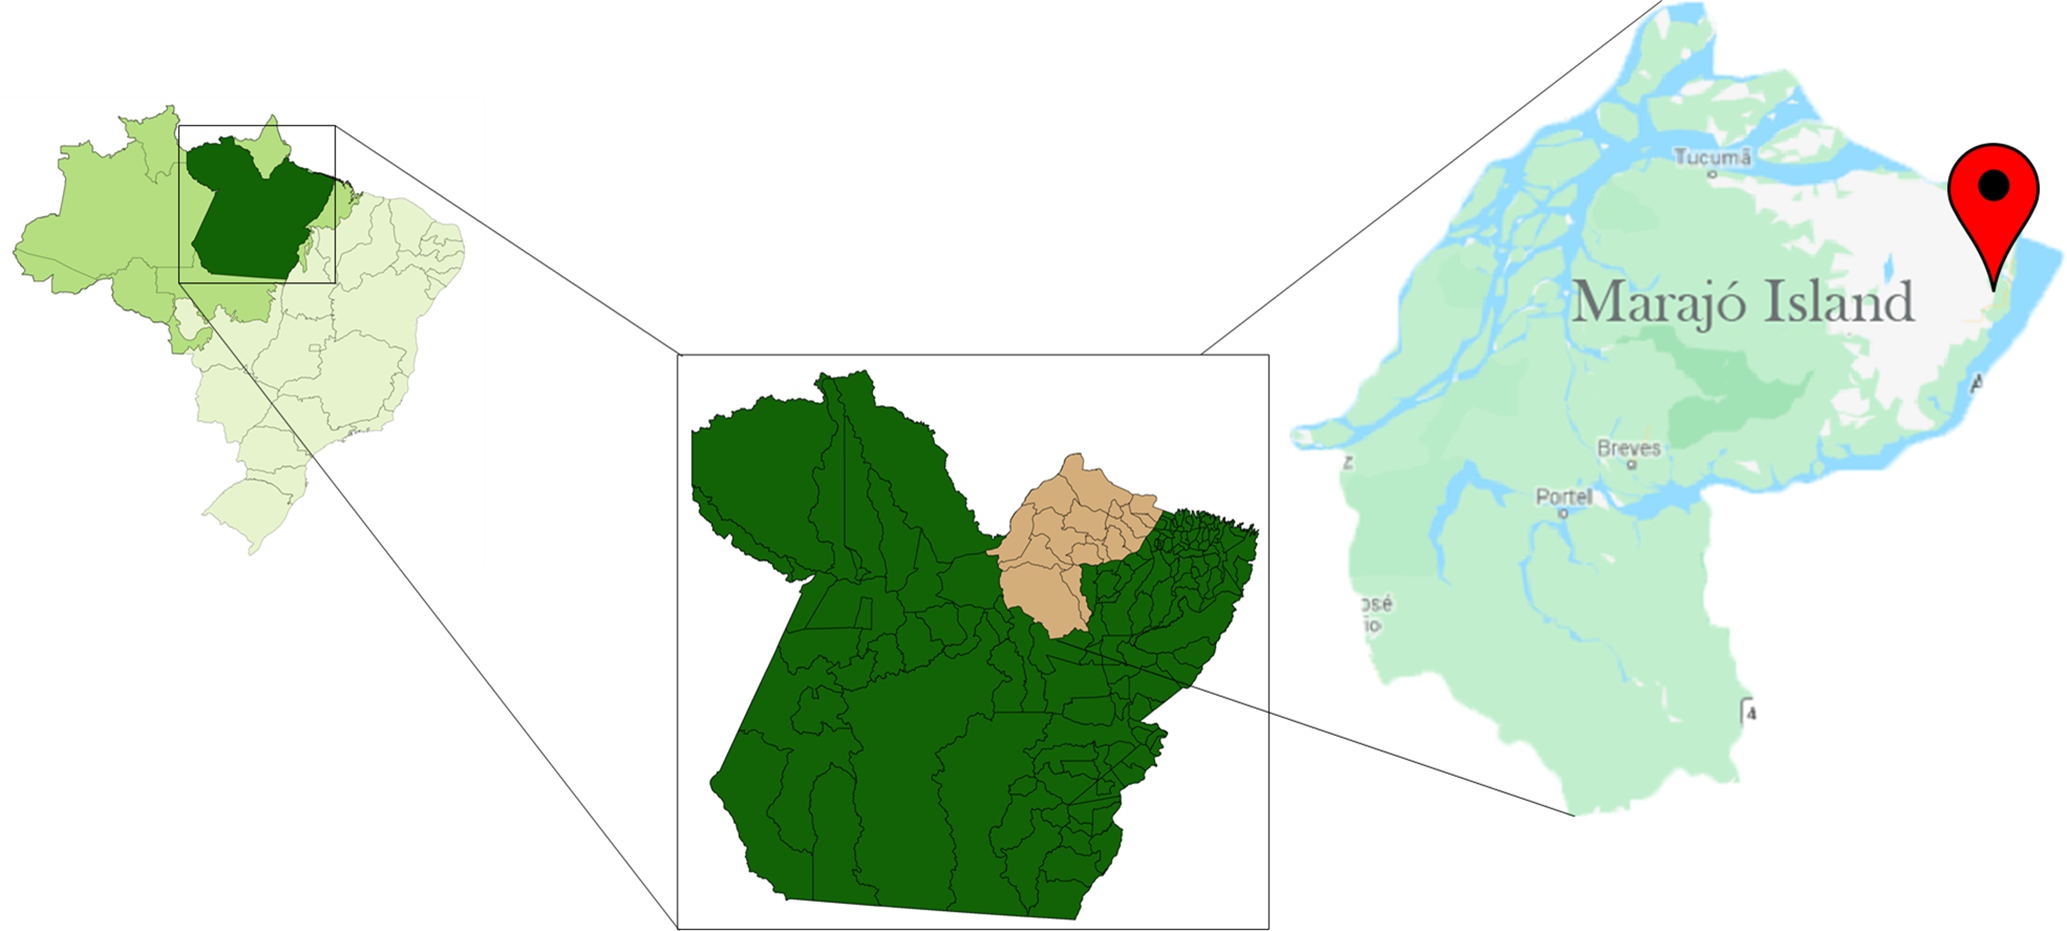
Calycolpus goetheanus collection site.
To evaluate the differences in environmental conditions between January and July, the climate data rainfall, relative air humidity, and solar radiation were obtained from the website of the Instituto Nacional de Meteorologia (INMET, http://www.inmet.gov.br/portal/) of the Brazilian Government.
In January, the rainfall index (153.0 mm) was 4 times greater than in the dry period (35.8 mm). Moreover, the relative air humidity was 81.14% in January and 76.46% in July. Additionally, the solar radiation was higher in July (951.58 kJ/m2) than in January (747.54 kJ/m2). Thus, taking into account the climate parameters, the month of January belongs to rainy season and July to dry season.
The Brazilian Amazonian climate is characterized only by dry and rainy seasons. Due to the permanent humid and warm climate, the Amazon presents spatial and seasonal heterogeneity of rainfall. Based on the precipitation data of 2018, the rainy season occurred from December to April and the dry season from June to November. May was a period of transition between these 2 seasons. 3
In the circadian rhythm of the oil yield of C. goetheanus carried out in July (dry season), the yields ranged from 1.2% (3
The EO yields from the circadian collections of rainy and dry months showed low correlation with the climate parameters: humidity, solar radiation, and temperature (Table 1). In summary, Pearson’s correlation analysis shows no correlation between quantitative parameters of in C. goetheanus EO and environmental conditions.
Correlation Between the Calycolpus goetheanus Oil Yields and the Environmental Conditions.

A previous analysis of C. goetheanus sampled in the municipality of Maracanã, state of Pará, Brazil, showed an oil yield of 1.0%. 2 Also, the species Calycolpus moritzianus collected in Venezuela and Colombia presented the oil yields of 0.08% and 1.0%, respectively. 4,5
The constituents of the oils were identified and quantified by gas chromatography coupled to mass spectrometry (GC-MS) and flame ionization detector (GC-FID), respectively. A total of 101 compounds were identified, representing an average of 95.3% of the composition of the total oils (Table 2). Oxygenated monoterpenes were predominant (20.4%-42.8%) followed by sesquiterpene hydrocarbons (16.8%-46.5%), oxygenated sesquiterpenes (13.9%-36.5%), and monoterpene hydrocarbons (6.6%-14.9%). The main constituents were 1,8-cineole (14.5%-33.0%) and limonene (5.4%-11.7%); followed by α-terpineol (3.5%-7.9%); and α-copaene (3.5%-7.3%), (E)-caryophyllene (0.0%-4.9%), and δ-cadinene (0.0%-9.9%).
Essential Oil Yield (%) and Constituents (%) of Calycolpus goetheanus Sampled in Rainy and Dry Seasons.
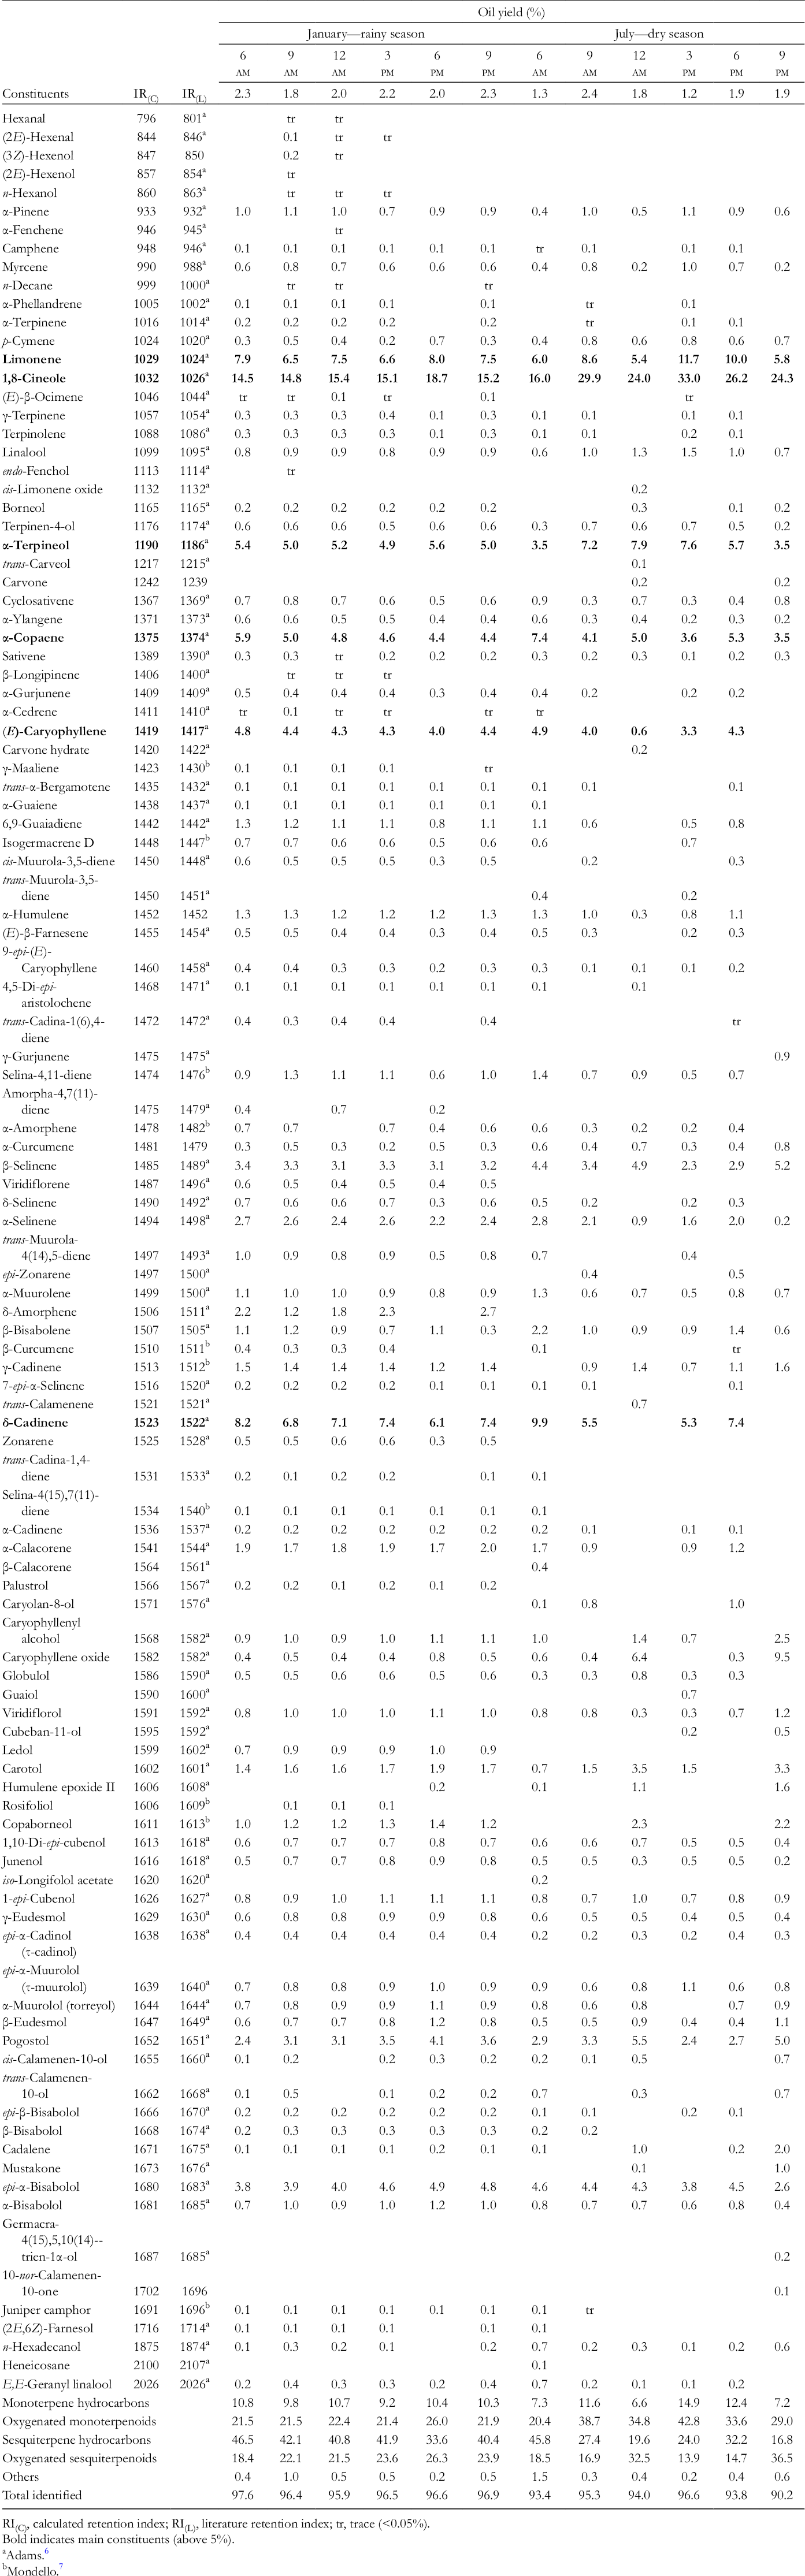
RI(C), calculated retention index; RI(L), literature retention index; tr, trace (<0.05%).
Bold indicates main constituents (above 5%).
aAdams. 6
bMondello. 7
The oxygenated monoterpene 1,8-cineole was the main compound identified in the samples with amount ranged from 14.4% (January, 6

Circadian rhythm of 1,8-cineole content (left) and average during the collections of rainy and dry seasons (right).
The results of Figure 2 suggest that the quantitative variation in the chemical composition of the circadian rhythm could be attributed to the climatic changes, with a strong correlation observed in January. Also, it is possible to see in Table 3 the correlation with the climatic factors: a strong positive correlation between the temperature and the monoterpene hydrocarbons; a significant negative correlation of the sesquiterpene hydrocarbons and the solar radiation; and a positive correlation between the oxygenated sesquiterpenes and the solar radiation. These results were obtained by Pearson’s correlation coefficient analysis, involving the compound classes of the oils and the climatic parameters.
Correlation Between Chemical Compositions and the Environmental Conditions.
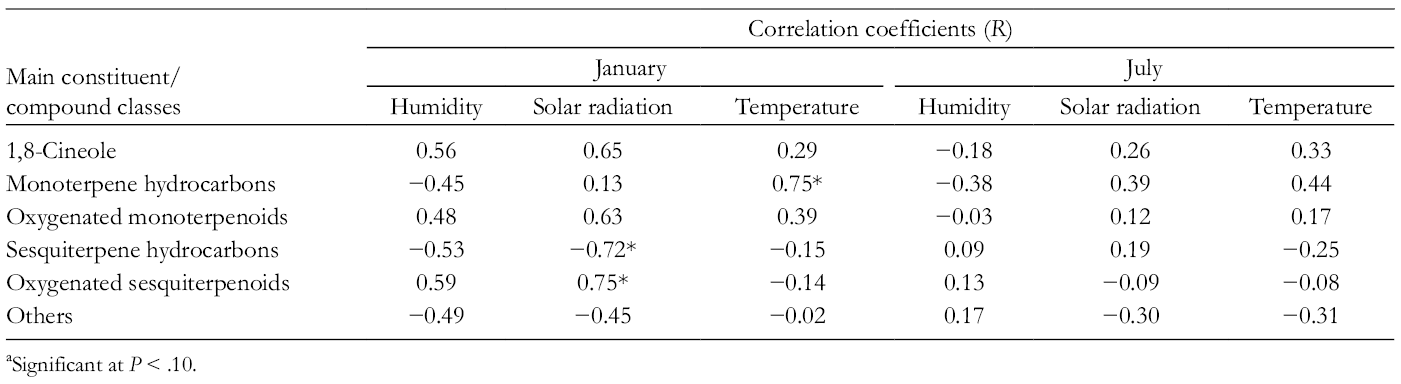
aSignificant at P < .10.
It is known that, in addition to environmental factors, differences in oil yield and composition can be attributed to genetic, geographical, and invasive predators (herbivory and pathogens). 8 For example, some Myrtaceae species have shown qualitative and quantitative variability in their EO compositions according to different collection sites. Oils of Eugenia biflora presented 3 chemotypes: (1) caryophyllane-type, with (E)-caryophyllene and caryophyllene oxide; (2) cadinane-type, characterized by α-cadinol; and (3) aromadendrane-type, with predominance of globulol, germacrene B, and γ-elemene 9 ; oils of Eugenia uniflora, which were classified into 4 chemotypes: (1) selin-1,3,7(11)-trien-8-one and selin-1,3,7(11)-trien-8-one epoxide; (2) selin-1,3,7(11)-trien-8-one, selin-1,3,7(11)-trien-8-one epoxide, and caryophyllene oxide; (3) curzerene, germacrene B, and germacrone; and (4) germacrene B, curzerene, and (E)-caryophyllene. 10 Oils of Psidium guineense, which were grouped into 3 chemotypes: (1) α-pinene and limonene; (2) β-bisabolene and epi-β-bisabolol; and (3) (E)-caryophyllene and caryophyllene oxide. 11
The EO of E. uniflora collected in north of Brazil did not display seasonal variation in oil yield or chemical composition. Environmental factors also had little influence on the composition, displaying curzerene as the principal constituent, with no significant difference between dry (42.7% ± 6.1%) and rainy (40.8% ± 5.9%) seasons. 3 On the other hand, Myrcia sylvatica presented a quantitative variation in its composition attributed to climatic changes, with positive correlation of the temperature and solar radiation with the concentrations of oxygenated sesquiterpenoids and negative correlation with the sesquiterpene hydrocarbons. 12
In order to evaluate the chemical variability during the circadian rhythm, the multivariate analysis by hierarchical cluster analysis (HCA) and principal component analysis (PCA) techniques was applied to the primary constituents present in oils (content ≥1.5%). The HCA (Figure 3) performed with complete linkage and Euclidean distance showed the formation of 2 different groups with similarity of 19.70%. The groups were classified as follows: Group I characterized by the lowest amounts of 1,8-cineole (16.03%-18.67%), which is formed for the samples collected from daily cycle of the rainy season (January) and only 1 sample from dry season (July) collected at 6

Hierarchical cluster analysis of essential oils sampled in the circadian rhythms made with Euclidean distance and complete linkage.
These results were confirmed by the PCA (PC1 and PC2, Figure 4) which explained a proportional variance of 51.3% and 22.7%, respectively, representing a total of 73.0% of data variation. In other words, all samples collected from circadian rhythm of the rainy season (January) and 1 sample from dried season (July, 6

Principal component analysis of chemical compositions of essential oils sampled in a daily cycle of the rainy season (January) and dried season of Calycolpus goetheanus.
The chemical composition and biological activities of Calycolpus EOs have been described in the literature. Calycolpus moritzianus oil, sampled in Venezuela, showed predominance of (E)-caryophyllene (21.9%), α-pinene (10.9%), and viridiflorol (9.7%), this EO displayed antibacterial activity against Staphylococcus aureus and Enterococcus faecalis. 4 The EOs of 40 C. moritzianus specimens collected in Colombia showed as the major constituents 1,8-cineol (12.9%-49.8%), limonene (20.0%-47.1%), (E)-caryophyllene (1.1%-9.9%), and guaiol (2.0%-12.3%). 5 The EO of leaves of Calycolpus warszewiczianus Berg from Costa Rica showed (E)-caryophyllene (30.1%) and caryophyllene oxide (9.8%) as the main constituents. 13
The monoterpene 1,8-cineole (eucalyptol or 1,8-epoxy-p-methane) has a fresh fragrance, camphoraceous features, and a spicy flavor. It is an organic compound naturally found as the main compound in the EOs of many herbs, mainly in the Eucalyptus genus. 14,15 It is widely used as an ingredient in the pharmaceutical and cosmetics industry, for example, in nasal sprays or as a disinfectant as a food flavoring agent. 15 It also showed anti-inflammatory activity, suggesting therapeutic potential as a source for the development of new anti-inflammatory agents, reducing edema induced by histamine and arachidonic acid and granuloma. 16 Moreover, 1,8-cineole has displayed antifungal and antiaflatoxigenic activities against Aspergillus flavus, at a concentration of 250 ppm with dramatic downregulation of aflE and aflL gene expression. 17 A minimum lethal dose of 50 mg/kg for a human adult has been proposed, taking into account the toxic effects of 1,8-cineole. 18
Conclusion
The environmental parameters did not show relationship with oil yield and 1,8-cineole content in the C. goetheanus EO, as well as displaying only quantitative influence on its chemical composition.
The significant oil yield and higher amounts of 1,8-cineole obtained in the dry period indicates that this plant can be used as a renewable source of this compound. Due to the little qualitative variation of its EO chemical profile, the standardization and its economic exploration can be viable.
Materials and Methods
Plant Material and Climate Data
A wild specimen of C. goetheanus was collected in Salvaterra, Marajó Island, Pará state, Brazil (0°45′19.73″S/48°30′41.89″W). For the circadian study, the leaves were collected in January (rainy season) and July (dry season) at the hours of 6
Extraction and Chemical Composition Analysis of the EO
The plant material was air-dried (2 days) at room temperature, after collection. Then, it was ground and submitted to hydrodistillation using a Clevenger-type apparatus (3 hours). 19 The oils obtained were dried over anhydrous sodium sulfate and total oil yields were expressed as mL/100 g of the dried material. 20 The chemical composition analysis was performed by GC-MS, using a Shimadzu instrument Model QP 2010 ultra (Shimadzu, Tokyo, Japan), equipped with a Rtx-5MS (30 m × 0.25 mm; 0.25 µm film thickness) fused silica capillary column (Restek, Bellefonte, United States). Helium was used as carrier gas adjusted to 1.0 mL/min at 57.5 kPa; split injection (split ratio 1:20) of 1 µL of hexane solution (oil 5 µL:hexane 500 µL); injector and interface temperature were 250°C; oven temperature programmed was 60°C to 240°C (3°C/min), followed by an isotherm of 10 minutes. Electron Impact Mass Spectrometry (EIMS): electron energy, 70 eV; ion source temperature was 200°C. The mass spectra were obtained by automatic scanning every 0.3 seconds, with mass fragments in the range of 35 to 400 m/z. The compounds present in the samples were identified by comparison of their mass spectrum and retention index calculated for all volatile components using a linear equation of Van Den Dool and Kratz 21 with data present in commercial libraries as FFNSC 2 7 and Adams. 6 Retention indices were calculated using n-alkane standard solutions (C8-C40, Sigma-Aldrich, St. Louis, MO, United States) in the same chromatographic conditions. The GC-FID analysis was carried out on a Shimadzu QP-2010 instrument, equipped with FID, in the same conditions, except that hydrogen was used as the carrier gas. The percentage composition of the oil samples was computed from the GC-FID peak areas.
Statistical Analysis
The multivariate analysis was performed by using as variables the EO constituents with content above 1.5%. The data matrix was standardized by subtracting the mean and then dividing it by the standard deviation. For HCA, the complete linkage method and the Euclidean distance were used. 9 All analyses were performed using the software Minitab (free 390 version, Minitab Inc., State College, PA, United States).
Footnotes
Acknowledgment
We are grateful to CNPq and CAPES, institutions of support for scientific research of the Brazilian Government.
Declaration of Conflicting Interests
The author(s) declared no potential conflicts of interest with respect to the research, authorship, and/or publication of this article.
Funding
The author(s) disclosed receipt of the following financial support for the research, authorship, and/or publication of this article: We are grateful to CNPq and CAPES, institutions of support for scientific research of the Brazilian Government.