
Abstract
Royal jelly (RJ) is a bee product that has high nutritional value and is beneficial for the human health, earning importance as a functional food. Thus, the characterization of its main biological properties is with high importance. In this work, 6 RJ samples obtained in Morocco, Portugal, and Spain were evaluated in terms of total phenol and flavone/flavonol contents; total protein; 10-hydroxy-2-decenoic acid (10-HDA); volatiles composition; antioxidant and anti-inflammatory properties; and inhibition of tyrosinase, xanthine oxidase (XO), and acetylcholinesterase (AChE) activities. Total phenolic content ranged from 3 to 9 mg gallic acid equivalent/g RJ, and flavone/flavonol content from 0.1 to 0.5 mg quercetin equivalent/g RJ. 10-Hydroxy-2-decenoic acid content varied from 0.9% to 1.2% and total protein from 5.5% to 29.7%. Gas chromatography-flame ionization detector and gas chromatography-mass spectrometry analysis showed RJ volatiles dominated by linolenic acid, 2-decenoic acid, and octanoic acid in variable amounts. The antioxidant activity was monitored through nitric oxide (NO) scavenging activity and hydrogen peroxide (H2O2) scavenging capacity, where the IC50 ranged from 2.3 to 3.4 and 0.2 to 1.5 mg/mL, respectively. Anti-AChE activity IC50 ranged from 0.7 to 4.6 mg/mL, while XO inhibition IC50 ranged from 3.3 to 11.9 mg/mL. The results showed that phenols and flavonoids highly contributed to the RJ biological properties in contrast to 10-HDA and proteins.
Honeybees, Apis mellifera, are a source of a variety of precious and valuable natural products with health-promoting bioactive compounds including honey, bee bread, bee venom, bee pollen, propolis, and royal jelly (RJ). 1 Royal jelly is a milky-white and strongly acidic (pH 3.1-3.9) fluid produced by the hypopharyngeal and mandibular glands of A. mellifera L. young worker honeybees (called nurses). 2 Royal jelly serves as the most important part of honeybee larvae diet, playing a major role in caste differentiation. It is the food given to all young larvae of workers and drones in their maturation process, whereas the queen honeybee is fed RJ for her entire life cycle and nurse honeybees are fed RJ for only 3 days after which worker larvae are fed a mixture of RJ, pollen, and honey. 3
Royal jelly was found to be mainly composed of water (50%-70%), proteins (9%-18%), carbohydrates (7%-18%), lipids (3%-8%), mineral salts (1.5%), vitamins, polyphenols, enzymes, and hormones. 4 A unique and chemically interesting feature in RJ is its lipidic fraction, where 80% to 85% are uncommon short chain hydroxy and dicarboxylic free fatty acids, with 8 to 12 carbon atoms. 2 The main compound, (E)-10-hydroxy-2-decenoic acid (10-HDA), represents more than 50% of the free fatty acid content and its presence has not been reported in any other natural product or even in any other bee related product. In contrast to the protein, lipid, carbohydrate, and phenolic characterization of RJ which has been deeply studied, its volatile fraction has been scarcely discussed. 2
Several pharmacological proprieties have been attributed to RJ among which are antioxidant, 4 anti-inflammatory, 1,5 anti-aging, neuroprotective, 1 antimicrobial, 1,6 anti-allergic, and antitumoral properties. 1 Due to these attributes, RJ has been used in foods, cosmetics, and pharmaceutical industry. 7
The present work aimed at contributing to a better understanding of RJ properties by unraveling the volatile fraction, total phenols, flavonoids, and proteins of RJ from different geographical origins (Morocco, Portugal, and Spain), as well as their in vitro biological properties including antioxidant, anti-inflammatory, anti-acetylcholinesterase (AChE), and anti-xanthine oxidase (XO).
Materials and Methods
Royal Jelly Samples
In total, 6 RJ samples from Morocco (MA), Portugal (PT), and Spain (ES) were studied. Samples from Morocco were purchased from beekeepers in Fès-Boulemane region (RJ1_MA, RJ3_MA, and RJ4_MA) and Rabat-Salé-Kénitra region (RJ2_MA). Samples from Portugal (RJ5_PT) and Spain (RJ6_ES) were purchased from a commercial store. RJ3_MA and RJ4_MA were naturally in powder form, whereas the remaining had a butter-like appearance.
The RJ samples were used fresh in different assays. Except for volatiles study, for proteins (Bio-Rad assay) and 10-HDA evaluations, all RJ samples were diluted in distilled water (50 mg/mL) and ultrasonicated for 60 minutes. After sonication, RJ sample solution were centrifuged for 10 minutes at 5000 rpm and the supernatants were used as the sample solution for the following tests. The samples were stored at −20°C until analysis.
Chemicals
2,2′-Azino-bis(3-ethylbenzothiazoline-6-sulfonic acid) (ABTS), potassium dihydrogen phosphate (KH2PO4), and dipotassium hydrogen phosphate (K2HPO4) were purchased from VWR, Leuven, Belgium. Phenazine methosulfate (PMS), nicotinamide adenine dinucleotide disodium salt hydrate (NADH), and gallic acid (GA) were purchased from Acros organics, NJ, United States. Nitrotetrazolium blue chloride was purchased from Sigma Aldrich Chemie, Steinheim, Germany. Phosphate buffer saline (PBS) was from Fisher Scientific, NJ, United States. Sodium nitroprussiate dehydrate and 2,2′-diphenyl-1-picrylhydrazyl (DPPH) were from Riedel-de Haën, Sigma-Aldrich, Seelze, Germany. Griess reagent system was purchased from Promega Corporation, Madison, United States. Folin-Ciocalteu’s phenol reagent, AlCl3, and hydrogen peroxide (H2O2) were purchased from Panreac Quimica, Montcada i Reixac, Barcelona, Spain. Na2CO3 were purchased from Riedel de Haen (Seelze, Germany, Riedel-de-Haën Laboratory Chemicals, Germany). Quercetin was purchased from Alfa Aesar GmbH & CoKG, Carsluhe, Germany. Acetylthiocholine iodide and AChE (Type VI-S) were from the electric gel Electrophorus electricus; 5,5′-dithiobis(2-nitrobenzoic acid) (DTNB), sodium tetraborate, 5-lipoxygenase (LOX) from soya bean, linoleic acid, mushroom tyrosinase, L-3,4-dihydroxyphenylalanine (L-DOPA), XO, xanthine, and methanol were purchased from Sigma-Aldrich (St. Louis, MO, United States). Boric acid and Tris-HCl were purchased from Merck, Darmstadt, Germany. Bio-Rad reagent was purchased from Bio-Rad laboratories GmbH, Heidemannstrabe, Munchen, Germany. 10-Hydroxy-2-decenoic acid was purchased from TCI, United States, and n-pentane from Carlo Erba reagents, Barcelona, Spain.
Estimation of Total Phenolic Content
The total polyphenol content in RJ sample solution was determined as previously described 8 with a slight modification. Royal jelly sample solution (25 µL) was mixed with 125 µL of Folin-Ciocalteu’s reagent (0.2 N) for 5 minutes, then 100 µL of 7.5% Na2CO3 were added. All samples were incubated at room temperature for 2 hours, and their absorbance was read at 760 nm. The blank solution contained distilled water instead of RJ. The total polyphenol content was expressed as milligram of gallic acid equivalents per gram of RJ (mg GAE/g RJ) using a calibration curve. The concentration range of GA was 0.04 to 1 mg/mL.
Estimation of Total Flavones and Flavonol Content
The method described by El-Guendouz et al 8 was used for total flavonoid determination. Briefly, 100 µL of AlCl3 (20%) was added to 100 µL of RJ sample solution. After 1 hour of incubation at room temperature, the absorbance was measured at 420 nm. The total flavonoid contents were expressed as milligram of quercetin equivalents per gram of RJ (mg QE/g RJ) using a calibration curve of 0.04 to 1 mg/mL.
Determination of Total Protein Content in RJ
Bradford method (Bio-Rad assay) was used to protein content determination with minor modifications. 9 Each RJ sample (250 mg) was suspended in 10 mL methanol/water (50/50; v/v) and sonicated for 60 minutes. Afterward, the pH was adjusted to 2.5 with phosphoric acid and the sample solutions were diluted 10 times. A total of 5 mL of Bio-Rad reagent diluted to 1:5 was added into 200 µL of RJ solutions and the mixture was well vortexed, then the absorbance was measured at 595 nm after 5 minutes incubation. The total protein content was expressed as percentage (%) using the bovine serum albumin standard curve (0.3-1.0 mg/mL).
Determination of 10-HDA in RJ
The 10-HDA content of RJ was determined by high-performance liquid chromatography (HPLC) using an Agilent Technologies 1220 infinity LC liquid chromatograph equipped with a column LichroCART 250-4 (Lichrospher 100 RP-18e, 5 µm). 10 A total of 10 mL of an aqueous methanol solution (50:50 v/v with Milli Q water) was added on 250 mg of RJ samples, sonicated for 60 minutes, and adjusted at pH 2.5 with phosphoric acid. Afterward, the sample solution was diluted 10 times and filtered through a membrane (0.45 µm). A total of 20 µL were injected into the HPLC column to quantify 10-HDA. The mobile phase was constituted by methanol:Milli Q water (60:40) at pH 2.5 adjusted with phosphoric acid. The flow rate was adjusted to 1.0 mL/min, and detection was performed at 225 nm. The concentration of 10-HDA in RJ sample solution was determined using a calibration curve (0.15-80 µg/mL).
Royal Jelly Volatiles Extraction
Royal jelly volatiles were isolated by hydrodistillation for 1 hour using a Clevenger-type apparatus according to the European Pharmacopoeia method. 11 Given the volatiles low yield, they were recovered from the graduated tube of the Clevenger apparatus after rinsing with distilled n-pentane (n-pentane ≥99% purity, HPLC grade, is in lab distilled prior to use, to remove stabilizers that may contaminate the sample, particularly low volatiles yield samples) when the distillation procedure was over, and allowed to settle for about 10 to 15 minutes. For this procedure, the tap was opened anticlockwise, so that the water flowed out of the connecting tube until just below the filling funnel. Distilled n-pentane was introduced in the filling funnel followed by water, so that pentane evaporated, with the residual heat of the distillation flask, and then condensed and dissolved the volatiles over the aqueous phase in the graduated tube. The tap was then opened clockwise to recover the mixture of distilled n-pentane and volatiles in an appropriate vial. The mixture was then concentrated to a minimum volume of about 100 µL, at room temperature under nitrogen flux, using a blow-down evaporator system. After extraction and until analysis, the RJ volatile samples were stored at −20°C in the dark.
Royal Jelly Volatiles Composition Analysis
Gas Chromatography
Gas chromatographic (GC) analyses were performed using a Perkin Elmer Clarus 400 gas chromatograph equipped with 2 flame ionization detectors, a data handling system, and a vaporizing injector port into which 2 columns of different polarities were installed: a DB-1 fused-silica column (polydimethylsiloxane, 30 m × 0.25 mm i.d., film thickness 0.25 µm; J&W Scientific Inc., Rancho Cordova, CA, United States) and a DB-17HT fused silica column [(50% phenyl)-methylpolysiloxane, 30 m × 0.25 mm i.d., film thickness 0.15 µm; J&W Scientific Inc.]. Oven temperature was programmed, 45°C to 175°C, at 3°C/min, subsequently at 15°C/min up to 300°C, and then held isothermal for 10 minutes; injector and detector temperatures, 280°C and 300°C, respectively; carrier gas, hydrogen, adjusted to a linear velocity of 30 cm/s. The samples were injected using split sampling technique, ratio 1:50. The volume of injection was 0.1 µL of a n-pentane-essential oil solution (1:1). The percentage composition of the volatiles was computed by the normalization method from the GC peak areas, calculated as mean values of 2 injections, from each sample, without using the response factors.
Gas chromatography-mass spectrometry (GC-MS)
The gas chromatography-mass spectrometry (GC-MS) unit consisted of a Perkin Elmer Clarus 600 gas chromatograph, equipped with DB-1 fused silica column (30 m × 0.25 mm i.d., film thickness 0.25 µm; J&W Scientific, Inc.) and interfaced with a Perkin-Elmer 600T mass spectrometer (software version 5.4.2.1617, Perkin Elmer, Shelton, CT, United States). Injector and oven temperatures were as above: transfer line temperature, 280°C; ion source temperature, 220°C; carrier gas, helium, adjusted to a linear velocity of 30 cm/s; split ratio, 1:40; ionization energy, 70 eV; scan range, 40 to 300 u; scan time, 1 second. The identity of the components was assigned by comparison of their retention indices, relative to C8-C30 n-alkane indices and GC-MS spectra from a lab-made library, created with reference essential oils, laboratory-synthesized components, laboratory-isolated compounds, and commercially available standards.
Antioxidant Activity
2,2′-Diphenyl-1-picrylhydrazyl free radical scavenging activity
Scavenging of the DPPH radical was assayed following the method previously described 12 with some modifications. Royal jelly sample solution (5-50 mg/mL) with different concentrations were prepared and 350 µL of each solution was added to 650 µL of DPPH solution (60 µM).
The absorbance of sample (Abssample) was read after 30 minutes of incubation time at room temperature and compared with the absorbance of the control (Abscont) in which the sample was replaced by distilled water. The scavenging effect percentage was calculated from the formula [(Abscont – Abssample)/Abscont] × 100. Analyses were carried out in triplicate. The percentage was plotted against the extract concentration, and IC50 values were determined (concentration of sample able to scavenger 50% of the DPPH free radical). Butylated hydroxytoluene (BHT) was used as positive control (0.03-1.00 mg/mL).
2,2′-Azino-bis(3-ethylbenzothiazoline-6-sulfonic acid) free radical-scavenging activity
Determination of the ABTS radical scavenging activity was carried out as reported by El-Guendouz et al. 13 Briefly, the ABTS radical was generated by reaction of a 7 mM ABTS aqueous solution with K2S2O8 (2.45 mM) in the dark, for 16 hours, and adjusting the absorbance at 734 nm to 0.7, at room temperature. Royal jelly sample solution (5-50 mg/mL) (350 µL) were added to 650 µL of ABTS and the absorbance at 734 nm was read after 6 minutes. The capability to scavenge the ABTS+ was calculated using the following formula: ABTS scavenging activity (%) = [(Abscont – Abssample)/Abscont] × 100. Analyses were carried out in triplicate. The sample concentration providing 50% inhibition (IC50) was obtained by plotting the inhibition percentage against RJ concentrations. Butylated hydroxytoluene was used as positive control (0.03-1.00 mg/mL).
Scavenging ability of superoxide anion radical
Scavenging ability of superoxide anion radical was evaluated as previously reported. 12 Superoxide anions were generated in a nonenzymatic phenazine methosulfate-nicotinamide adenine dinucleotide (PMS-NADH) system by oxidation of NADH and assayed by the reduction of nitrotetrazolium blue chloride (NBT). The superoxide anion was generated in 200 µL of phosphate buffer (19 mM, pH 7.4) containing 25 µL of NBT (514 µM) solution, 25 µL of NADH (1989 µM) solution, and 25 µL of different concentrations of RJ (5-50 mg/mL). The reaction was started with the addition of 25 µL of PMS solution (816 µM) to the mixture.
The reaction mixture was incubated at room temperature for 10 minutes and the absorbance reading was performed at 560 nm. The percentage of inhibition was calculated using the following equation: Inhibition = [(Abscont – Abssample)/Abscont] × 100. Tests were carried out in triplicate. The sample concentration providing 50% inhibition (IC50) was obtained by plotting the inhibition percentage against RJ concentrations. Ascorbic acid was used as positive control (0.03-1.00 mg/mL).
Nitric oxide scavenging activity
The nitric oxide (NO) scavenging activity was measured as in Majdoub et al. 14 In this method, 50 µL of different concentrations of each sample (5-50 mg/mL) was added to 50 µL of 10 mM sodium nitroprusside in PBS into a 96-well plate and the plate was incubated at room temperature for 90 minutes. Finally, an equal volume (100 µL) of Griess reagents was added to each well and the absorbance was immediately read at 532 nm. Several concentrations of samples were made and the percentage of inhibition was calculated from the following formula: [1 − (Abssample − Abssample blank)/(Abscontrol − Abscontrol blank)] × 100, where (Abssample − Abssample blank) is the difference in the absorbance of a sample, with or without 10 mM sodium nitroprusside, and (Abscontrol − Abscontrol blank) is the difference in the absorbance of the PBS control, with or without 10 mM sodium nitroprusside. Tests were carried out in triplicate. The sample concentration providing 50% inhibition (IC50) was obtained by plotting the inhibition percentage against extracts’ concentrations. Curcumin was used as positive control (0.03-1.00 mg/mL).
Hydrogen peroxide (H2O2) scavenging capacity
The ability of the RJ extracts to scavenge hydrogen peroxide was determined according to the method of Ruch et al 15 with slight modifications. A solution of hydrogen peroxide (40 mM) was prepared in phosphate buffer (50 mM, pH 7.4). The volume (150 µL) of each RJ concentration (5-50 mg/mL) was added to 600 µL of hydrogen peroxide solution (40 mM), 1 mL of phosphate buffer (50 mM, pH 7.4), and 1650 µL of distilled water. Absorbance of hydrogen peroxide at 230 nm was determined 20 minutes later against a blank solution containing the phosphate buffer without hydrogen peroxide. Tests were carried out in triplicate and the values of IC50 were determined as reported above. Ascorbic acid was used as positive control (0.03-1.00 mg/mL).
Enzymatic Activities
Inhibition of LOX
The inhibition of LOX was carried out as previously reported. 8 The reaction was initiated by the addition of 100 µL of samples, 50 µL linoleic acid (0.001 M), 937 µL borate buffer, and 5 µL 5-LOX solution (0.054 g in 1 mL borate buffer 0.005%, Tween 0.1 M, pH 9), then the absorbance was read at 234 nm after 2 to 3 minutes incubation. The enzymatic reactions were performed in the absence or presence of RJ sample solution (5-50 mg/mL) and their kinetics were compared. The inhibition percentage of the enzyme was calculated and the IC50 values were compared. Analyses were carried out in triplicate. Nordihydroguaiaretic acid was used as positive control (0.03-1.00 mg/mL).
Inhibition of tyrosinase
The evaluation of the inhibitory action of RJ on tyrosinase was performed according to El-Guendouz et al
8
with slight modifications. Briefly, 420 µL phosphate buffer (50 mM, pH 6.5), 200 µL of sample (5-50 mg/mL), and 180 µL of mushroom tyrosinase solution (100 U/mL) were mixed. The assay mixture was incubated at 25°C for 40 minutes. Following incubation, 180 µL of 5 mM
Inhibition of AChE
The AChE inhibition assay was performed following Miguel et al 16 with minor modification. Into 180 µL of Tris-HCl buffer (0.1 M, pH 8), 200 µL of different RJ sample solution (5-50 mg/mL) and 150 µL of AChE enzyme (0.28 U/mL) were added, then the mixture was left to stand for 15 minutes at room temperature. Afterward, 180 µL of iodine acetylcholine (0.005 g in 10 mL of Tris-HCl buffer) and 375 µL of DTNB (0.059 g in 50 mL of buffer) were added and the mixture was incubated for 30 minutes at room temperature. The inhibition percentage of enzyme was calculated as follows: Inhibition = [(Abscont – Abssample)/Abscont] × 100. The analyses were carried out in triplicate. Samples concentration providing 50% inhibition (IC50) was obtained plotting the inhibition percentage against sample concentrations. Galantamine was used as positive control (0.03-1.00 mg/mL).
Inhibition of XO
Xanthine oxidase inhibiting was performed as in El-Guendouz et al. 8 An amount of 200 µL of RJ sample solution (5-50 mg/mL), 350 µL of phosphate buffer (pH 7.5, 50 mM), and 50 µL of XO enzyme solution freshly prepared (0.4 units/mL in phosphate buffer, pH 7.5) were mixed and incubated at room temperature for 15 minutes. Then, 330 µL of 0.150 mM xanthine solution were added and the mixture was reincubated for 30 minutes under the same condition. The absorbance was measured at 290 nm after adding 100 µL of 1 M HCl. The assay was done in triplicate and IC50 values were calculated from the percentage of inhibition. Allopurinol was used as positive control (0.03-1.00 mg/mL).
Statistical Analysis
Statistical analysis was performed with the Statistical Package for the Social Sciences (SPSS) 23.0 software (SPSS Inc., Chicago, IL, United States). Statistical comparisons were made with one-way analysis of variance followed by Tukey multiple comparisons. The level of significance was set at P < 0.05. Correlations between phenol and flavonoid contents and enzyme inhibitory activities were achieved by Pearson correlation coefficient (r) at a significance level of 95%.
The percentage composition of RJ volatiles was used to determine the relationship between different samples by cluster analysis using Numerical Taxonomy Multivariate Analysis System (NTSYS PC software, version 2.2, Exeter Software). 17 For cluster analysis, correlation coefficient was selected as a measure of similarity among all samples, and the Unweighted Pair Group Method with Arithmetical Averages was used for cluster definition. The degree of correlation was evaluated according to Pestana and Gageiro 18 in very high (0.90-1.0), high (0.70-0.89), moderate (0.40-0.69), low (0.20-0.39), and very low (<0.20).
Results and Discussion
Phenols and Flavonoids Contents
Total phenols, flavones, and flavonols found in RJ sample solution are displayed in Table 1 as means ± standard deviation, with each determination performed in triplicate. The comparison of the values between different RJ samples revealed a significant difference between powder form of RJ samples from Morocco RJ3_MA and RJ4_MA and those from Portugal (RJ5_PT) Spain (RJ6_ES), and Morocco (RJ1_MA and RJ2_MA). Total polyphenol content varied from 3.1 mg GAE/g (RJ1_MA) to 9.0 mg GAE/g (RJ3_MA) in RJ samples, while flavonoid content ranged from 0.1 mg QE/g (RJ1_MA) to 0.5 mg QE/g (RJ3_MA) (Table 1).
Phenols, Flavonoids, Protein, and 10-Hydroxy-2-Decenoic Acid Content of Royal Jelly Samples Represented as Mean ± Standard Error.

GAE, gallic acid equivalents; 10-HDA, 10-hydroxy-2-decenoic acid; QE, quercetin equivalents; RJ, royal jelly.
*Royal jelly powder form. Values followed by different letters in the same column are significantly different by Duncan test (P < 0.05).
The values of phenols in RJ samples were higher than those reported by Özkö and Silici 19 for RJ samples from Turkey (59.2 mg GAE/100 g). Other authors 20,21 reported higher amounts of total phenols in local and commercial RJ samples from Romania (14.6-39.9 and 15.4-32.5 mg GAE/g RJ, respectively). Although the amounts of total flavonoids were calculated with a different standard (rutin) from that used in the present work, Nabas et al 22 reported 1.3 ± 0.1 µg rutin/mg RJ in Jordanian RJ samples, much higher than those found in the present work (Table 1). Likewise, the amounts of total phenols (23.3 µg/mg) reported by Nabas et al 22 were also higher than those of the current samples (Table 1).
Protein Content
Like for phenols and flavonoids contents, there was a significant difference in protein content in RJ samples (Table 1). Samples from Morocco and Spain (RJ2_MA and RJ6_ES) presented the highest amount of total protein content (29.7% ± 0.9% and 25.6% ± 0.2%, respectively), while sample RJ4_MA showed the lowest amount (5.5% ± 0.5%).
Kanelis et al 23 found 10.5% to 21.0% of protein in RJ samples from Greece. In the present study, there were 2 samples (RJ2_MA and RJ6_ES) in which the protein content was higher than 20%, the higher percentage reported for Greek RJ. 23 Pavel et al 24 reported that fresh and commercial samples of RJ from Romania presented protein values ranging from 7.1% to 17.7%. Samples from different regions of Bulgaria were tested and similar results to those reported by Pavel et al 24 were found. Balkanska et al 25 reported mean protein values of 16.1% and 13.2%. In the present study, the lowest protein content was observed in powder samples. There are 2 methods considered adequate for determining the total protein content 9 : the Bradford and Lowry methods. According to the authors, both methods are equally sensitive, although the Lowry method being more time consuming. In the present study, both methods were used, and the results were different (data not shown in Table 1). In the Lowry method, samples RJ3_MA and RJ4_MA showed the highest concentrations of proteins (>60%), remarkably high for RJ samples. Therefore, some interferences could have happened between Lowry reagent and some components of RJ such as phenolic compounds. 26 The same samples showed the highest concentrations of phenol and flavonoid compounds (Table 1).
10-Hydroxy-2-Decenoic Acid Content
10-Hydroxy-2-decenoic acid content values were significantly different in RJ samples varying from 0.9% to 1.2% (Table 1). The samples from Spain (RJ6_ES) and Morocco (RJ1_MA) showed the highest 10-HDA amounts (1.2% ± 0.0% in both cases), while the sample from Morocco in the powder form (RJ3_MA) had the lowest values (0.9% ± 0.0%).
The values found in the present work were within the range of values previously described. Ferioli et al 27 reported that 10-HDA content in 14 samples originating from Italy, Australia, China, and South America ranged between 0.8 and 3.2 g/100 g of RJ. Kanelis et al 23 described that the content of 10-HDA in the RJ from different countries ranged from 0.8% to 3.4%.
Several factors could be considered as indicators of freshness and quality during the storage (10-HAD, proteins, moisture, viscosity, and coloration), nevertheless none of them consider the natural variability among RJ samples, 28 as observed in the present work.
Royal Jelly Volatiles
Royal jelly volatiles were obtained in a yield <0.05% (v/w). Their chemical composition was a complex mixture in which up to 66 components were identified. The isolated RJ volatiles are listed in Table 2, following their elution order on the DB-1 column, and arranged according to 2 groups defined by agglomerative cluster analysis (Figure 1).
Percentage Composition of the Volatiles Isolated by Hydrodistillation From Different Royal Jelly Samples.

For samples grouped on each of the clusters and subclusters, see Figure 1.
RI, in lab calculated retention index relative to C8-C30 n-alkanes on the DB-1 column; RJ, royal jelly; 1-4, sample numbers; MA, PT, and ES, two-letter codes for country names Morocco, Portugal, and Spain, respectively; t, trace (<0.05%)
aIdentification based on mass spectra only.
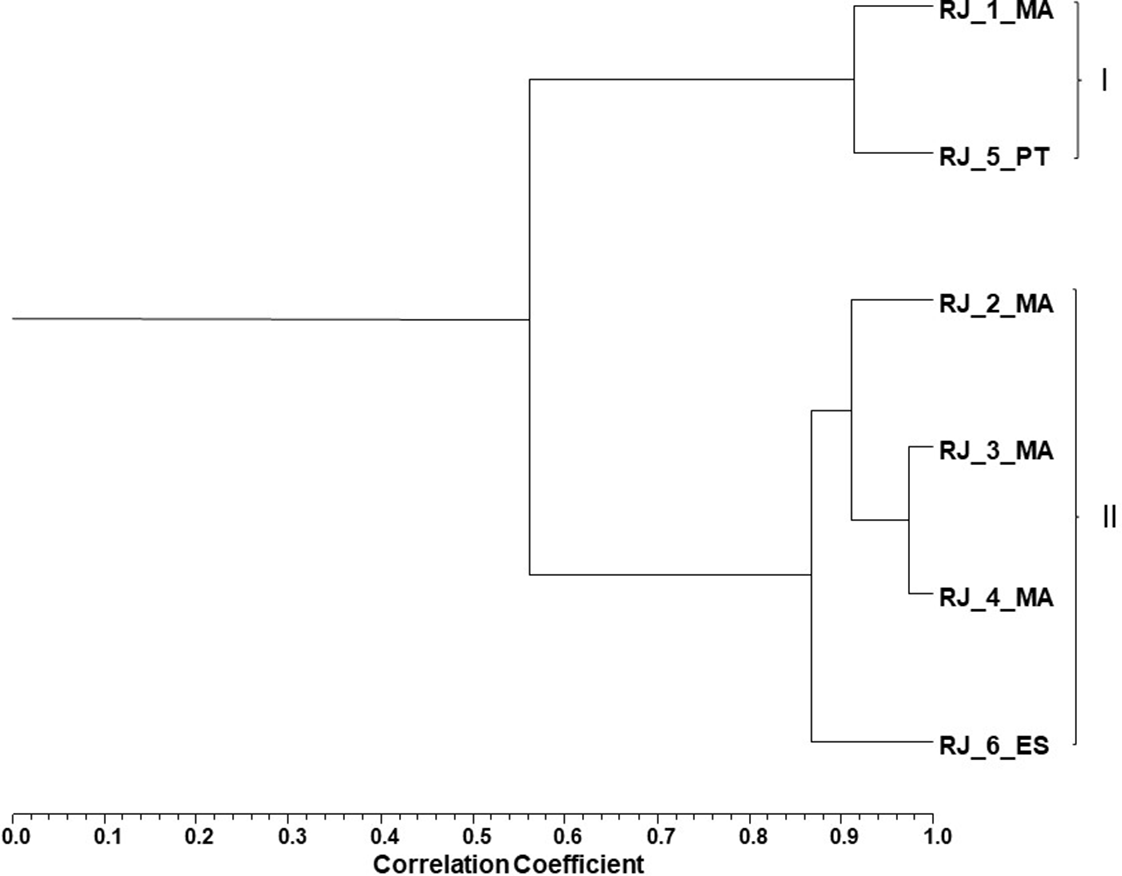
Dendrogram obtained by cluster analysis of the percentage composition of the volatiles isolated from the royal jelly samples evaluated, based on correlation and using Unweighted Pair-Group Method with Arithmetic Average. RJ, royal jelly; 1-4, sample numbers; MA, PT, and ES, two-letter codes for country names Morocco, Portugal, and Spain, respectively.
Cluster analysis showed 2 moderately correlated clusters (S corr >0.54) (Figure 1). Cluster I comprised sample 1 from Morocco and the sample from Portugal, which were dominated by linolenic acid (RJ_1_MA 35% and RJ_5_PT 50%), octanoic acid (RJ_1_MA 17% and RJ_5_PT 18%), and trans-2-decenoic acid (RJ_1_MA 24% and RJ_5_PT 9%). Cluster II included 4 remaining samples, whose volatile main compounds were trans-2-decenoic acid (30%-47%), octanoic acid (21%-38%), and linolenic acid (2%-17%).
It is noteworthy the marked difference in the linolenic acid and trans-2-decenoic acid contents between RJ3_MA (2% and 47%, respectively) and RJ5_PT (50% and 9%, respectively) (Table 2). Other remarkable difference was the n-heneicosane (C21) content between RJ6_ES and the remaining RJ samples. The percentage of this straight chain saturated hydrocarbon in RJ6_ES was 19%, whereas in the remaining RJ samples the percentages did not exceed 0.3% (Table 2). The amounts of n-tricosane (2%), n-pentacosane (1%), and n-heptacosane (1%) were higher in RJ2_MA than in the remaining RJ samples (traces 1%) (Table 2).
The presence of the synthetic antioxidant BHT in RJ4_MA denotes its addition, maybe for preventing oxidation. 2-Furfural (4.6%) only present in RJ3_MA, which is not a constitutive metabolite of RJ samples, may derive from a prolonged storage of this sample or heat exposure before extraction. 29 The plasticizer dibutyl sebacate was detected, despite in relative amount ≤1%, in samples RJ3_MA, RJ4_MA, and RJ6_ES. This may indicate a prolonged storage in plastic containers that should be avoided.
The presence of fatty acids in RJ was also reported by Nazzi et al 30 ; nevertheless, in the present work, hydroxyl derivatives of fatty acids were not detected in the volatile fraction, such as 10-HDA, maybe because of different types of extraction used in both cases. In the present work, the hydroxylated fatty acids may have remained in the hydrolate not being recovered in the above pentane layer. Other factors, such as harvesting time, region of origin, storage method, and processing technology, may determine the differences found between the volatile composition of the current studied samples and those previously reported. 29 -32
Antioxidant Activities
The antioxidant activity was checked by evaluating the capacity for scavenging diverse free radicals (DPPH, ABTS, superoxide, and NO) and H2O2. A significant variability (P < 0.05) of antioxidant properties was found among samples (Table 3). Among all RJ samples, RJ3_MA and RJ4_MA (samples in powder form from Morocco) were in the forefront regarding their antioxidant capacities, showing the lower IC50 values for their ability of scavenging ABTS and DPPH, superoxide, NO free radicals, and H2O2, respectively. The sample from Portugal (RJ5_PT) possessed the higher IC50 in almost all antioxidant assays (lower activity). Samples from Morocco RJ2_MA and the one from Spain (RJ6_ES) presented intermediate IC50 values. Nevertheless, these activities were significantly lower (P < 0.05) to those found for the positive controls (BHT, ascorbic acid, and curcumin) (Table 3). The relative weak antioxidant activity evaluated in in vivo system was already observed, 33 because the increase of the superoxide dismutase, catalase, and gluthatione peroxidase activities as well as the gluthatione levels, in rats with N-methyl-N-nitrosourea induced breast cancer, was not enough to reduce the oxidative stress.
Antioxidant Activity of Royal Jelly, Measured by Distinct Methods and Expressed in IC50 (mg/mL) (Mean ± Standard Error).
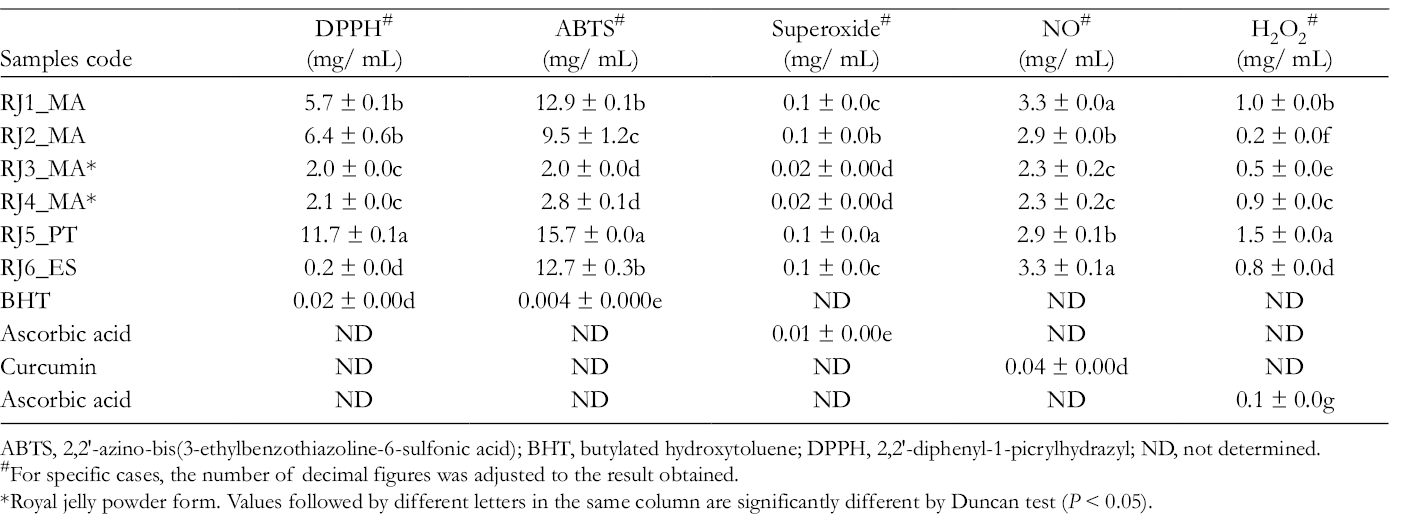
ABTS, 2,2′-azino-bis(3-ethylbenzothiazoline-6-sulfonic acid); BHT, butylated hydroxytoluene; DPPH, 2,2′-diphenyl-1-picrylhydrazyl; ND, not determined.
#For specific cases, the number of decimal figures was adjusted to the result obtained.
*Royal jelly powder form. Values followed by different letters in the same column are significantly different by Duncan test (P < 0.05).
The antioxidant activities increased depending on the concentration of the total phenolic content in the sample, which was supported by the inverse correlation found between the IC50 values and the concentration of total phenols (Table 4). The correlation between antioxidant activities and the amounts of phenols and flavonoids showed the importance of these compounds on the activity, suggesting that the observed antioxidant activity and scavenging ability against active oxygen species and free radicals can be assigned to phenolic fractions in RJ. On the other hand, and opposite to Balkanska et al, 34 who reported 10-HDA to be responsible for 74% of the antioxidant capacity of the RJ samples, in the present work, a positive correlation was detected between the antioxidant activities, expressed as IC50 values, and the total 10-HDA content in the studied RJ samples (Table 4). 10-Hydroxy-2-decenoic acid content influenced negatively the antioxidant activity, since the higher the 10-HDA concentration, the greater the amount of RJ required to provide 50% inhibition.
Pearson Correlation Coefficients Among Total Phenols, Flavonoids, Protein Content, 10-Hydroxy-2-Decenoic Acid, and Antioxidant Activities (IC50).
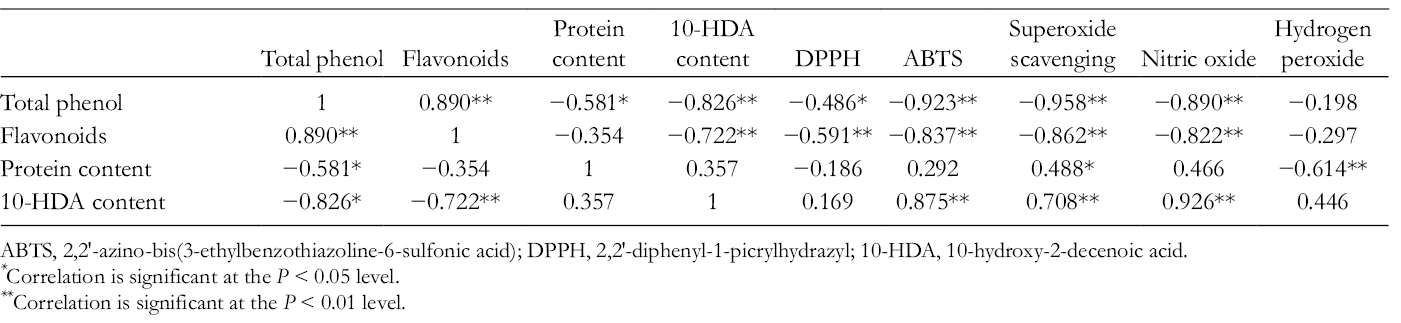
ABTS, 2,2′-azino-bis(3-ethylbenzothiazoline-6-sulfonic acid); DPPH, 2,2′-diphenyl-1-picrylhydrazyl; 10-HDA, 10-hydroxy-2-decenoic acid.
*Correlation is significant at the P < 0.05 level.
**Correlation is significant at the P < 0.01 level.
Some authors 19,35,36 reported that protein and phenolic fractions of RJ have high antioxidant and free radical scavenging activities against reactive oxygen species. The antioxidant properties were attributed to some biomolecules and compounds of RJ such as albumin proteins as well as the polyphenolic compounds. 10,37 In this study, only phenolic compounds contributed to the antioxidant activity, due to the negative correlation observed between total phenol content in samples and IC50 values (Table 4), except for hydrogen peroxide scavenging activity. In this case, proteins revealed to have a role in the capacity for scavenging hydrogen peroxide (negative correlation between IC50 values and total amount in samples), despite the small number of samples used in this assay.
Effects on Inhibitory Activity of Enzymes
Inhibitory properties of RJ on LOX, tyrosinase, AChE, and XO were investigated for all samples and the results are displayed in Table 5.
Enzyme Inhibitory Activities (IC50, mg/mL) of Royal Jelly Represented as Mean ± Standard Error.
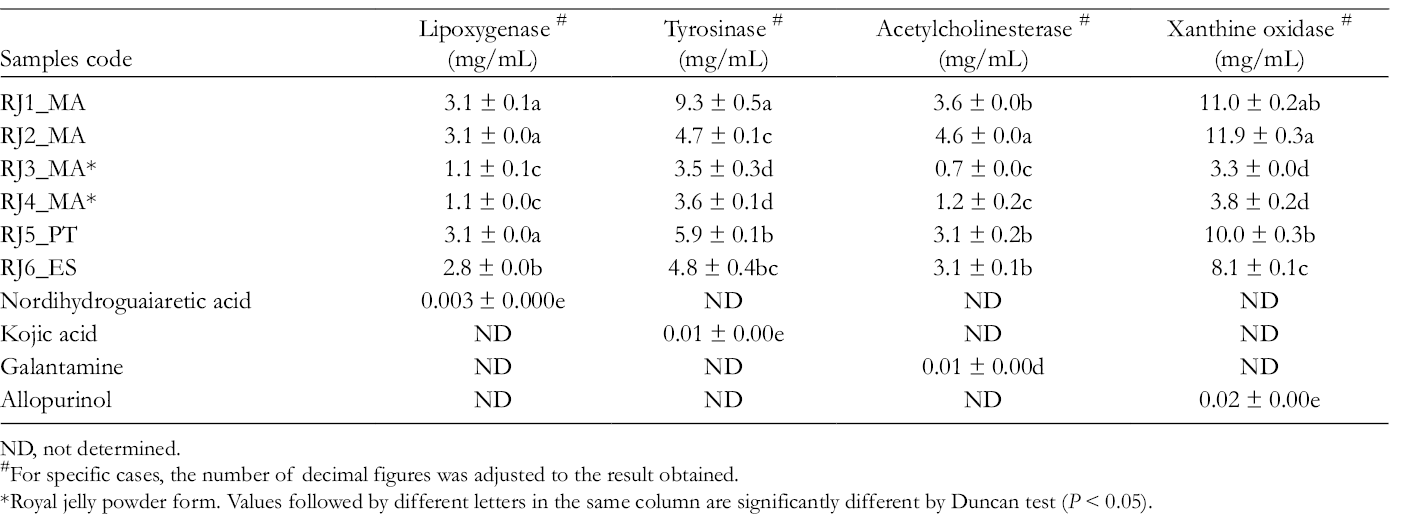
ND, not determined.
#For specific cases, the number of decimal figures was adjusted to the result obtained.
*Royal jelly powder form. Values followed by different letters in the same column are significantly different by Duncan test (P < 0.05).
The screening of the LOX inhibitory activity in RJ samples revealed an important activity (Table 5) with a significant difference between all tested samples (P < 0.05). Both samples from Morocco in powder form, RJ3_MA and RJ4_MA, exhibited the highest capacity to inhibit the 5-LOX enzyme with the lower IC50 values (1.1 mg/mL), followed by samples from Spain (RJ6_ES), Morocco (RJ1 and RJ2), and Portugal (RJ5) (Table 5). However, the exhibited activities were much lower than the positive control, nordihydroguaiaretic acid (Table 5). Moreover, Pearson correlation coefficients among total phenols and flavonoids content and 5-LOX enzyme inhibitory activity (Table 6) demonstrated a high inverse correlation which means that 5-LOX inhibitory activity can be attributed to those groups of compounds.
Pearson Correlation Coefficients Among Total Phenols, Flavonoids, Protein Content, 10-Hydroxy-2-Decenoic Acid, and Enzyme Inhibitory Activities.

AChE, acetylcholinesterase; 10-HDA, 10-hydroxy-2-decenoic acid; LOX, lipoxygenase.
*Correlation is significant at the P < 0.05 level.
**Correlation is significant at the P < 0.01 level.
Diverse studies have demonstrated the anti-inflammatory activity of RJ by suppressing the production of proinflammatory cytokines due to phenolic compounds. 38,39 The present work showed that RJ is also able to inhibit LOX, which has been considered both an indicator of antioxidant and anti-inflammatory activities. 8
Royal jelly samples from Morocco (RJ3_MA and RJ4_MA in powder form) were the most efficient tyrosinase inhibitors (Table 5; IC50 3.5 and 3.6 mg/mL, respectively), followed by samples RJ2_MA from Morocco (4.7 mg/mL), RJ6_ES from Spain (4.8 mg/mL), RJ5_PT from Portugal (5.9 mg/mL), and RJ1_MA from Morocco (9.3 mg/mL). As observed for LOX activity, the positive control, kojic acid, was more active in the inhibition of the tyrosinase enzyme. An inverse correlation was observed between the IC50 inhibition activity and the total phenols and flavonoids content, demonstrating that these compounds have an important role in tyrosinase inhibition (Table 6).
For melanin overproduction disorders, several treatments are based on tyrosinase inhibitor substances, since tyrosinase is the key enzyme in melanogenesis. 40 Han et al 41 investigated RJ samples from Inje County, Gangwon Province, Korea and showed that RJ reduced melanin synthesis by downregulation of tyrosinase mRNA transcription. Peng et al 42 in Taiwan RJ attributed the suppression of skin pigmentation to 10-HDA. In the present work, the inhibition of tyrosinase (IC50 values) is well negatively correlated with the content of phenols and flavonoids, but positively correlated with 10-HDA content (Table 6). The presence of 10-HDA seems to promote the action of tyrosinase since a positive correlation between IC50 values and amounts of 10-HDA was observed in contrast to that observed by Peng et al. 42
All RJ samples investigated during this study exhibited anti-AChE effect (Table 5). Samples from Morocco RJ3 and RJ4 (powder form) exhibited higher AChE inhibitory activity than the remaining samples, with IC50 values of 0.7 and 1.2 mg/mL, respectively. Samples from Morocco (RJ1_MA), Portugal (RJ5_PT), and Spain (RJ6_ES) showed intermediary IC50 values (3.6, 3.1, and 3.1 mg/mL, respectively), while the lowest ability to inhibit AChE activity was for sample RJ2_MA. All samples presented a significant ability for inhibiting AChE (Table 5) but lower than that of galantamine. Furthermore, a strong negative correlation was also found between the amounts of phenol and flavonoids and IC50 values (Table 6).
Alzheimer’s disease (AD) is mainly associated with aging and characterized by a cognitive impairment and irreversible and progressive mental atrophy. 16 Up to date, there is no conclusive treatment for AD, since treatments just delay the progression of the disease and manage some of the symptoms. 14 A common pharmacological therapy for this disease is based on drugs containing AChE inhibitors having the capacity to restore the level of acetylcholine in the brain. Thus, the search for sources of AChE inhibitors is highly required. Recently, Pan et al 43 demonstrated that RJ was able to decrease the levels of oxidative markers such as malondialdehyde and also to diminish the levels of AChE in the brain of ovariectomized cholesterol-fed rabbits, which are more susceptible to AD. Another in vivo study 44 showed that RJ was also able to improve the cognitive ability of rats submitted to trimethylin and to stimulate the regenerating process of the injured hippocampal dentate gyrus.
In the present work, the negative correlation between total phenol and flavonoid contents and IC50 values may suggest that the inhibition of AChE activity is promoted by these compounds. In contrast, the positive correlation between these values and the amounts of proteins and 10-HDA indicates the negative role of these compounds on the anti-AChE activity (Table 6).
All RJ samples investigated exhibited an XO inhibitory activity (Table 5). Overall, significant differences between activities of tested samples were observed. Samples from Morocco RJ3_MA and RJ4_MA (powder form) showed the lowest IC50 (values of 3.3 and 3. 8 mg/mL), that is, a good XO inhibitory activity. Samples from Spain (IC50 8.1 mg/mL), Portugal RJ5 (10.0 mg/mL), and Morocco RJ1_MA and RJ2_MA (11.0 and 11.9 mg/mL, respectively) ranked following the activity. As reported for the other inhibitory enzyme activities, there was a negative correlation between the IC50 and the total phenol and flavonoids, while for 10-HDA and protein contents a positive correlation was observed, therefore an unfavorable action on the biological activity.
Xanthine oxidase is an important enzyme with the function of catalyzing the hydroxylation of hypoxanthine to xanthine and xanthine to uric acid, which is excreted by kidneys. 45 When in excess in the body, uric acid may lead to the gout. Xanthine oxidase plays an important role in various forms of ischemic and other types of tissue and vascular injuries, inflammatory diseases, and chronic heart failure. Indeed, finding new XO-inhibitors is health promising to face several human pathologies, especially inhibitors deriving from natural products. Reports on the action of RJ on XO are scarce. Nagai et al 46 showed that RJ from Japan was able to inhibit XO, and therefore, to diminish the production of superoxide anion radicals, though dark honeys presented better activities. The anti-XO IC50 values observed in the present work for Moroccan, Spanish, and Portuguese RJ, as observed for the remaining enzyme activities, also negatively correlated with the amounts of phenol and flavonoids, but positively correlated with the levels of proteins and 10-HDA (Table 6). The results of the present work show the importance of phenols on the inhibition of XO, AChE, LOX, and tyrosinase. Nevertheless, 10-HDA and protein contents presented a negative role on the same enzyme’s activity.
Conclusion
The studied RJ samples from Morocco, Portugal, and Spain showed antioxidant, anti-inflammatory and AChE, LOX, XO, and tyrosinase inhibitor properties. The negative correlation between IC50 values for antioxidant and enzyme inhibitor activities found in RJ and polyphenolic contents, and the positive correlations between the same IC50 values and HDA or protein contents suggest that the properties can be attributed mainly to polyphenolic compounds and not to 10-HDA or protein contents. On the other hand, the high content of fatty acid present in the RJ samples (mainly linolenic acid, 2-decenoic acid, and octanoic acid) may also be contributing to their biological activities.
From this finding, it can be argued that the modification of RJ samples nature to powder form affected the 10-HDA and other compounds’ content which can reflect on its biological properties. Moreover, and independent of its geographic origin and of its natural variability, RJ biological properties may support its use as healthy food as well as in the prevention and treatment of some diseases and mild ailments.
Footnotes
Declaration of Conflicting Interests
The author(s) declared no potential conflicts of interest with respect to the research, authorship, and/or publication of this article.
Funding
The author(s) disclosed receipt of the following financial support for the research, authorship, and/or publication of this article: Thanks are due to Fundação para a Ciência e a Tecnologia (FCT/MCTES) for the financial support to CESAM (UID/AMB/50017/2019) and to MED (UIDB/05183/2020).