
Abstract
Maize (Zea mays L.) germs are by-products from the milling industry. The objective of this work was to compare the phenolic and lipophilic antioxidant fractions of yellow and white corn varieties, provided by Corn Valley S.r.l. (Piumbega, Mantova, Italy) and among the raw materials most processed by the company. The phenolic fraction, extracted with ultrasound-assisted extraction, alone and in combination with chemical and enzymatic hydrolyses, was analyzed with high-performance thin-layer chromatography and reversed-phase high-performance liquid chromatography-diode array detector. Among the various extraction techniques used, the combination of sonication and alkaline hydrolysis proved to be an effective method for the extraction of phenolic compounds from yellow and white germs, with the highest ferulic acid concentrations (636.54 ± 3.71 and 569.23 ± 1.69 mg FA/g dried extract, respectively), total phenolic contents (844.5 ± 64.6 and 742.8 ± 15.44 mg gallic acid equivalents/g dried extract, respectively), and the best antioxidant activity (14.33 ± 0.48 and 11.41 ± 1.1 µg/mL, respectively). The lipophilic fraction, extracted using supercritical carbon dioxide was analyzed by gas chromatography-mass spectrometry. The unsaponifiable fractions were found to be 2.41% ± 0.24% in yellow corn and 1.85% ± 0.08% in white corn; β-sitosterol, campesterol, and stigmasterol were identified as the main phytosterols characterizing both lipophilic extracts which showed the most effective antioxidant activity (1.29 ± 0.26 mg/mL and 1.33 ± 0.21 mg/mL, respectively) compared with the control. Finally, the phenolic and lipophilic extracts obtained from maize by-products may be reintroduced into the health-oriented market as extracts enriched of high-added value biomolecules with antioxidant activity both as active molecules and as additives of natural origin.
Also known as corn, maize (Zea mays L.) is an herbaceous annual plant 1.5-3 m tall, belonging to the Poaceae family, whose global production is expected to grow by 161 Mt to 1.2 Gt over the next decade 1 ; its final use is represented only partially for human consumption as it is used for livestock feed, ethanol, oil, and sweeteners productions. During the industrial processing, maize is subjected to dry milling which is aimed to remove the germ for the production of low-fat finished products. The large amounts of maize by-products obtained from milling processes are still rich in bioactives, such as phenolic acids and phytosterols, 2 which could be valorized and reintroduced in the health sector as high-added value products as suggested by the European Commission in the last years. The recovery of by-products needs low impact and green strategies as stressed by the green chemistry 3 and thus find more sustainable extraction methods compared to those already used is considered a priority. It has been reported that the maize content of polyphenols is higher than other cereals 4 and phenolic acids are the main compounds representing the phenolic fraction. Ferulic acid (FA, 4-hydroxy-3-methoxycinnamic acid) is the most present phenolic acid in addition to p-coumaric, isoferulic, p-hydroxybenzoic, gallic, syringic and chlorogenic acids, 5,6 quercetin, quercitrin, and kaempferol were identified as the main flavonoids. 5 Despite maize kernel’s pericarp is the most studied fraction, the germ, that so far attracted attention mainly for its oil content, is a good source of free and bound phenolics too. 7 Thus, both hydrophilic and lipophilic fractions of maize germ have possible interesting applications and, with the aim to reduce the amounts of waste products, both fractions are investigated in the present work.
The FA is found mainly bound to cell walls arabinoxylans, and it is responsible for the cell wall rigidity by making crosslinks between lignin and polysaccharides; these bonds make the release of FA available only after strong hydrolysis conditions. The FA have demonstrated various biological activities such as antidiabetic, free radical scavenger, lipid lowering, antioxidant, UV absorber, antiatherogenic, neuroprotective, antiapoptotic, food preservative, antiaging and anticarcinogenic. 8
Maize germ oil content has been counted between 4.7% and 50% and it contains high amounts of unsaturated fatty acids, vitamin E, and phytosterols. 2 Compared with other commercial oils, corn oil has the highest levels of unsaponifiable materials and many studies on phytosterols agree on their anti-inflammatory activity, on their ability to lower cholesterol levels, with decreased risk of coronary heart diseases, and to induce apoptosis in cancer cells. 9 Moreover, vegetable oils are currently used as bioactive ingredients in many cosmetic applications as emollients and ingredients for skin care and treatment: the high content of maize germ oil, its stability in oxygen at low temperatures together with its neutral taste, and color stability, make it interesting in cosmetic and dermofunctional applications. 10
For the extraction of phenolic acids, ultrasound-assisted extraction and 4 hydrolysis methods have been performed. Alkaline hydrolysis (AH) was preferred to the acid one because it was the most performing in the literature 11 and it was compared with enzymatic treatment with feruloyl esterase and xylanase enzymes blend. For the extraction of maize germ oil, supercritical carbon dioxide (SC-CO2) was used because of its efficacy and the numerous sustainability advantages that characterize this technique.
The objective of this study was to find alternative strategies of extraction to obtain antioxidants enriched extracts focusing on both phenolic and lipophilic components of maize germ and to compare white and yellow varieties. The valorization of maize germ by-products could be applied in the health-oriented industry by reducing the extraction times and the environmental impact compared to the common techniques used.
The extraction yields of free and bound phenolics, performed with various techniques, are summarized in Table 1. The extraction of free phenolics through ultrasound-assisted extraction (UAE) gave yields around 12% both with yellow maize (YM) and white maize (WM). The comparison between chemical and enzymatic hydrolyzes gave interesting results: yields are three to six times greater with chemical hydrolyses (P < 0.05).
Maize Germ Extraction Yields, Total Phenolic Content, and Radical Scavenging Activity of Phenolic Extracts.

UAE, ultrasound-assisted extraction; IC50, half-maximal inhibitory concentration.
Different uppercase letters indicated significant differences in each group of data (P < 0.05) for yellow maize germ and white maize germ (analysis of variance).
aTrolox IC50: 3.45 ± 0.2 µg/mL; trans-ferulic acid IC50: 7.83 ± 0.26 µg/mL.
The highest yields were obtained with AH coupled with sonication for both YM and WM (6.22% ± 0.22% and 3.95% ± 0.39% respectively), due to the ultrasound irradiation which increases the penetration of the solvent into the plant matrix and this can increase the solubility of compounds by disrupting cell walls and enhancing the extraction yields. The same effect has probably occurred with the enzymatic treatment whose effectiveness has been slightly improved using previously sonicated plant material compared with the germ extraction (0.98% ± 0.07% and 1.41% ± 0.15% for YM and 0.99% ± 0.09% and 1.11% ± 0.16% for WM) but without statistically significant difference. From the results, it can be noticed that the YM showed slightly average higher yields compared with the WM.
UAE, alkaline hydrolyzed and enzymatic extracts have been analyzed with high-performance thin-layer chromatography (HPTLC) to determine the most suitable method to obtain antioxidant extracts from YM and WM. Figure 1 shows the phenolic profile, visible as brown (254 nm) and light blue (366 nm) spots for each extract. FA (Rf 0.55), the main extraction target, was detected only in the hydrolyzed extracts. Largest spots, corresponding to more concentrated compounds, are detected in the alkaline and alkaline sonicated extracts. The enzymatic treatment allowed the release of FA even if in an apparently lower concentration compared with AH. Figure 1 also reports the 1,1-diphenyl-2-picrylhydrazil (DPPH) bioautographic assay results: the test allowed us to identify the main phenolic fractions responsible for the antiradical activity. The purpose of this test was also to screen the extraction efficacy and to hypothesize a range of activity concentration for the spectrophotometric tests. A greater discoloration of the chromatographic plate corresponds to a greater antioxidant activity of the phenolic components and, in this case, alkaline hydrolyzed extracts showed the highest activity. In the extracts obtained with chemical hydrolysis, there are spots of discoloration even at lower Rf (0-0.2) which probably correspond to phenolic molecules as they are visible at 366 nm as blue spots; the enzymatic hydrolysis instead allowed the extraction of other compounds visible at Rf 0.95, not absorbing at 366 nm and probably not phenolic molecules, which have shown a weak antioxidant activity. Finally, UAE extracts did not show a strong discoloration: only a molecule at Rf 0.45 showed a mild activity.

High-performance thin-layer chromatography plates. (A) UAE extract; (B) AH extracts; (C) enzymatic extracts; (D) DPPH bioautogram of UAE extracts; (E) DPPH bioautogram of AH and enzymatic extracts. Tracks: UAE-1—yellow maize UAE; UAE-2—white maize UAE; 1—yellow maize AH; 2—white maize AH; 3—yellow maize AH sonicated; 4—white maize AH sonicated; 5—yellow maize enzymatic; 6—white maize enzymatic; 7—yellow maize enzymatic sonicated; 8—white maize enzymatic sonicated. AH, alkaline hydrolysis; DPPH, 1,1-diphenyl-2-picrylhydrazil; FA, ferulic acid; UAE, ultrasound-assisted extraction.
Once hypothesized that the main molecule characterizing the extracts is FA, we verified its presence with a reversed-phase high-performance liquid chromatography-diode array detector (RP-HPLC-DAD), as reported in Figure 2. Table 2 reports FA quantification: AH was more effective in extracting FA from both maize matrices (P < 0.05); from the quantification, it cannot be defined whether more FA is contained in YM or WM as the quantity differs according to the extraction technique used: WM germ contained the highest content of FA extracted with 3 hydrolysis methods out of 4, but the highest FA extraction was obtained with alkaline sonicated extraction from YM. In general, the use of ultrasound during both types of extraction (chemical and enzymatic) favored the release of the molecule, even though a significant difference occurred only in the chemical hydrolysis (P < 0.05). AH coupled with sonication showed the best results for YM and WM, respectively, containing 636.54 ± 3.71 and 569.23 ± 1.69 µg FA/mg extract. The use of previously sonicated material was instead a valid method to increase the release of FA. The use of ultrasounds during AH allowed to extract compounds with more effective results in 30 minutes instead of 60 minutes.
Quantification of Trans-Ferulic Acid in Hydrolyzed Extracts.
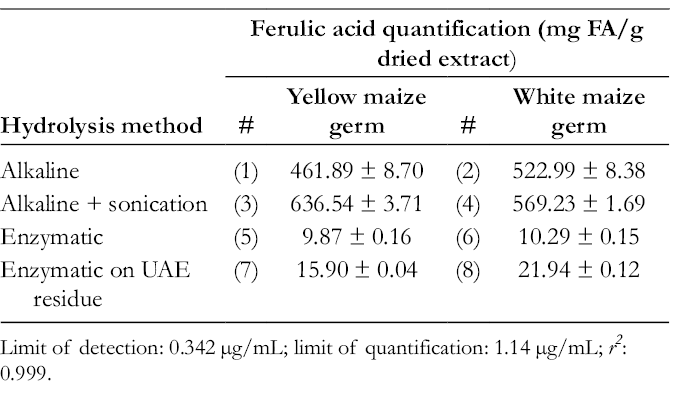
Limit of detection: 0.342 µg/mL; limit of quantification: 1.14 µg/mL; r2 : 0.999.

Reversed phase high-performance liquid chromatography-diode array detector of hydrolyzed extracts. 1—yellow maize AH; 2—white maize AH; 3—yellow maize AH sonicated; 4—white maize AH sonicated; 5—yellow maize enzymatic; 6—white maize enzymatic; 7—yellow maize enzymatic sonicated; 8—white maize enzymatic sonicated. AH, alkaline hydrolysis; FA, ferulic acid.
Similar results were obtained with the total phenolic quantification performed with the Folin-Ciocalteu assay. As reported in Table 1, the use of ultrasounds combined with AH allowed us to obtain greater quantities of phenolic compounds compared with common AH. The extraction of phenolics was more effective using chemical hydrolysis, in particular, coupling sonication to AH: 844.46 ± 64.60 mg gallic acid equivalents (GAE)/g dried extract of YM and 742.80 ± 15.44 mg GAE/g dried extract of WM. No substantial contribution from presonication on the extracted material has been detected in the enzymatic extracts as instead found with the FA quantification (P > 0.05). Comparing the results, the use of enzymes for the extraction of phenolic molecules is more effective than the sonication alone: UAE, in fact, does not release bound phenolics which, in cereal by-products are higher than free phenolics as reported by Acosta-Estrada. 12 Even though the total phenolic contents of UAE extracts are the lowest obtained, they showed to be higher than other free phenolic extracts from corn germ in literature. 2
As hypothesized with the DPPH bioautographic assay, the extracts that exhibited the highest antiradical activity were found to be those obtained with chemical hydrolysis and in particular with the AH coupled with sonication (Table 1). YM germ extracted with the last-mentioned technique showed the highest antiradical activity with a half-maximal inhibitory concentration (IC50) of 11.41 ± 1.1 µg/mL almost comparable to that of FA standard 7.83 ± 0.26 µg/mL. Trolox, a synthetic molecule with strong antioxidant activity, showed only about 3 times higher activity than the extract with an IC50 of 3.45 ± 0.32 µg/mL. A similar result, also in agreement with the previous ones, was found with WM extracted with the same technique 14.33 ± 0.48 µg/mL. AH showed an average value of activity equal to about half obtained by associating the ultrasounds, suggesting the hybrid technique as more effective for obtaining antioxidant extracts particularly from yellow corn germ (statistically different in yellow maize germ). Finally, UAE extracts showed the lowest activity most probably because of the low content of phenolic molecules.
The extraction of maize germ with SC-CO2 allowed to obtain good oil yields with only 10 minutes of extraction, in line with those of literature. 13 In fact, YM oil was found to be almost 20% of the dry weight of the starting matrix, while the WM was around 14%.
The determination of the total unsaponifiable fraction of supercritical fluid extraction (SFE) extracts was evaluated by calculating the percentage of yields obtained after cold saponification and silanization. As reported in Table 3, the highest total unsaponifiable fraction (P < 0.05) was obtained by the YM (2.41% ± 0.24%), while the fraction of the WM was a little lower (1.85% ± 0.08%).
SFE Yields, Unsaponifiable Values, and Radical Scavenging Activity of Lipophilic Extracts.

SFE, supercritical fluid extraction; SC-CO2, supercritical carbondioxide; IC50, half-maximal inhibitory concentration; EVOO, extra virgin olive oil.
Different uppercase letters indicated significant differences in each group of data (P < 0.05) for yellow maize germ and white maize germ (Student’s t-test).
aEVOO COOP IC50: 5.89 ± 0.04 mg/mL; EVOO 14 IC50: 11 ± 0.06 mg/mL.
Each unsaponifiable fraction has been analyzed by gas chromatography-mass spectrometry (GC-MS) in order to characterize the main phytosterol compounds, which have been quantified. As summarized in Table 4, there was no significant difference in the unsaponifiable composition of YM and WM oils. Both YM and WM oils evidenced a great amount of β-sitosterol which is present around 60% (60.72% ± 0.49% in YM and 59.48% ± 0.38% in WM) followed by campesterol (20.98% ± 0.26% in YM and 19.31% ± 0.13% in WM) and stigmasterol (6.21% ± 0.06% in YM and 6.99% ± 0.12% in WM).
Composition (%) of the Unsaponifiable Fractions of Supercritical Fluid Extraction Extracts.

Different letters indicated significant differences in each group of data (P < 0.05) for yellow maize germ and white maize germ (Student’s t-test).
Table 3 also reports the SFE IC50 results for the determination of the antioxidant activity. Extracts showed good antioxidant activity if compared with the controls: YM and WM extracts exhibited IC50, respectively, of 1.29 ± 0.26 mg/mL and 1.33 ± 0.21 mg/mL without any statistical difference (P > 0.05) between each other, which are even better results compared with those of tested extra virgin olive oil (EVOO) (5.89 ± 0.04 mg/mL) and of the literature control EVOO 14 (11.00 ± 0.06 mg/mL).
The high percentages of unsaponifiable compounds in the lipid extracts, β-sitosterol, campesterol, and stigmasterol, in particular, and their physicochemical properties which are ideal for penetration into deeper skin layers for their affinity with cellular membranes lipids, 15 make SFE extracts of corn germ interesting for dermofunctional and cosmetic applications as they could be used as active ingredients or additives of natural origin with radical scavenging activity.
The overall results of the present study confirm the presence of phenolic molecules in the maize germ, predominantly FA in bound form. Among the hydrolysis techniques used for the release of bound phenolics, chemical hydrolysis showed better results than the enzymatic one, in particular by associating sonication to AH. The study confirms the high presence of FA in both maize germs, with a slightly higher content in the WM; the DPPH bioautograms confirms this molecule as the main responsible for the antioxidant activity of the extracts. However, the antioxidant activity is significantly affected by the hydrolysis method used. In fact, by combining AH with UAE, an increase of the extraction efficacy of bound phenolics in maize germ occurred, and consequently an increment of antioxidant activity. This is probably due to the disruption of cell wall materials with the sonication that increases the surface area of the samples and this allows the sodium hydroxide to break more efficiently the ester linkages of FA. The results of this study confirmed the effective applicability of the hydrolysis method 16 on maize germ, which allowed to obtain enriched extracts by associating ultrasounds with AH with low extraction times. A possible application of the extracts in agri-food, cosmetic, or health industries could be more sustainable by using the hybrid hydrolysis technique instead of the commonly used AH.
The high percentage of β-sitosterol, campesterol, and stigmasterol could be interesting for a possible application of SFE extracts in the cosmetic industry thanks to the rapid extraction and to the sustainability of SC-CO2 which, in industrial environments, can be recover without producing consistent extraction scraps. Both phenolic and lipophilic extraction methods from maize germs can be useful in the scale-up study which is essential for the valorization of maize by-products.
Experimental
Plant Material
YM and WM varieties of Z. mays L. germs have been provided by Corn Valley S.r.l. (Piumbega, Mantova, Italy) and obtained after the caryopsis decortication process. After being received, plant material was stocked at −20°C until used and prior to any extraction, it was milled through a 2 mm sieving ring of a Variable Speed Rotor Mill (Fritsch, Germany).
Chemicals
All the solvents and reagents employed for analyses were chromatographic grade. FA standard, Folin-Ciocalteu reagent, Trolox, DPPH, methanol (≥99.9% for HPLC), ethyl acetate, ethanol absolute (≥99.8%), formic acid (98%-100% for HPLC), acetic acid, toluene, natural products-polyethylene glycol reagents (NP/PEG), and gallic acid (TraceCERT), were purchased from Sigma-Aldrich Italy (Milano, Italy). Feruloyl esterase (FAE) from Clostridium thermocellum and endo-1,4-β-xylanase M1 from Trichoderma viride were obtained from Megazyme (Bray, Ireland). EVOO was purchased from COOP Italia (Bologna, Italy).
Ultrasound-Assisted Extraction
UAE was performed in an ultrasonic cleaning bath (Ultrasonik 104X, Ney Dental International, MEDWOW, Cyprus) under a working frequency of 48 kHz following the method of Wang et al. 17 In order to extract free phenolics from maize germ, 5 g of each sample were placed into a volumetric flask (100 mL), filled with a 65% ethanolic solution as extraction solvent and sonicated at room temperature (solvent/solid ratio: 20 mL/g of cereal matrix) for 25 minutes. The obtained extracts were filtered and lyophilized until further use.
Alkaline Hydrolysis
Bound phenolics were extracted as reported by Verma et al 18 from all UAE residues, which have previously had the free phenolics removed. Briefly, 2.5 g of each corn germ was hydrolyzed with 50 mL of 2M sodium hydroxide at room temperature for 1 hour. After AH, the pH of the mixture was adjusted to 3 with 6N hydrochloric acid. Bound phenolics were then extracted 3 times with ethyl acetate. The ethyl acetate extracts were evaporated to dryness under a stream of nitrogen at room temperature and the residue was dissolved again in ethyl acetate, centrifuged 10 minutes at 4000 revolutions per minute (rpm). In order to reduce the extraction time and enhance the extracts’ quality, bound phenolics were also extracted coupling sonication to AH as described by Gonzales et al 16 for other plant matrices, for 30 minutes instead of 60 minutes and then following the same procedure described above for the alkaline conditions. All samples were evaporated to dryness under a stream of nitrogen at room temperature and finally weighed to calculate the extraction yields.
Enzymatic-Assisted Extraction
FAE and xylanase were used for the enzymatic hydrolysis of maize by-products in order to free FA. FAE obtained from C. thermocellum was chosen for its ability to catalyze the hydrolysis of the 4-hydroxy-3-methoxycinnamoyl (feruloyl) group from an esterified sugar. One xylanase from T. viride was used in association with FAE because the endo-hydrolysis of (1,4)-β-D-xylosidic linkages in xylans performed by this enzyme is responsible for a significant enhancement of FA release when associated with FAE in literature. 19 The enzymatic extraction method of Yu et al 20 was taken as a starting reference and subsequently adapted according to the needs of the present work. Thus, for the extractions, 0.1 g of maize germs were hydrolyzed with 0.49 U (1%) FAE and 10 U of xylanase. The possibility of verifying the contribution of ultrasounds was also assessed for this type of extraction, by extracting bound phenolics from UAE residues, which have previously had the free phenolics removed, following the same method. All hydrolyses have been performed with phosphate buffer, for 180 minutes, at pH 4.5, the temperature of 50°C and against a blank. After the enzymatic hydrolysis, the pH of the mixture was adjusted to 3 with 6N HCl. Bound phenolics were then extracted 3 times with ethyl acetate. The ethyl acetate extracts were evaporated to dryness under a stream of nitrogen at room temperature and the residue was dissolved again in ethyl acetate, centrifuged 10 minutes at 4000 rpm. Finally, samples were evaporated to dryness under a stream of nitrogen at room temperature and weighed to calculate the extraction yields.
Supercritical Fluid Extractions
Samples were subjected to SC-CO2 extraction using an Applied Separations (Allentown, PA, USA) model Speed SFE extractor. Two grams of each maize germ were extracted for 10 minutes under the following operating conditions: CO2 flow rate of 2.5 L/min, the oven temperature was set at 40°C, restrictor temperature at 80°C, and pressure at 300 atm. 2
HPTLC of Phenolic Extracts
HPTLC silica gel 60 F254-precoated high-performance thin-layer chromatographic plates (CAMAG, Muttenz, Swiss) with the Linomat V automatic sampler (CAMAG) and WinCATS Planar Chromatography Manager software (CAMAG) were used for the analyses. Twin Trough Chambers (10 × 10 cm) were used and presaturated for 20 minutes with the eluent mixtures. The chromatographic separation of free phenolics was performed following the guidelines of Wagner and Bladt 21 : a 2-step elution method was performed. First mobile phase: ethyl acetate:formic acid:acetic acid:water (100:11:11:20); second mobile phase: toluene:ethyl acetate:acetic acid (100:90:10). Eight microliters of each UAE extracts (20 mg/mL) were put on the chromatographic plate using the automatic sampler.
For the chromatographic separation of bound phenolics, the method described by Barberousse et al 22 was chosen with minor modifications. Eight microliters of each bound phenolics extracts (7 mg/mL) were put on the plate using the automatic sampler. The mobile phase was: chloroform:ethyl acetate:methanol (7:2.5:0.5) + 1% acetic acid. Plates were captured at 254 nm and 366 nm before and after derivatization with NP/PEG in order to highlight the presence of phenolic compounds with TLC Visualizer (CAMAG).
HPTLC Bioautographic Assay for the Evaluation of Antioxidant Activity of Phenolic Extracts
HPTLC bioautographic assay was employed to screen the antioxidant activity of phenolic extracts using DPPH radical and following the method described by Rossi et al. 23 Each extract was applied to an HPTLC plate as described for HPTLC analyses. After development, plates were sprayed with a methanolic solution of 2,2-diphenyl-1-picryl-hydrazyl radical (2 mg/mL) to detect the antioxidant fractions and then photographed at visible light after 30 minutes.
RP-HPLC-DAD Identification and Quantification of FA
The analyses of phenolic acid extracts and the quantification of FA were performed using a Waters modular HPLC system (MA, model 1525) coupled to a DAD (model 2998) linked to a 20 μL sampler loop, following the method described by Robbins and Bean 24 properly modified. The separation of phenolic acids was achieved with a Luna C18 column (Phenomenex, 250 × 4.6 mm; particle size 5 µm); the mobile phase consisted of methanol (B) and 0.1% aqueous formic acid (A) as the binary solvent system. The solvent gradient in volumetric ratios was as follows: 5%-30% B over 50 minutes, held at 30% B for an additional 15 minutes; at 65 minutes the gradient was increased to 100% B and held at 100% B for an additional 10 minutes to clean up the column. The column was thermostatically controlled at 30°C. Injection volume was set to 20 µL. Dedicated JASCO software (ChromNAV ver 2.02.01) was used to calculate peak areas by integration. Following chromatogram recording, sample peaks identification was carried out by comparison of UV spectra and retention times with those of the pure standard. Each tested extract was prepared in a methanolic solution (methanol/water, 80:20) at a concentration of 0.5 mg/mL. Four different concentrations of FA standard were prepared in methanol (5-500 µg/mL), and each solution was injected in triplicate. The obtained calibration graphs allowed the determination of the FA concentration, the most abundant phenolic acid. Limit of detection and limit of quantitation were calculated following the approach based on the standard deviation of the response and the slope as presented in the “Note for guidance on validation of analytical procedures: text and methodology”, European Medicine Agency ICH Topic Q2 (R1).
Determination of Total Phenolic Content
The Folin-Ciocalteu spectrophotometric assay 25 was used to determine the total phenolic content of all extracts with a ThermoSpectronic Helios-γ spectrophotometer and performed according to previously described methods. 26,27 The mean of 3 readings was used, and the total phenolic content was expressed as mg of GAE/ g of dried extract.
DPPH Radical Scavenging Activity of Phenolic Extracts
The DPPH spectrophotometric assay was performed following the method by Cheng et al 28 to evaluate the antioxidant activity of the extracts. Briefly, after 40 minutes of incubation in the dark at room temperature, microplates were analyzed with a microplate reader (Biorad, 680 XL) and the absorbance was read at 515 nm in triplicate against a blank. The DPPH inhibition in percentage was determined by the following formula: IDPPH% 1⁄4 [1 – (A1/A2)] 100; where A1 was the DPPH absorbance with the extracts and A2 without extracts. Eight different concentrations (20-0.16 μg/mL) of Trolox were prepared and used as a positive control. The extracts were concentrated between the range: 3.91-3000 μg/mL. Antioxidant activity of the extract was expressed as IC50, concentration providing 50% inhibition of the radical, and calculated as described by Nostro et al. 29 All experiments were assessed in triplicate and values were reported as mean ± standard deviation (SD).
Determination of Composition of Unsaponifiable Fraction
GC-MS was used to determine the unsaponifiable composition of SFE extracts. Into a 50 mL flask, 10 mg of each extract was cold saponified with 20 mL of 1M methanolic potassium hydroxide; the flask has been placed under constant stirring for 24 hours at a temperature of 28°C. The solution was then extracted twice with 2 mL of n-hexane and 0.2 mL of ethanol using a separator funnel. The n-hexane fractions were then dried using a rotary evaporator after adding anhydrous sodium sulfate: the unsaponifiable fractions were silanized at 80°C with 200 µL of N,O-bis(trimethylsilyl)-trifluoroacetamide and trimethylchlorosilane and 200 µL of pyridine. After 1 hour, the liquid was evaporated under a nitrogen flow then extracted with 0.3 mL of hexane. The products were sonicated for 2 minutes and centrifuged, and the supernatant was injected into the GC. Compounds were identified by comparing their GC retention times and the MS fragmentation pattern with those of literature, with pure compounds (Sigma-Aldrich) and by matching the MS fragmentation patterns and retention indices with the mass spectra libraries NIST and literature.
The GC analysis of the extracts was performed using a Varian 3800 chromatograph interfaced with a Varian SATURN MS-4000 mass spectrometer, with electronic ionization in progress, provided with integrated control software with NIST library. For the GC analyses, the following operating conditions were used: column Varian VF-5 5% poly- and 95% phenyl-dimethyl-siloxane (0.25 mm; length, 30 m; film thickness, 0.25 μ m Agilent Technologies Inc., Santa Clara, California, USA). Injector temperature: 300°C; carrier helium, flow rate: 1.2 mL/min; and split ratio: 1:20. The oven temperature was increased from 230°C to 320°C at a rate of 5°C/min, followed by 7 minutes at 320°C. The MS conditions were ionization voltage: 70 eV; emission current: 20 mAmp; scan rate: 1 scan/s; mass range: 40–650 Da; trap temperature: 150°C, and transfer line temperature: 300°C.
DPPH Radical Scavenging Activity of Lipophilic Extracts
The radical scavenging activity of SFE extracts was performed following the method described above with the modifications reported by Radice et al. 30 Extracts were diluted in n-hexane (0.08-5 mg/mL), after 60 minutes of incubation in the dark at room temperature, the microplates were analyzed with a microplate reader (Biorad, 680 XL) and the absorbance was read in triplicate against a blank at 515 nm. Eight different concentrations (0.16-20 mg/mL) of EVOO were prepared and used as a positive control for SFE extracts. The DPPH inhibition in percent and IC50 values were calculated as described for phenolic acid extracts. All experiments were assessed in triplicate and values were reported as mean ± SD.
Statistical Analysis
All results were means of 3 independent experiments. The presented data show mean values ± SD. The results were evaluated for statistical significance using Student’s t-test for two groups (GraphPad Software, San Diego, California, USA) considering a significant difference of P < 0.05 and univariate analysis of variance for more than 2 groups with Statistica 6.0 software (StatSoft, Inc., Tulsa, OK, USA) and Tukey’s post hoc test to investigate significant differences (P < 0.05) between the tested samples.
Footnotes
Acknowledgments
The authors thank Prof. Pier Paolo Giovannini (Department of Chemical and Pharmaceutical Sciences, University of Ferrara, Italy) for assisting with enzymatic extractions and Corn Valley S.r.l. for supplying the plant material.
Declaration of Conflicting Interests
The author(s) declared no potential conflicts of interest with respect to the research, authorship, and/or publication of this article.
Funding
The author(s) disclosed receipt of the following financial support for the research, authorship, and/or publication of this article. This work was supported by POR FSE 2014/2020 (Emilia Romagna region, Italy), project code: E79D16003170007.