
Abstract
The Traditional Chinese Medicines (TCMs) Astragali Radix (AR) derived from Astragalus membranaceus (Fisch.) Bge. var. mongholicus (Bge.) Hsiao and A. membranaceus (Fisch.) Bge., and Hedysari Radix (HR) derived from Hedysarum polybotrys Hand.-Mazz. (family Leguminosae) are well-known for increasing the tonic effects on “Qi.” A better insight into the specialized (secondary) metabolites is essential to understand the effects of TCM; however, such metabolites remain largely unknown. Here, we performed a metabolomics-based analysis using liquid chromatography-tandem mass spectrometry in 3 plant tissues—periderm, phloem, and xylem—to identify potential bioactive metabolites. Multivariate statistical analysis revealed 29 metabolites showing a significant difference between groups and 10 biomarker candidates of AR and HR. An anti-inflammatory assay showed that the xylem of both AR and HR and the phloem of HR showed higher anti-inflammatory activity than the positive control quercetin in terms of nitric oxide inhibition.
Astragali Radix (AR) and Hedysari Radix (HR) are both well-known Traditional Chinese Medicines (TCMs) derived from different genera in Leguminosae family which show same tonic properties. AR could be replaced by HR in TCM. However, AR is derived from the root (ie, yellow periderm) of Astragalus membranaceus (Fisch.) Bge. var. mongholicus (Bge.) Hsiao and A. membranaceus (Fisch.) Bge, while HR is derived from the root (ie, red periderm) of Hedysarum polybotrys Hand.-Mazz. The 2 TCMs have been shown to possess chemical components with distinct pharmacological activities. 1 Currently, the largest majority of comparative studies reporting the pharmacological actions of both TCM mainly focused on the results obtained via extraction of the whole plant or medical organs based on traditional prescriptions. 1,2 Specialized metabolites are known to be tissue specific within similar types of TCM. 3 Among them, saikosaponins particularly accumulate at the periderm of Bupleuri Radix, 4 while toxic metabolites, such as aconitine, mesaconitine, and hypaconitine, mainly exist in Aconiti Radix. 5 Spanning oligosaccharide esters, saponins, and xanthones detected in Polygalae Radix 6 are mainly present in the phloem, while active saponins, such as notoginsenoside R1, ginsenoside Rg1, ginsenoside Rb1, and ginsenoside Rd of Notoginseng Radix, 7 are primarily detected in the xylem. However, the metabolites present in AR and HR as well as their pharmacological activity remain largely unknown. Such information is notably essential to obtain a deeper understanding in TCM bioactive metabolites. 8 Nevertheless, comparative studies using conventional extraction and separation techniques for the analysis of AR and HR are not only laborious and time-consuming, but also prone to multiple errors.
Metabolomics is a powerful approach to bridge the gap between TCM and their pharmacological actions via the analysis of metabolites. 9 -11 Liquid chromatography-tandem mass spectrometry (LC-MS/MS)-based metabolomics is considered the gold technique for characterization of specialized metabolites in herbal medicines and crops in a high-throughput manner. 12 -14 For instance, abiotic stress responses, identification of nutritional components, as well as internal causes of nutrient changes at different growth stages in plants could be evaluated using LC-MS/MS-based metabolomics. 15 -17 Examples reported include the phenolic variation among Chamaecrista nictitans subspecies and varieties, 18 as well as the identification of the cytotoxic triterpene pristimerin in Salacia crassifolia. 19 Moreover, over 1000 metabolites were detected in cell cultures, characterized, and quantified (relative quantitation) with untargeted metabolomics using LC-MS/MS. 20
In this study, a metabolomics-based approach using LC-MS/MS was implemented to characterize metabolites of different tissues, ie, periderm, phloem, and xylem of AR and HR. Moreover, the anti-inflammatory properties of the identified metabolites were assessed against nitric oxide (NO). The xylem of AR and HR showed good anti-inflammatory activities, which may be related to the presence of flavonoids.
Results and Discussion
Species- and Tissue-Specific Metabolites in AR and HR
Principal component analysis was used to discriminate the species- and tissue-specific metabolites in AR and HR. Forty-eight samples were separated into 2 distinct clusters corresponding to the species, while the periderm, phloem, xylem, and the whole root did not show any specific trend. The species thus shown to have a higher importance in the groups separation for AR and HR compared to different tissues (Figure 1(a)). Indeed, the metabolites detected within different tissues in 1 species were relatively similar, while the metabolites detected in different species but same tissues were different. The latter may be explained by the differences in AR and HR respective genomes.
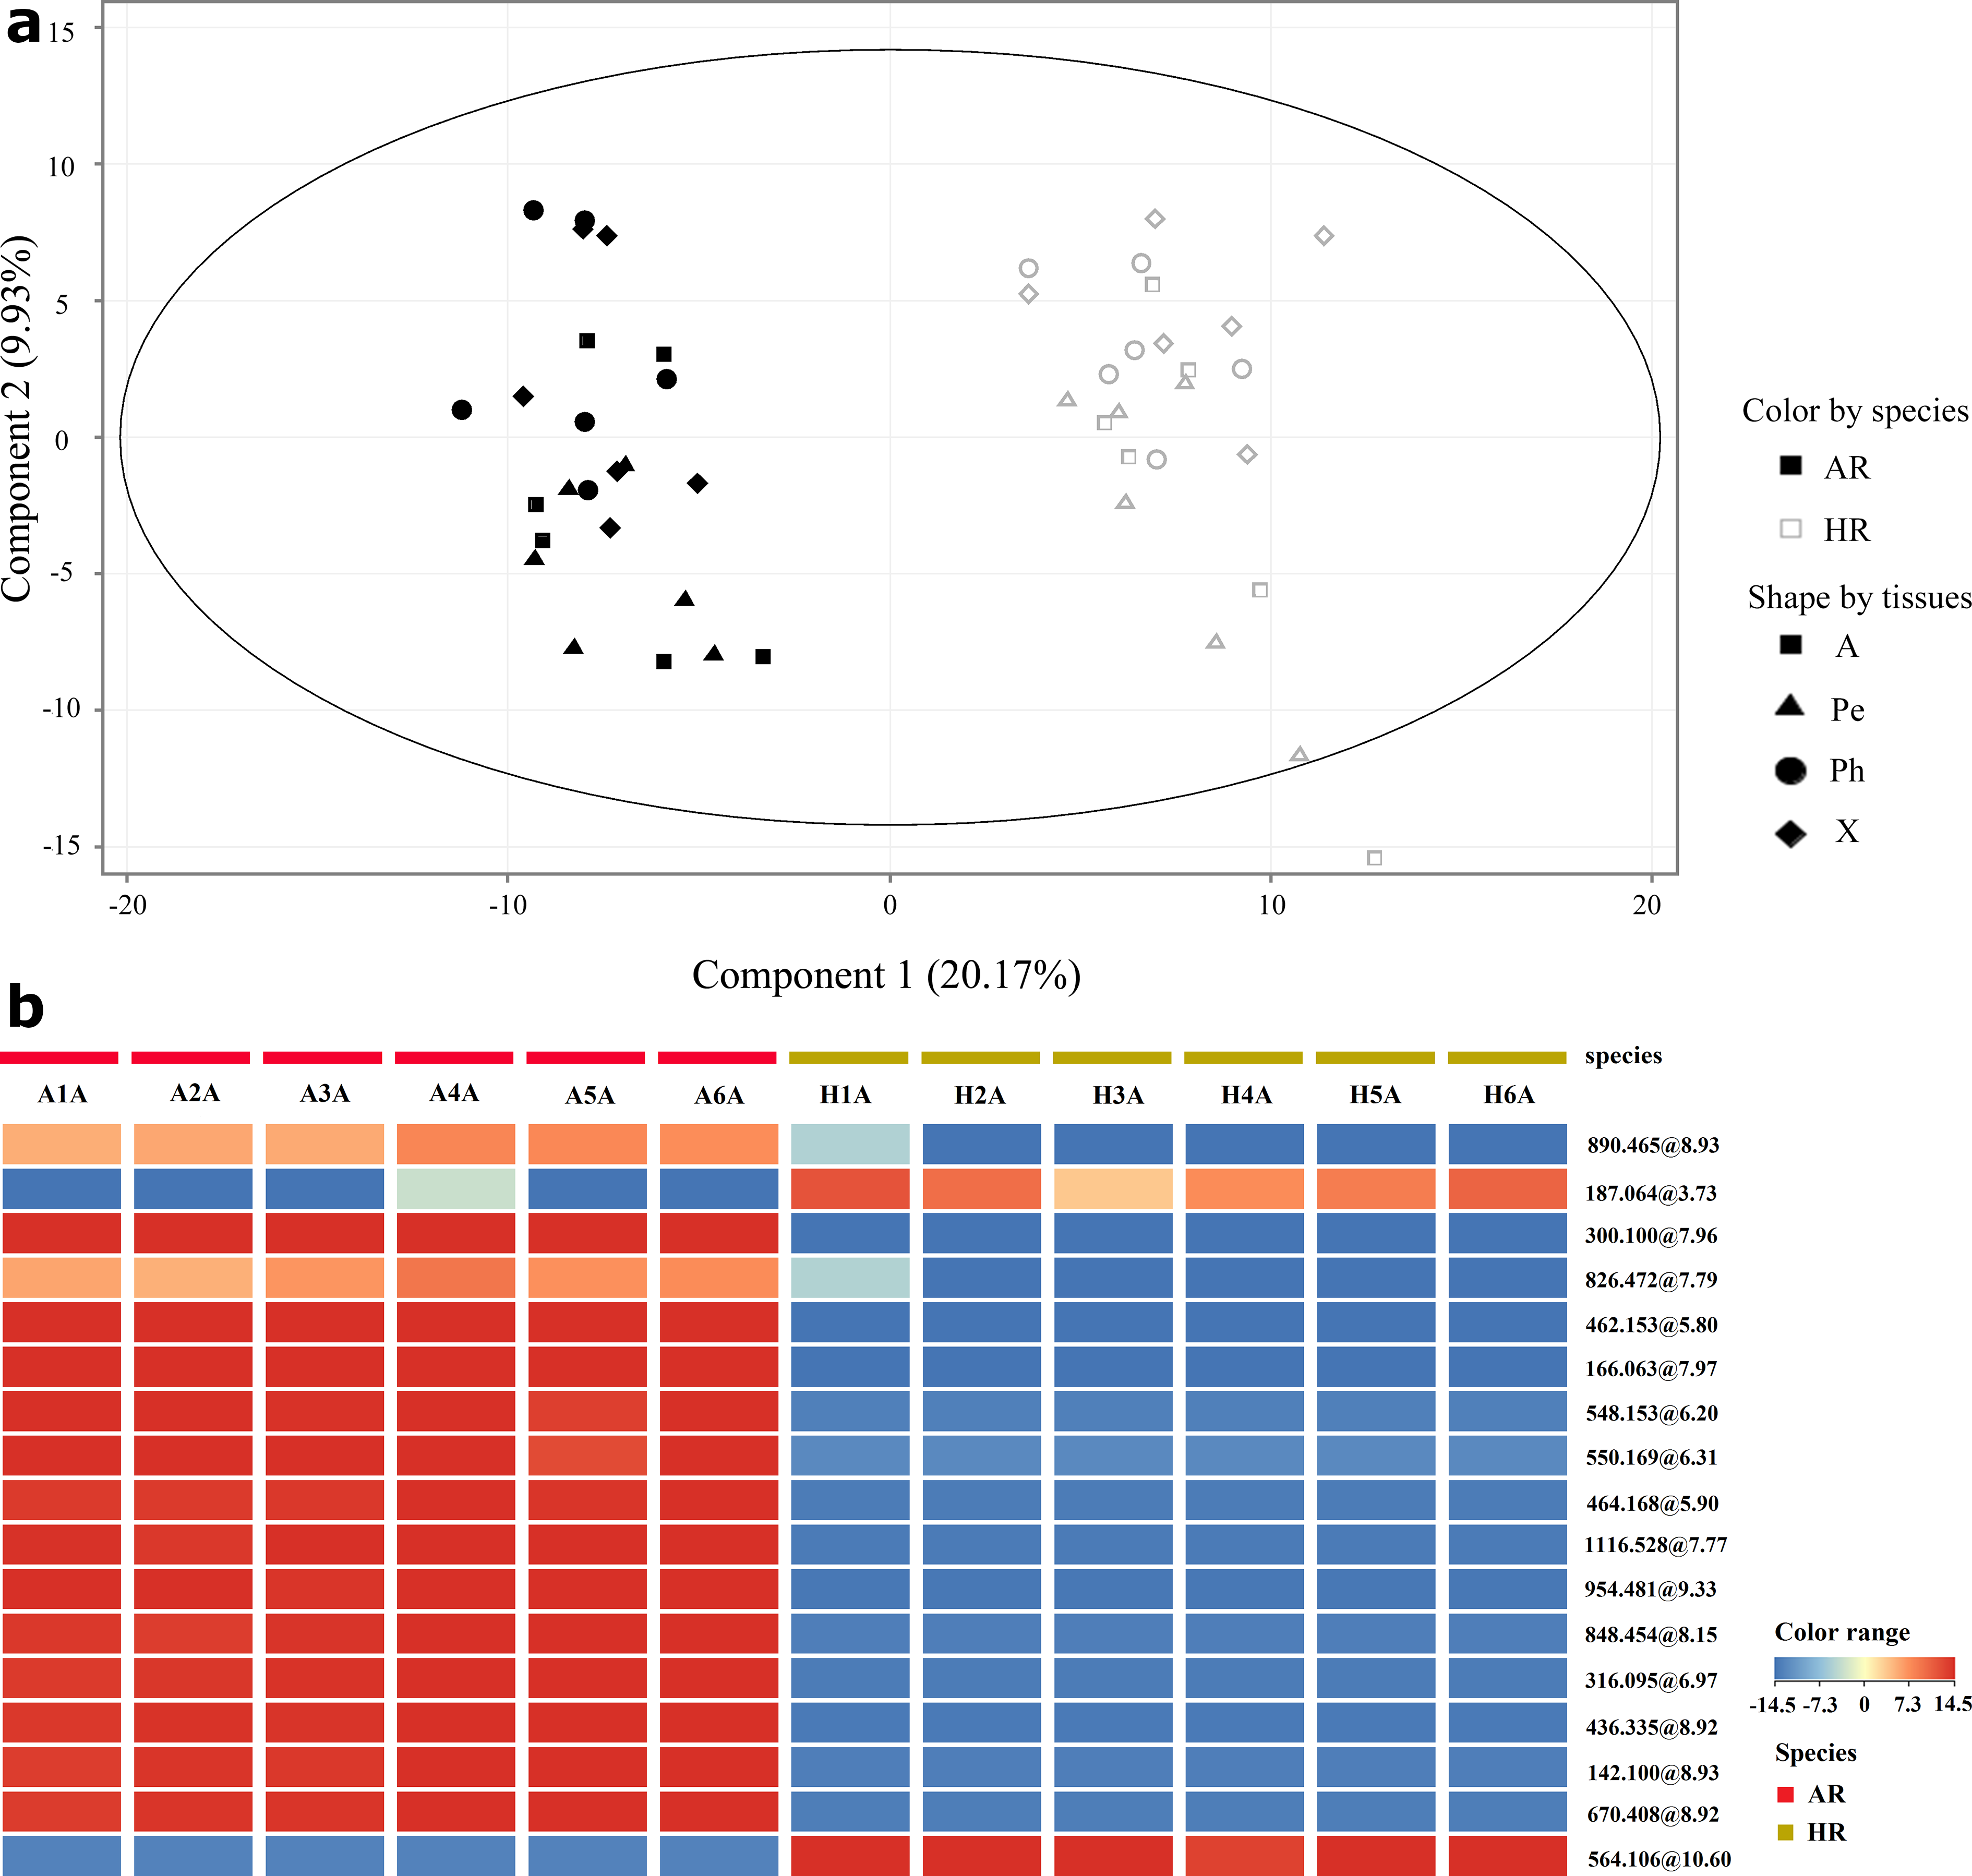
(a) Unsupervised principal component analysis score plot derived from the comparison with Astragali Radix, Hedysari Radix, and their tissues. (b) Heatmap of 17 selected signals in whole root (A) samples of Astragali Radix and Hedysari Radix.
Supplemental Figure S2 shows the extracted compound chromatograms (ECCs) obtained with LC-MS/MS analysis, highlighting the great difference in metabolites detected in AR compared with those in HR and their different tissues. The metabolite classes included isoflavones, pterocarpans, flavanones, and saponins. The typical MS/MS spectra obtained for pterocarpan, isoflavanone, and saponin are displayed in supplemental Figure S3(a) and S3(b). Among 35 main features detected in AR and HR, 8 metabolites were identified unambiguously using the retention time and fragmentation patterns compared with injections of standards, including astragaloside I, astragaloside II, calycosin, calycosin-7-O-glucoside, formononetin, ononin, daidzein, and cycloastragenol. Moreover, 17 compounds were annotated by comparing the MS and MS/MS spectra with the published data, while 3 peaks, including 4H-1-benzopyran-4-one-glucoside, the isomer of 3-hydroxy-9,10-dimethoxypterocarpane, and malonylastragaloside I, were characterized (Table 1). Among all the characterized or identified metabolites, 20 were specific for AR, 7 for HR, and 9 metabolites were detected in both AR and HR (supplemental Figure S2). Astragalosides were not detected in HR (supplemental Figure S2 H2A, H2Pe, H2Ph, and H2X). The levels of l-phenylalanine, calycosin, and formononetin-7-O-glucoside-6″-O-malonate were found higher in AR than HR, while formononetin was more abundant in HR than AR (supplemental Figure S2 A2A, and H2A). The difference in abundance for calycosin, formononetin-7-O-glucoside-6″-O-malonate, and formononetin was consistent with the previous studies which showed higher abundances of these metabolites in AR compared with HR. 21 Overall, the differences in the metabolome between 2 species may explain the differences in pharmacological actions observed for AR and HR in their pharmacological actions. 1,21
Identified Specialized Metabolites Astragali Radix and Hedysari Radix in Extracted Compound Chromatogram.

AR, Astragali Radix; HR, Hedysari Radix.
aIdentified using standard compounds.
bCharacterized.
Identification of Isoflavones in AR and HR
The peak 7 detected at 4.45 minutes in AR with an [M+H]+ ion at m/z 447.129 and MS/MS fragment ions detected at m/z 285.078 [M+H-glu]+, 270.052 [M+H-glu-CH3]+, 253.050 [M+H-glu-CH3OH]+, 229.088 [M+H-glu-2CO]+, and 225.054 [M+H-glu-CH3OH-CO]+ was identified as calycosin-7-O-glucoside. The peak 8 showed the same fragment ions at m/z 285.076, 270.0511, 253.049, and 225.054, as well as a neutral loss of 86.001 Da from m/z 533.130 [M+H]+, indicating a malonyl moiety linked to the calycosin-7-O-glucoside; it was therefore identified as calycosin-glucoside-malonate. 25 The peak 16 detected at 6.17 minutes showed a precursor ion detected at m/z 285.076 with fragment ions detected at m/z 270.0521 [M+H-CH3]+, 253.050 [M+H-CH3OH]+, 229.088 [M+H-2CO]+, 225.054 [M+H-CH3OH-CO]+, 213.055 [M+H-CH3OH-CO2-CO]+, 241.048 [M+H-CH3-CO]+, and 137.023 [1,3A+H]+; it was thus identified as calycosin, which was confirmed via injection of the standard compound.
Pratensein-7-O-glucoside (peak 9), ononin (peak 11), pratensein-7-O-glucoside-6″-O-malonate (peak 12), formononetin-7-O-glucoside-6″-O-malonate (peak 15), formononetin-7-O-glucoside-6″-O-acetate (peak 18), licoisoflavone B (peak 20), formononetin (peak 22), and afromosin (peak 26) all showed a similar fragmentation pattern compared with calycosin-7-O-glucoside (peak 7), calycosin-glucoside-malonate (peak 8), and calycosin (peak 16) (Table 1 and supplemental Figure S2(b)). The former compounds were therefore characterized as isoflavones. Indeed, the fragmentation of those metabolites was likely to lead to the loss of 28 and 56 Da, corresponding to the loss of CO. Moreover, the fragment ions [1,3A+H]+, [1,3B+H]+, and [0,3A+H]+ were likely to be produced via a Retro Diels-Alder reaction. 25
The peak 22 detected at 7.70 minutes with an m/z 269.081 [M+H]+ and MS/MS fragment ions at m/z 253.049 [M+H-CH3]+, 237.054 [M+H-CH3OH]+, 226.062 [M+H-CH3-CO]+, 213.090 [M+H-2CO]+, 197.060 [M+H-CO-CO2]+, and 169.064 [M+H-CH3OH-2CO]+ was identified as formononetin. Moreover, the peaks 11, 15, and 18 were linked to formononetin derivatives; indeed, the [M+H]+ ions detected at m/z 431.134, 517.135, and 473.144, respectively, all yielded the aglycone ion at m/z 269.081 and the characteristic fragment ions at m/z 237.054, 226.063, and 213.095. Assuming a loss of a glucose moiety (162.053 Da), a malonyl-glucosyl moiety (248.054 Da), and an acetyl-glucosyl moiety (204.064 Da), the peak 11 detected at 5.48 minutes was assigned to ononin (confirmed with injection of standard), while the peaks 15 and 18 were annotated as formononetin-glucoside-malonate 26 and formononetin-7-O-glucoside-6″-O-acetate, 27 respectively.
The precursor ions of the peaks 9 and 12 were detected at m/z 463.124 and 549.124, respectively, with MS/MS fragment ions detected at m/z 301.071, 286.049, and 241.049, showing a common aglycone moiety carrying methyl and hydroxy groups. The neutral losses of 162.054 and 248.054 Da from the precursor ions detected at m/z 463.124 [M+H]+ and m/z 549.124 [M+H]+, respectively, indicated a glucose and a malonate-glucose residue linked to pratensein. The 2 peaks were therefore annotated as pratensein-7-O-glucoside and pratensein-7-O-glucoside-6″-O-malonate, respectively. 26
The peak 26 only detected in HR at m/z 299.092 [M+H]+ with MS/MS fragment ions detected at m/z 284.068 [M-CH3]+, 269.043 [M-2CH3]+, 256.073 [M-CH3-CO]+, 239.070 [M-CH3-CO-OH]+, 120.057 [0,3A] +, and 166.061 [1,3B]+ was tentatively annotated as afromosin. 30
Finally, the peak 20 was annotated as licoisoflavone, with a precursor ion detected at m/z 353.230 and product ions at m/z 311.163 [M+H-CH2(CH3)2]+, 300.870 [M+H-2H2O-OH]+, and 153.063 [A+H]+. 28
Identification of Pterocarpans in AR and HR
With their product ions detected at m/z 167.070 [2,3B+H]+, 152.046 [2,3B+H-CH3]+, and 123.044 [1,3A+H]+, respectively, astrapeterocarpan-3-O-glycoside-6″-O-malonate (peak 17), 3-hydroxy-9,10-dimethoxypterocarpane (peak 25), and medicarpin (peak 28) were annotated as pterocarpans. 22,25,31 The peak 17 detected at m/z 549.161 ([M+H]+) and showing fragment ions at m/z 301.109 [M+H-glu-mal]+, 269.075 [M+H-glu-mal-CH3OH]+, 179.066 [1,3B]+, 167.070 [2,3B] +, and 152.046 [2,3B-CH3]+ was annotated as astrapterocarpan-3-O-glucoside-6″-O-malonate. 25 The peak 25, detected at m/z 301.106 [M+H]+ with fragment ions detected at m/z 152.047 [2,3B-CH3]+, 167.070 [2,3B]+, 269.081 [M+H-CH3OH]+, and 270.088 [M+H-OCH3]+, was assigned to 3-hydroxy-9,10-dimethoxyypterocarpane. 22 The peak 14 led to a precursor ion at m/z 301.107 with MS/MS fragment ions detected at m/z 123.044 [1,3A+H]+, 152.046 [2,3B+H-CH3]+, 167.070 [2,3B+H]+, 197.058 [0,3B+H]+, and 253.051 [M+H-OCH3-OH]+. The detected fragments highlighted the presence of 2 methoxy groups on the ring B as well as a hydroxy group on ring A. However, the junction site of the hydroxy or methoxy groups could not be predicted and the compound was thus characterized as an isomer of 3-hydroxy-9,10-dimethoxypterocarpane. The precursor ion of peak 28 was detected at m/z 271.096 with MS/MS fragment ions detected at m/z 256.261 [M+H-CH3]+, 239.072 [M+H-CH3-OH]+, 123.044 [1,3A+H]+, 137.060 [2,3B+H]+, and 147.044 [M-ring B]+ It was thus annotated as medicarpin. 31
Identification of Saponins in AR and HR
We observed that all saponins were detected under the sodium adduct ion. Astragaloside IV (peak 21), astragaloside II (peak 23), soyasaponin I (peak 24), astramembranin II (peak 27), astragaloside I (peak 30), isoastragaloside I (peak 32), cycloastragenol (peak 34), and acetylastragaloside I (peak 35) were identified as saponins by comparing retention time and MS/MS fragments with standard compounds and published data. The peak 24 detected at m/z 943.526 [M+H]+ with the fragment ions at m/z 599.396 [M+H-glu-H2O]+ and 423.360 [M+H-glu-gal-man]+ was annotated as soyasaponin I. 29 The peak 27, which showed the precursor ions [M+Na]+ at m/z 645.398 and [M+H]+ at m/z 623.189, was assigned to astramenbranin II. 27 Using injection of standard compounds, the peak 30 eluting at 8.93 minutes was identified as astragaloside I. The peak 32 was assigned to isoastragaloside I with a precursor ion [M+Na]+ detected at m/z 891.472, yielding the predominant MS/MS fragment ions detected at m/z 831.454 [M+Na-CH3COOH]+ and 711.404 [M+Na-glu-H2O]+. 27 The peak 33 was putatively identified as malonylastragaloside I with its precursor ion [M+H]+ detected at m/z 977.470 and fragment ions detected at m/z 933.484 [M+H-CO2]+, 891.472 [M+H-mal]+, and 849.099 [M+H-mal-COCH3]+. The peak 35 was annotated as acetylastragaloside I, exhibiting a precursor ion [M+Na]+ detected at m/z 933.482 and fragment ions at m/z 879.017 [M+H-CH3OH]+ and 753.418 [M+Na-glu-H2O]+. 27 The peak 21 was identified as astragaloside IV with a precursor ion [M+Na]+ detected at m/z 807.450 and the fragment ions detected at m/z 627.384 [M+Na-glu-H2O]+. Finally, the peak 23 was identified as astragaloside II with a precursor ion [M+Na]+ detected at m/z 849.461 and a fragment ion detected at m/z 669.393 [M+Na-glu-H2O]+. Both astragaloside IV and astragaloside II identity were confirmed using injection of standard compounds.
Astragalosides belong to the compound class of cycloartane tetracyclic triterpenoids. The biosynthetic pathway leading to the formation of astragalosides is derived from the mevalonic acid pathway. The structural genes involved in the biosynthesis of cycloartenol from mevalonic acid have been already elucidated. 32 However, the biosynthesis of astragalosides issued from cycloartenol remains unclear, but may probably involve several cytochrome P450 and glucuronosyl transferase enzymes. In the present study, astragalosides could not be detected in HR. Therefore, the comparison of the transcriptome and metabolome data of AR and HR may contribute to a better understanding of the astragalosides biosynthetic pathway.
Identification of Other Compounds in AR and HR
By comparing the obtained spectra with the published data, peak 1, peak 3, and peak 4 were annotated as l-phenylalanine, spinonin, and indolelactic acid, respectively. Indeed, the peak 1 exhibited a precursor ion [M+H]+ detected at m/z 188.071 with MS/MS fragment ions detected at m/z 143.037 [M+H-COOH]+ and 127.054 [M+H-COOH-NH2]+ and was therefore annotated as l-phenylalanine. 22 The peak 3 was annotated as spinonin, with a precursor ion [M+H]+ detected at m/z 461.142 and the fragment ion detected at m/z 299.087 [M+H-glu]+. 23 The peak 4 was annotated as indolelactic acid with a precursor ion [M+H-H2O]+ detected at m/z 188.071 and fragment ions at m/z 170.058 [M+H-2H2O]+, and 143.043 [M+H-COOH]+. 24 Finally, the peak 13 showed a precursor ion [M+H]+ at m/z 301.106 with MS/MS fragment ions detected at m/z 323.091 [M+H-glu]+, 268.152 [M+H-glu-C4H7]+, 225.114 [M+H-glu-C4H7-CH3-CO]+, 170.036 [5B] +, and 151.108 [A+H]+. It was thus characterized as 4H-1-benzopyran-4-one-glucoside.
Screening and Identification of Metabolites in AR and HR
In order to investigate the metabolome differences between AR and HR, 12 samples representative of the whole root of AR and HR were analyzed. Two statistical methods, ie, partial least square discriminant analysis (PLS-DA) and a Mann-Whitney t-test, were used for group comparison and selection of potential biomarker candidates. Using the PLS-DA model, samples of AR and HR were unambiguously separated by only 1 component. The R
2
X, R
2
Y, and Q
2
Y of the PLS-DA model were 0.511, 0.993, and 0.982, respectively. The PLS-DA model was evaluated with both a 7-fold cross-validation test and a permutation test (200 permutations). The model showed 100% accuracy with the available data. Potential biomarkers’ candidates were then selected based on their variable importance on projection (VIP) values and P-value obtained with the Mann-Whitney
The Selected Potential Biomarker of Astragali Radix and Hedysari Radix.

AR, Astragali Radix; HR, Hedysari Radix; MS, mass spectrometry; VIP, variable importance on projection.
aCharacterized.
bIdentified using standard compounds.
A Venn diagram was used to investigate the differences and similarities between metabolite profiles of AR and HR. Overall, 139 and 62 specific metabolites were observed in AR and HR only, respectively, which is lower than the number of common metabolites (Figure 2). The Venn IDs of AR and HR metabolites are shown in supplemental Table S2. These results show that even though AR and HR were derived from different Leguminosae families, they share a lot of common metabolites (ie, 255 metabolites). This might explain why HR can be used instead of AR in TCM. However, great differences between the metabolite profiles were observed, where AR showed 2 times more specific metabolites compared with HR. A NO inhibition assay and a toxicity assay were therefore carried out to investigate the bioactive differences between AR and HR.

Venn diagram of pairwise analyses Astragali Radix vs Hedysari Radix.
Screening and Identification of Different Metabolites Present in Different Tissues of AR and HR
The presence of different metabolites in different tissues was evaluated via separate analysis of AR and HR. An unsupervised hierarchical component analysis (HCA) was used to describe the intrinsic variations between the tissues and their metabolites (supplemental Figure S4). The phloem and xylem could not be separated using HCA, suggesting a similar metabolite profile in these 2 tissues. However, the metabolite profile observed in the periderm was considered different from the phloem or xylem, in both AR and HR. These results were confirmed by the ECCs obtained with AR and HR analyses (supplemental Figure S2). Our results show that isoflavonoids, including ononin, calycosin-7-O-glucoside, calycosin-glucoside-malonate, and formononetin-7-O-glucoside-6″-O-malonate, were mainly detected in the phloem and the xylem, while saponins, such as astragaloside IV, astramembranin II, astragaloside I, isoastragaloside I, malonylastragaloside I, cycloastragenol, and acetylastragaloside I, were mainly found in the periderm. This difference may result from tissue-specific expression of isoflavonoid and saponin biosynthetic genes.
Anti-inflammatory Activity of AR and HR
A NO inhibition assay was used to estimate the anti-inflammatory activities of AR and HR. For each group, the NO inhibition was compared with positive control (supplemental Table S3). Figure 3 showed the Box plots obtained for the measured NO inhibition in AR and HR, and within their respective tissues. To the best of our knowledge, this is the first time that the anti-inflammatory activity of different tissues of AR and HR is reported. Overall, no significant difference in NO inhibition has been observed among AR, HR, and the positive control group (Figure 3). This probably explains why HR has been replacing AR in ancient China. However, a higher anti-inflammatory activity was observed for the xylem of AR and HR, as well as the phloem of HR. Indeed, the NO inhibition rate measured in the xylem of AR was significantly higher than that measured in other tissues of AR, indicating that the active compounds of anti-inflammatory activity are mainly present in the xylem. Combined with the results obtained with LC-MS/MS analysis (supplemental Figure S2), this indicated that the specific metabolites present in the xylem of AR are responsible for this increased anti-inflammatory activity compared with the phloem, probably explained by the presence of isoflavones in the xylem. The NO inhibition rate of HR displayed the same trend, ie, a better anti-inflammatory activity observed in the xylem compared with the other tissues. The NO inhibition activities of AR have already been reported previously. 33 Moreover, formononetin, 34 calycosin, 35 and soyasaponin I 36 have been reported to significantly inhibit the NO production; therefore, the active ingredients of both AR and HR were considered. Ononin, 37 astragaloside IV, 38 and isoastragaloside I 39 in AR and indolelactic acid 40 and afromosin 41 in HR have also reported the function in the NO production inhibition, which may be related to the anti-inflammatory activity of AR and HR.

The NO inhibition of Astragali Radix and Hedysari Radix and their different tissues.
Finally, a Venn diagram was built to select the specific metabolites present in the xylem of AR and HR (supplemental Figure S5). A total of 7 and 4 specific metabolites were selected, respectively. Future perspectives of this study include the identification and validation of such active compounds in AR and HR, combined with the related biosynthetic pathway.
Conclusion
In this study, an LC-MS/MS-based metabolomics approach was for the first time used to investigate the metabolite differences between AR and HR, as well as among different tissues, together with their anti-inflammatory activities. Overall, 29 main chromatographic peaks and 10 biomarker candidates detected in AR and HR were identified, annotated, or characterized. Among different tissues, the phloem and xylem showed a similar metabolic pattern compared to the periderm, and this in both AR and HR. The xylem demonstrated a better activity than that of the two other tissues, showing its probable role in the anti-inflammatory activity of AR and HR. The metabolite differences underlined in this study and different anti-inflammatory activities observed between different tissues provide novel insights for future screenings of active components and their biosynthetic pathways.
Experimental
Materials and Reagents
Liquid Chromatography-Tandem Mass Spectrometry Analysis
Authentic standards of astragaloside I, astragaloside II, calycosin, calycosin-7-O-β-d-glucopyranoside, formononetin, ononin, and daidzein were purchased from Chengdu Pufei De Biotech Co., Ltd. (Chengdu, China). Astragaloside IV was purchased from Chengdu King-tiger Pharm-chem Tech. Co., Ltd. (Chengdu, China) and cycloastragenol from Chengdu RefMedic Biotech Co., Ltd. (Chengdu, China). Water and formic acid, both LC-MS grade, were purchased from Merck (Darmstadt, Germany). Acetonitrile and methanol, both LC-MS grade, were purchased from Beijing MREDA Technology Co., Ltd. (Beijing, China). Twelve batches of AR and HR were collected in the Province of Gansu, China (supplemental Table S1).
Anti-inflammatory Assay
Quercetin was purchased from Shanghai Yuanye Biotech Co., Ltd (Shanghai, China). Dimethyl sulfoxide and Dulbecco’s Modified Eagle’s Medium (DMEM) were purchased from Sigma Aldrich (St. Louis, MO, United States). Antibiotics (penicillin/streptomycin) and fetal bovine serum (FBS) were purchased from Gibco BRL (Grand Island, NY, United States). Lipopolysaccharide (LPS) was purchased from Beijing LabLead Biotech Co., Ltd. (Beijing, China). Griess reagent was purchased from BioDee Biotech Co., Ltd. (Beijing, China).
Standards and Sample Preparation
The standard solutions of astragaloside I (11.0 µg/mL), astragaloside II (13.1 µg/mL), calycosin (8.0 µg/mL), calycosin-7-O-glucoside (8.2 µg/mL), formononetin (10.7 µg/mL), ononin (12.3 µg/mL), daidzein (10.3 µg/mL), and cycloastragenol (15.8 µg/mL) were prepared in methanol and stored at 4°C until use.
The cross sections of AR and HR were divided into 3 distinct layers. The outer layer was called periderm, the second layer phloem, and the inner layer xylem. One centimeter of each end and 1 cm in the middle part of AR and HR samples were collected as a representation of the whole root, while the remaining parts were peeled into periderm, phloem, and xylem according to the plant morphology. Four samples were therefore obtained from each batch after the peeling procedure (supplemental Figure S1 and supplemental Table S1). Subsequently, 0.5 g of powder was accurately weighted and extracted with 5 mL of 80% methanol using ultrasonication for 60 minutes. Subsequently, 1 mL of the supernatant was centrifuged using centrifugal filter units (0.22 µm) and further 20 times diluted with 80% methanol prior to analysis using ultra-high performance liquid chromatography-quadrupole time-of-flight mass spectrometry (UHPLC-QTOF/MS). The remaining supernatant was freeze-dried using a vacuum freeze dryer prior to anti-inflammatory experiments.
Metabolomics-Based LC-MS/MS Analysis
Liquid chromatography experiments were carried out using an Agilent 1290 series UHPLC system (Agilent Technologies, Santa Clara, CA, United States). The chromatographic separation was performed using a ZORBAX RRHD SB-C18 column (100 mm × 2.1 mm, 1.8 µm) from Agilent Technologies. The mobile phase consisted of water containing 0.1% formic acid (A) and acetonitrile containing 0.1% formic acid (B). The gradient elution was as follows: 5% to 25% B (0-2 minutes); 25% to 70% B (2-9 minutes); 70% to 99.5% B (9-10 minutes); 99.5% B (10-13 minutes); 99.5% to 5% B (13-13.1 minutes); 5% B (13.1-15.5 minutes). The eluent was collected in a waste container after 11.5 minutes. Experiments were carried out at 40°C with a flow rate of 0.3 mL/min. The injection volume was 2 µL.
The LC system was hyphenated to an Agilent 6560 Ion Mobility QTOF-MS system (Agilent Technologies, Santa Clara, CA, United States) with a Dual Agilent Jet Stream electrospray ionization (ESI) source operating in in positive ion mode. The ion mobility function of the instrument was switched off. The parameters of the ESI source and mass analyzer were set as follows: acquisition mode, QTOF only; desolvation temperature, 300°C; desolvation gas (N2) flow rate, 5 L/min; nebulizer pressure, 35 psi; sheath gas temperature, 350°C; sheath gas flow rate, 11 L/min; capillary voltage, 4000 V; nozzle voltage, 1000 V; fragmentor voltage, 400 V; scan rate, 1 spectrum/s; drift tube entrance voltage, 1200 V; drift tube exit voltage, 250 V; rear funnel entrance voltage, 240 V; rear funnel RF voltage, 150 V; rear funnel exit voltage , 43 V; IM hex delta voltage, −8 V; IM hex RF voltage, 600 V; IM hex entrance voltage, 41 V; and collision energy, 30 V. A solution containing HP-0921 (m/z 121.050) and purine (m/z 922.009) was constantly infused and used as reference mass for internal calibration. Mass spectrometric data were acquired between m/z 100 and 1700 in both MS and MS/MS mode.
Anti-inflammatory Activity Assay
Different tissue extracts from AR and HR were used to assess the anti-inflammatory activity. RAW 264.7 cells were cultured in DMEM containing 10% FBS and 1% penicillin/streptomycin. Hundred microliters of RAW 264.7 cells (1∙105 cells/mL) were inoculated in 96-well plates and subsequently placed at 37°C for 24 hours under 5% CO2 atmosphere. The RAW 264.7 cells were then activated overnight in a medium containing 1 µg/mL of LPS while simultaneously treated with 5 µg/mL of the test samples. After 24 hours of incubation at 37°C with 5% CO2, 50 µL of the supernatant from each well was transferred into a new 96-well plate prior to the addition of 50 µL of Griess reagent. After 10 minutes in the dark at room temperature, the absorbance was recorded at 490 nm on a microplate reader (BMG LABTECH., Offenburg, Germany). Quercetin (5 µg/mL) was used as positive control.
Statistical Analysis
Agilent MassHunter acquisition software (B.08.00, Agilent, United States) was used for acquisition of LC-MS/MS data. Data preprocessing, including molecular feature extraction (MFE), peak alignment, and normalization, was carried out using Agilent Profinder software (B.08.00, Agilent, United States). The thresholds of MFE and extraction of ion chromatograph filters were set at 500 counts with the feature appearing in at least 100% of samples in at least 1 condition, and 3000 counts with the feature appearing in at least 100% of samples in at least 1 condition, respectively. Data containing extracted features were exported to create a CEF format file as the input data of Mass Profiler Professional (MPP) software (version 14.9, Agilent) for further data processing. The tolerance window of retention time and accurate mass were 0.2 minutes and 10 ppm, respectively. Principal component analysis and HCA were used to estimate the variability within samples. Partial least squares discriminant analysis was used to highlight the metabolites of interest among the groups. The PLS-DA models were validated with a permutation test and cross-validation test.
One-way ANOVA analyses or Moderated t-test with a Benjamini-Hochberg Multiple Testing Correction (P <0.05) was used to compare different groups.
Supplemental Material
Supplementary material - Supplemental material for Metabolomic Determination of Specialized Metabolites Using Liquid Chromatography-Tandem Mass Spectrometry in the Traditional Chinese Medicines Astragali Radix and Hedysari Radix
Supplemental material, Supplementary material, for Metabolomic Determination of Specialized Metabolites Using Liquid Chromatography-Tandem Mass Spectrometry in the Traditional Chinese Medicines Astragali Radix and Hedysari Radix by Hai-Ying Bai, Wen-Hui Zheng, Shu Han, Fang Bao, Li-Li Sun, Kai-Xue Zhang, Li-Yao Wang, Hong Du, Yi-Meng Li, Shi-Lan Feng, Ryo Nakabayashi and Zhi-Gang Yang in Natural Product Communications
Footnotes
Declaration of Conflicting Interests
The author(s) declared no potential conflicts of interest with respect to the research, authorship, and/or publication of this article.
Funding
The author(s) disclosed receipt of the following financial support for the research, authorship, and/or publication of this article: This work was supported by the grant of MOST-RIKEN project, a Major International S&T Cooperation Project, Ministry of Science and Technology of the People’s Republic of China (2016YFE0129000); the Research project of Gansu Provincial Administration of Traditional Chinese Medicine (GZK-2015-21); and the Fundamental Research Funds for the Central Universities (lzujbky-2017-k26).
References
Supplementary Material
Please find the following supplemental material available below.
For Open Access articles published under a Creative Commons License, all supplemental material carries the same license as the article it is associated with.
For non-Open Access articles published, all supplemental material carries a non-exclusive license, and permission requests for re-use of supplemental material or any part of supplemental material shall be sent directly to the copyright owner as specified in the copyright notice associated with the article.