
Abstract
Peach blossom comes from the flower of Prunus persica (L.) Batsch, which is used as herbal tea and medicine in China and Korea. It could promote defecation and alleviate the abdominal pain. In this paper, the methods, ultra-performance liquid chromatography (UPLC) method coupled with electrospray ionization hybrid linear trap quadrupole orbitrap mass spectrometry (LTQ OrbitrapMS) and UPLC system coupled with a diode array detector (DAD), were developed for the qualitative and quantitative analysis of the flavonoids and phenolic acids in peach blossoms. Eight standards were divided into 3 types according to their basic skeletons: phenolic acids, quercetin-type flavonoids, and kaempferol-type flavonoids. The MSn fragmentation behaviors and diagnostic ions of these 3 types of compounds were proposed to aid the structural identification of components in peach blossom extract. By extracting the diagnostic ions from the mass spectrum in negative mode, a total of 25 compounds, including 8 phenolic acids and 17 flavonoids, were screened out. Among these compounds, 5 compounds (chlorogenic acid, ferulic acid, rutin, hyperoside, and isoquercetrin) were quantitated by UPLC-DAD. The linearity, precision, accuracy, limit of detection, and limit of quantitation were validated for the quantification method. The validated method was applied to assay 9 batches of peach blossoms from different regions. This study was the first report on the systematic qualitative analysis of compounds in peach blossom, providing insights into the quality control of peach blossom.
Peach blossom comes from the flower of Prunus persica (L.) Batsch, which has been largely cultivated in China. 1,2 In traditional Chinese medicine, peach blossoms are known to promote defecation and urination and alleviate abdominal pain. 3,4 Some studies also revealed that the extract of peach blossoms possessed antioxidant activity, anti-inflammatory properties, tyrosinase inhibitory activity and protective effects against DNA and protein damage. 2,5
To date, research on the chemical components of peach blossom was limited. Previous investigations indicated that flavonoid and phenolic acid were the main chemical constituents in peach blossom. 6 These compounds possessed multi-pharmacological activities including antioxidant, anti-inflammatory, antitumor activity and so on. 7 To the best of our knowledge, the published papers focused on the quantitative analysis of major components. 1,2,4 Though 1 study applied a high-performance liquid chromatography-mass spectrometry (HPLC-MS) method to detect 13 compounds via the m/z value, 3 the systematic qualitative analysis of compounds in peach blossom was not reported.
In this study, an ultra-performance liquid chromatography method coupled with electrospray ionization hybrid linear trap quadrupole orbitrap mass spectrometry (UPLC-LTQ-Orbitrap-MS) was employed to study the chemical constituents of peach blossom. Compared with some low-resolution MS methods and the Q-TOF MS method, this method could provide not only a higher mass resolution and mass accuracy (ppm <5) but also multistage MSn mass spectra (n > 3), which could describe the fragmentation pathways precisely. 8 The fragmentation pathway and diagnostic ions of flavonoids and phenolic acids were investigated in detail. Based on the fragmentation patterns, accurate mass measurements, and retention times (tRs), a total of 25 compounds were unambiguously or tentatively characterized. In addition, quantification of 5 bioactive components was performed with UPLC-DAD, and 9 batch samples were analyzed, which was expected to provide comprehensive information for quality control of peach blossoms.
First, 5 flavonoid standards (rutin [RU], isoquercetrin [IS], quercetrin, hyperoside [HY], and kaempferol) were investigated to study the fragmentation pathways and diagnostic ions of the flavonoids in peach blossom (Figure 1). Moreover, all these components could be detected in peach blossom samples by comparing their m/z values, tRs, and UV spectra. Among these standards, RU, IS, quercetrin, and HY were flavonoid O-glycosides that possess the same aglycon (quercetin). Kaempferol showed a similar structure to that of quercetin but lacked the –OH group at C-5’. For quercetin-type compounds, taking RU as an example (Figure 2), the [M-H]- ion at m/z 609.14496 corresponded to the formula C27H29O16, which was selected as the precursor ion in the subsequent MS2 experiment to give fragmentation information. In the MS2 spectrum, the precursor ion produced a peak at m/z 301.03488 (C15H9O7) via the loss of a rutinose residue. In MS3 spectrum, the ion at m/z 301.03 was selected as the precursor ion. The peak at m/z 283.0244 (C15H9O7) was formed by the loss of H2O. The loss of CO and CO2 was common in the fragmentation of flavonoids. 9 The ions at m/z 273.0400 (C14H9O6) and 245.04520 (C13H9O5) occurred by consecutive loss of CO from the ion at m/z 301.03. The loss of CO2 from both m/z 301.03488 and 273.0400 could lead to the formation of m/z 275.04520 (C14H9O5) and 229.05042 (C13H9O4), respectively. The ions of m/z 121.02956 (C7H5O2) and 178.99846 (C8H3O5) might be formed by cleavage of the bonds C1-C2 and C2-C3 in the parent ion, respectively. The ion of m/z 121.02956 contained the B ring, whereas that of m/z 178.99846 contained the A ring. The ion at m/z 178.99846 could subsequently lose CO and CO2 and generate ions at m/z 151.00365 (C7H3O4) and 107.01395 (C6H3O2). A Retro–Diels–Alder reaction might be invoked for the formation of the ion at m/z 151.00365 (C7H3O4) plus the neutral moiety. 10 Therefore, the diagnostic ions of quercetin-type flavonoids were ions at m/z 301.03, 273.04, 178.99, and 151.00. Kaempferol showed a similar structure to that of quercetin. Therefore, the fragmentation processes of kaempferol were similar to those of quercetin. Due to the absence of the –OH group at C-5’, the diagnostic ions of kaempferol-type flavonoids were all 16 Da less than those of quercetin-type flavonoids, viz, ions at m/z 285.03, 257.05, and 163.00. In addition, the A ring of kaempferol was the same as that of quercetin, and the diagnostic ion at m/z 151.00365 (C7H3O4) also appeared in the fragmentation processes of kaempferol-type flavonoids.

Chemical structures of the reference substances.

The fragmentation pathway of rutin (a) and its collision-induced dissociation MS2 (b) and MS3 (c) spectrum.
Three phenolic acids (chlorogenic acid [CA], 3,5-di-O-caffeoylquinic acid, and ferulic acid [FA]) were easily located in the extract of peach blossom by comparing their m/z values, tRs, and UV spectra. These 3 phenolic acids all possess hydroxycinnamic acid skeleton. CA and 3, 5-di-O-caffeoylquinic acid had the quinic acid moiety connected with the –COOH group in the hydroxycinnamic acid skeleton. Taking 3, 5-di-O-caffeoylquinic acid as an example (Figure 3), in the MS2 spectrum, the precursor ion at m/z 515.11792 (C25H23O12) produced an ion at m/z 353.08719 (C16H17O9) via loss of the caffeoyl moiety. The ion at m/z 353.08719 (C16H17O9) consecutively yielded diagnostic ions at m/z 191.05589 (C7H11O6) and 179.0349 (C9H7O4) by the cleavage of the bond between quinic acid and caffeic acid. The typical loss of 18 Da (H2O) and 44 Da (CO2) from ion at m/z 179.0349 generated the other 2 diagnostic ions at m/z 161.02433 (C9H5O3) and 135.04518 (C8H7O2), respectively. Therefore, the diagnostic ions of the hydroxycinnamic acid-type compounds were ions at m/z 191.05, 179.03, 161.02 and 135.04. 11

The fragmentation pathway of 3, 5-di-O-caffeoylquinic acid (a) and its collision-induced dissociation MS2 (b) and MS3 (c) spectrum.
Then, by extracting these diagnostic ions from the mass spectrum in negative mode, a total of 25 compounds, including 8 phenolic acids and 17 flavonoids, were screened out (Figure 4). Among the 25 detected compounds, compounds
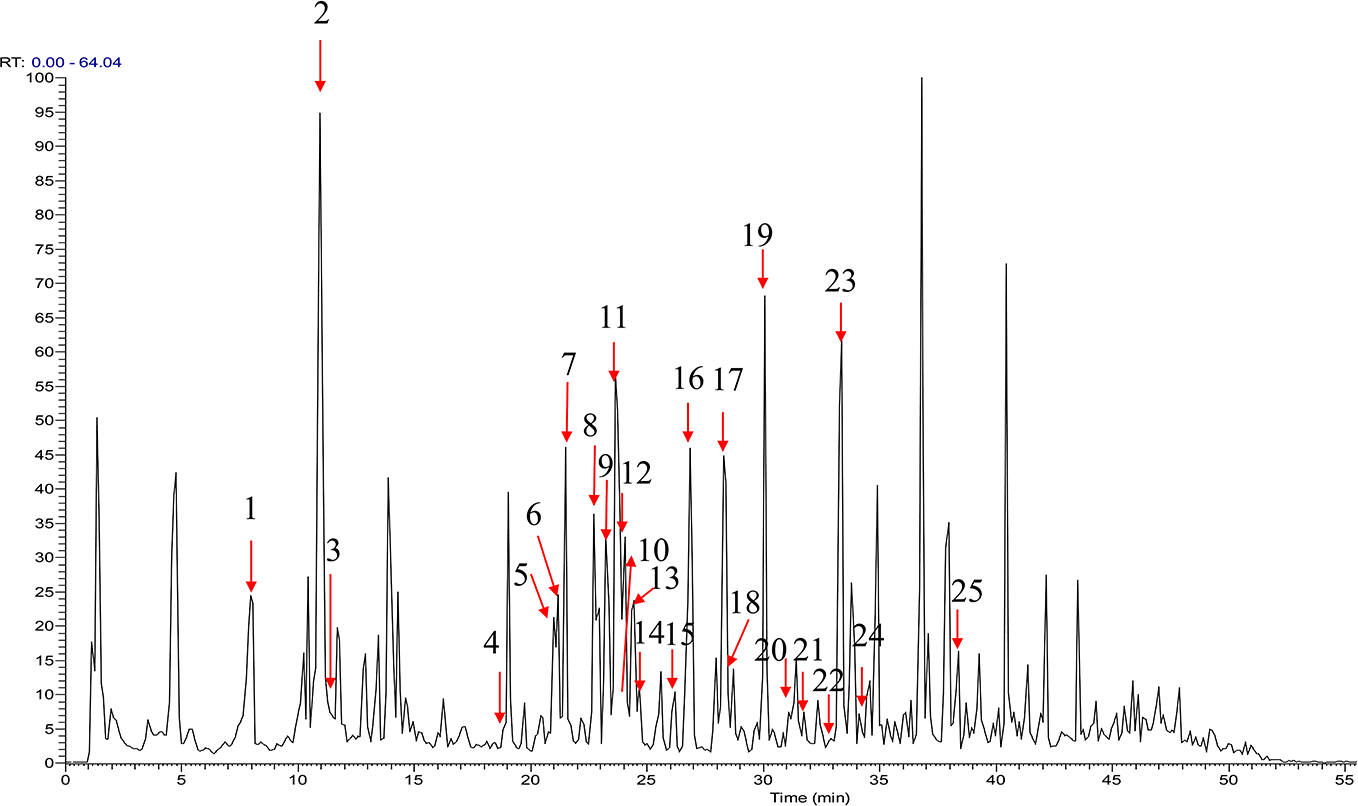
Total ion chromatogram of the extract of peach blossom in negative ion mode.
Mass Spectrometry Data and Fragment Pathways for Identified Compounds From Peach Blossoms.

tR, Retention times.
aCompounds were identified by comparison with reference compounds.
Compounds
Compounds
Compounds
Finally, 5 peaks in the UV chromatogram (Figure 5) of peach blossoms with reasonable heights and good resolution were chosen for quantification, including CA, FA, RU, HY, and IS. These compounds were considered as the active components in peach blossom. As shown in Table 2, for all the quantified compounds, linearity with R 2 >0.99 was achieved. The intra- and interday precision was less than 1.00% and 4.47%, respectively. The limits of detection (LODs) and limits of quantitation (LOQs) for the analytes were less than 2.54 and 7.98 ng, respectively. The relative standard deviation (RSD) value was found to be within the range of 5.46%-8.13% for repeatability. The average accuracy was in the range of 92.1%-105.9%, with the RSD range from 2.78% to 5.66%. The overall analytical procedure was precise, reproducible, and sensitive. Therefore, the approach was suitable for quantitative analysis of a large number of samples.

UPLC-DAD chromatograms of 5 standards (a) and peach blossom extract (b) at 254 nm.
Linear Regression Data, LOD, LOQ, Precision, and Accuracy of 5 Constituents in Peach Blossoms.

RSD, relative standard deviation; LOD, limit of detection; LOQ, limit of quantitation.
According to Table 3, the content of the quantified constituents in peach blossoms varied in different samples as a result of differences in cultivation conditions. In general, CA presented the highest concentration, followed by RU, HY, FA, and IS. Among these compounds, the content of 2 phenolic acids (CA and FA) differed remarkably in different batch samples. In a previous study, Liu et al 1 employed the HPLC-PDA method to quantify 6 phenolic compounds in peach blossom from different flowering stages. These papers also reported that CA was the predominant component in peach blossom and that the content of phenolic acids varied greatly in different flowering stages. 1 In our study, though the 9 batches of peach blossoms were harvested in the flowering stage, the degree of flowering was different. In addition, the 9 batches were collected from different regions of China, but there was no correlation between the content of the quantified constituents and the geographic characteristics.
The Contents (%) of 5 Constituents in 9 Batches of Peach Blossoms.

Materials and Methods
Samples, Chemicals and Reagents
Dried blooming peach blossoms were collected from markets in 4 provinces of China (Henan, Shandong, Anhui, and Zhejiang). The voucher numbers and place of collection are presented in Table 3. The voucher specimens were deposited in the Department of Pharmacognosy, Henan University of Chinese Medicine, Zhengzhou, China.
Eight reference substances (Figure 1), namely, chlorogenic acid (CA), ferulic acid (FA), rutin (RU), hyperoside (HY), isoquercetrin (IS), quercetrin, kaempferol, and 3,5-di-O-caffeoylquinic acid, were purchased from Mansite Technological Limited Company (Chengdu, China). The purity of the reference was determined to be higher than 95% by normalization of the peak area by UPLC-UV. Each reference compound was accurately weighed and dissolved in 70% methanol for the stock solutions. Acetonitrile (ACN), methanol, and formic acid (both HPLC grade) were purchased from Fisher Scientific (Fairlawn, NJ, USA). Deionized water was prepared by passing distilled water through a Milli-Q system (Millipore, Milford, MA, USA).
Sample Preparation
The dried peach blossoms were pulverized into powder, and 3 g of powder was accurately weighed and immersed in 50 mL 70% ethanol aqueous solution to ultrasonically extract for 40 minutes. The solution was filtered, and the filtrate was stored at 4°C ready for use.
UPLC Conditions for Quantitative Analysis
UPLC quantitation analysis of composition in peach blossom extract was performed by a Waters Acquity UPLC system coupled with a diode array detector (DAD). Chromatographic separation was carried out at 25°C on an Agilent InfinityLab Poroshell SB-C18 column (2.1 mm ×15 cm, 2.7 µm). The UV detector was set at 254 nm. The mobile phase consisted of 0.1% formic acid water (A) and ACN (B) using a gradient elution of 5% B from 0 to 5 mintes; 5% to 10% B from 5 to 10 minutes; 10% to 20% B from 10 to 15 minutes; 20% to 21% B from 15 to 20 minutes; 21% to 23% B from 20 to 23 minutes; 23% B from 23 to 25 minutes; 23% to 25% B from 25 to 30 minutes; 25% B from 30 to 32 minutes; 25% to 30% B from 32 to 40 minutes; and 30% to 100% B from 40 to 45 minutes. The flow rate was kept at 0.5 mL/min. The sample volume injected was set at 2 µL.
UPLC-MS Conditions for Qualitative Analysis
Chromatographic analysis was performed on a Dionex Ulti-Mate 3000 UPLC system (Thermo Scientific, Germering, Bavaria, Germany) equipped with a binary pump, an online degasser, a thermostatted autosampler, a thermostatically controlled column compartment, and a DAD. Chromatographic separation was carried out at 25°C on an Agilent InfinityLab Poroshell SB-C18 column (2.1 mm × 15 cm, 2.7 µm). The mobile phase consisted of 0.1% formic acid water (A) and ACN (B) using a gradient elution of 5% B from 0 to 3 minutes; 5% to 10% B from 3 to 8 minutes; 10% to 16% B from 8 to 17 minutes; 16% B from 17 to 18 minutes; 16% to 20% B from 18 to 19 minutes; 20% B from 19 to 25 minutes; 20% to 30% B from 25 to 35 minutes; 30% to 40% B from 35 to 40 minutes; 40% to 100% B from 40 to 50 minutes; and 100% B from 50 to 55 minutes. The flow rate was kept at 0.5 mL/min. The sample volume injected was set at 2 µL.
The mass spectra were acquired using a Thermo Fisher LTQ-Orbitrap XL Hybrid mass spectrometer (Thermo Fisher Scientific, Bremen, Germany) equipped with an electrospray ionization (ESI) source. The ESI source operating parameters were as follows: ion spray voltage, 3.5 kV; capillary temperature, 375°C; capillary voltage, −31 V; tube lens voltage, −150 V; and sheath (N2) and auxiliary gas (He) flow rates, 45 and 10 arbitrary units, respectively. The Orbitrap mass analyzer was operated in negative ion mode, with a mass range of m /z 80-2000. The Fourier transform resolutions were set at 30 000 (full width at half maximum, as defined at m/z 400) for MS and MSn (n = 4). The most intense ions detected in the full-scan spectrum were selected for the data-dependent scan. The normalized collision energy for collision-induced dissociation was 20 V. The data were recorded and processed using Xcalibur 3.0 software (Thermo Fisher Scientific) and Mass Frontier 7.0 software (Thermo Fisher Scientific, Waltham, MA, USA).
Validation of UPLC-UV Quantitation
The sample for method validation was collected from Anhui Province, China (TH-04). Stock solutions of 5 reference substances were prepared in 70% methanol and diluted to appropriate concentrations for establishing calibration curves. The calibration curve was generated by plotting the peak area and concentrations of the 5 substances. The LOD and LOQ were determined as the analyte concentration producing a signal-to-noise (S/N) ratio of approximately 3 and 10, respectively, by the injection of serially diluted solutions. The precision of the UPLC method was determined by inter- and intraday variation. The solution containing 5 mixed standards was analyzed for 6 replicates on the same day to assess intraday variation, and the interday variation was carried out for 3 consecutive days. Variations were expressed as RSDs. To test the stability, the same sample was subjected to UPLC analysis at 0 hours, 12 hours, 24 hours, 36 hours, and 48 hours. For the repeatability test, 6 samples from the same batch were extracted and analyzed by UPLC. The accuracy of the quantitation method was determined by recovery. A known amount of standard compound mixtures was added to the untreated sample and then extracted and analyzed as described above. The average recoveries of 5 standards were calculated using the following formula: recovery (%) =100 × (detected amount−original amount)/spiked amount.
Footnotes
Declaration of Conflicting Interests
The author(s) declared no potential conflicts of interest with respect to the research, authorship, and/or publication of this article.
Funding
The author(s) received no financial support for the research, authorship, and/or publication of this article.