
Abstract
The leaves of Artemisia princeps (Japanese mugwort, “Yomogi”) are traditionally used as a food ingredient to provide a fresh aroma and a deep green color. In this study, the seasonal variations of the volatile constituents in Japanese mugwort leaves collected from several parts of the plants were investigated using gas chromatography and multivariate analysis in order to determine the best time to harvest them and the best parts of the plants from which the leaves can be gathered and utilized as an ingredient in food. As a result, it was clarified that the balance between the amounts of monoterpenes and sesquiterpenes is an important factor that determines the quality of Japanese mugwort. In addition, the amount of β-caryophyllene was found to be the important factor that determines the best time and from which parts of the plant to harvest high-quality Japanese mugwort.
Keywords
Artemisia princeps (Japanese mugwort) is a perennial plant native to Japan, China, and Korea. It is commonly used in traditional medicine for the treatment of various diseases such as colic pain, diarrhea, dysmenorrhea, inflammation, microbial infections, ulcers, and vomiting. 1,2 In recent studies, leaves of A. princeps have been reported to have anti-oxidative, 3 anti-inflammatory, 4 anti-atherosclerotic, 5 anti-obesity, 6 anti-allergy, 7 and antihypertensive 8 activities. Especially in Japan, its leaves are traditionally used as a food ingredient to provide a fresh aroma and a deep green color. Rice cakes with these leaves are called “Yomogi-mochi” and are a traditional Japanese confectionery. Their quality is known to depend on the intensity of the aroma of the Japanese mugwort.
So far, several studies on the chemical constituents of Japanese mugwort have been carried out and nearly 100 compounds have been identified. Umano et al 9 reported on the identification of 192 volatile compounds (47 oxygenated monoterpenes, 26 aromatic compounds, 19 aliphatic esters, 18 aliphatic alcohols, 17 hydrocarbon monoterpenes, 17 hydrocarbon sesquiterpenes, 13 oxygenated sesquiterpenes, and miscellaneous compounds) from the leaves of Japanese mugwort using a combination of 2 extraction methods to improve the extraction efficiency.
The functions or benefits of many of the secondary metabolites in the plant, such as the volatile compounds, still remain unclear. Some are there to protect the plants from predators and others used to communicate with the other plants. Thus, the secondary metabolites in the plants fluctuate depending on the changing environmental conditions. Therefore, it is important to gather information on the fluctuations of the chemical constituents in order to determine the best time to harvest the plants and also determine the best parts of the plants from which the leaves can be gathered and utilized as an ingredient in food.
In this study, fluctuations in the chemical constituents in the leaves from several parts of Japanese mugwort plants collected in different seasons (Table 1) were investigated using gas chromatography (GC) and multivariate analysis.
Specimens Analyzed in This Study.

Figure 1 shows gas chromatograms of samples of each type: the excellent quality strain, type A (sample no. 9 in Table 1); the second grade quality strain, type B (sample no. 46); and a sample randomly selected from the entire field (sample no. 48). The peaks detected in chromatograms were annotated by comparison with the mass spectral data and retention index (RI) of those reported, as shown in Table 2. In the chromatogram of the type A sample, there are relatively large amounts of monoterpenes and sesquiterpenes. It was clarified that the second grade quality strain, type B, contained significantly larger amounts of sesquiterpenes than strain A, while there was a limited amount of monoterpenes. The chemical profile of the randomly selected sample is an average of those of types A and B.

Gas chromatograms of samples of each type: type A (sample no. 9), type B (sample no. 46), and a sample randomly selected from the entire field (sample no. 48). The numbers in the figure indicate the compounds in Table 2.
Compounds Annotated by Gas Chromatography-Mass Spectrometry Analysis in the Extracts of Japanese Mugwort Leaves.

RI, retention index; RT, retention time.
The peaks used to create a new analytical data set indicated by closed circle.
Principal component analysis (PCA) is an unsupervised method of multivariate data analysis and is used for clarifying the characteristic properties of the metabolomic profiles of complex mixtures. To evaluate the chemical profiles of 71 samples objectively, PCA was performed on the peak intensity data matrix of 71 samples. A PCA score plot (Figure 2(a)) and a loading plot (Figure 2(b)) of all the analyzed samples are shown in Figure 2. The first 2 principal components (PCs) accounted for 91.2% of the total variance (PC1, 82.1% and PC2, 9.1%). It was clarified that the strains of type A characteristically contained larger amounts of 1,8-cineol, borneol, β-elemene, germacrene D, and neophytadiene, whereas the strains of type B contained larger amounts of α-pinene, cis-chrysanthenol, β-caryophyllene, and β-farnesene (Figure 2(c-f)). In general, the odor due to highly volatile monoterpenes is considered to be the first (top notes) perceived by humans, while sesquiterpenes are considered to be perceived later (middle to base notes). These results indicate that the balance between the amounts of monoterpenes and sesquiterpenes is an important factor that determines the quality of the Japanese mugwort as a food ingredient.
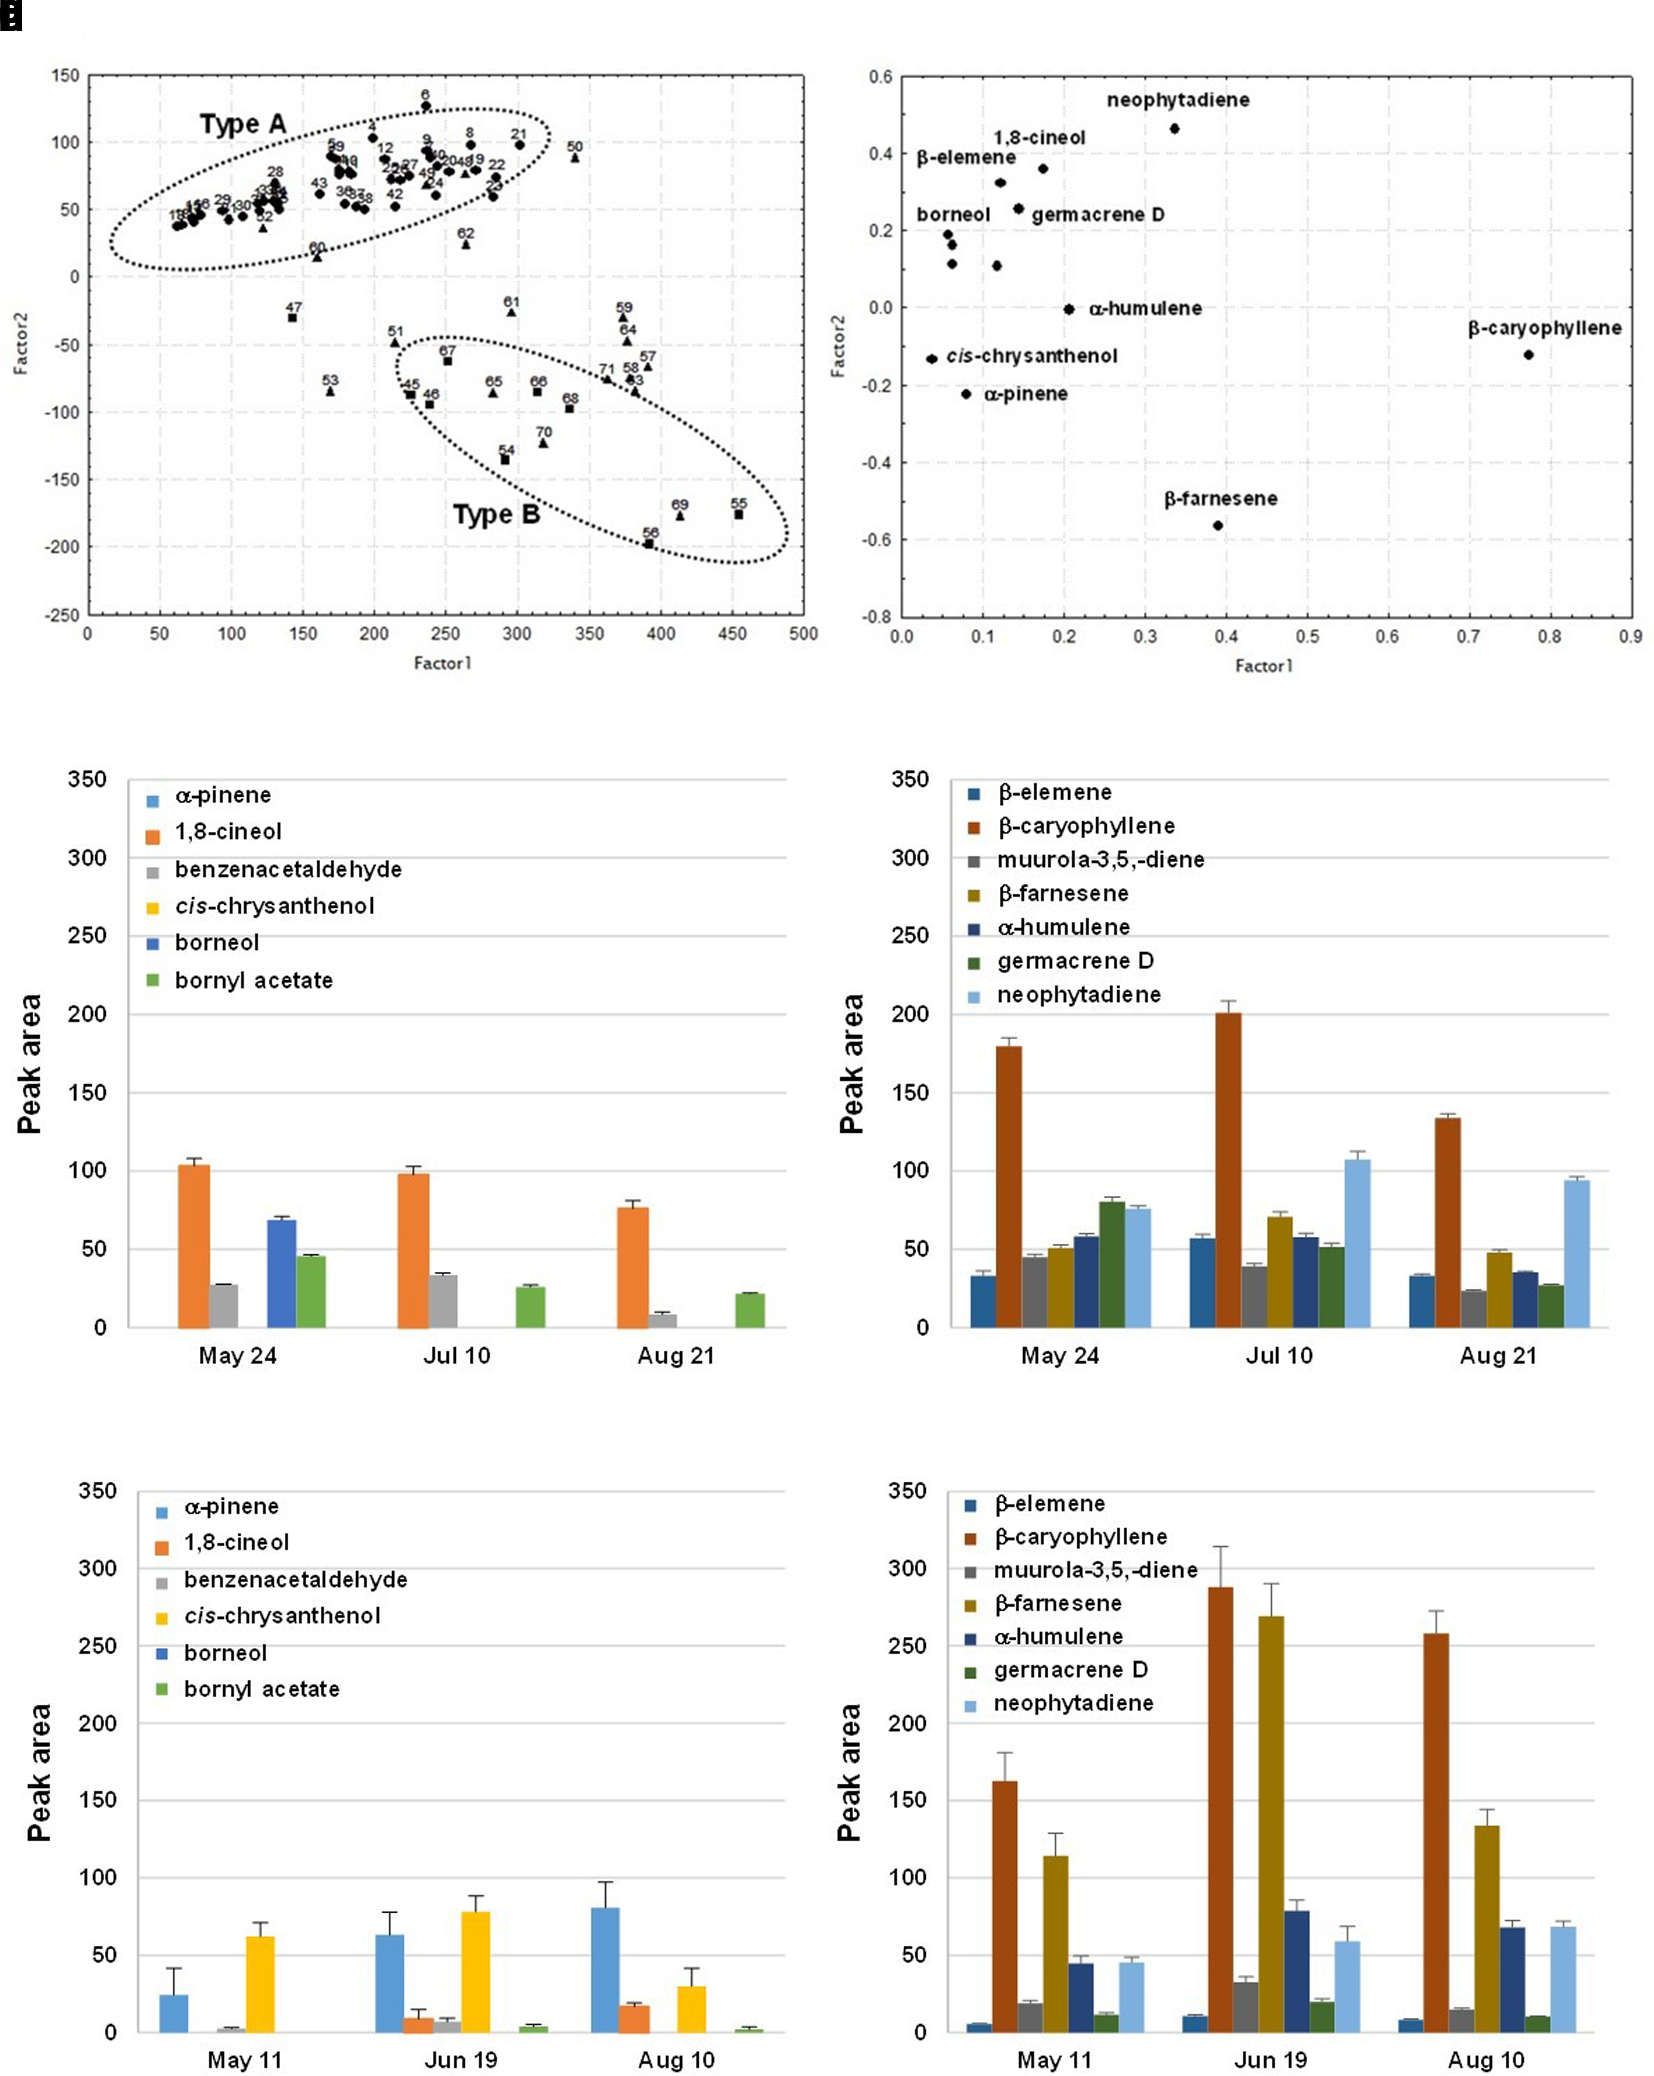
Results of principal component analysis using the analytical data obtained after preliminary processing in all samples. (a) Scores plot, the numbers indicate the sample number in Table 1. Closed circle (•): excellent quality strain (type A); closed box (▪): second grade quality strain (type B); and closed triangle (▴): strains randomly selected from the entire field. (b) Loading plot. (c) Peak areas of the monoterpenes detected in type A samples (plant tip, 60 cm) collected in different seasons. (d) Peak areas of the sesquiterpenes and diterpene detected in type A samples (plant tip, 60 cm) collected in different seasons. (e) Peak areas of the monoterpenes detected in type B samples (plant tip, 60 cm) collected in different seasons. (f) Peak areas of the sesquiterpenes and diterpene detected in type B samples (plant tip, 60 cm) collected in different seasons.
A PCA score plot (Figure 3(a)) and a loading plot (Figure 3(b)) of different parts of type A plants collected in different seasons are shown in Figure 3. The first 2 PCs accounted for 97.8% of the total variance (PC1, 92.5% and PC2, 5.3%). Samples from the plant tip had higher amounts of volatile chemicals during spring and summer compared to samples from the other parts of the plant during the same period (Figures 2(c, d) and 3(c-f)). The quality of the mugwort was poorer toward the lower parts of the plant. Of the volatile compounds, β-caryophyllene had the highest loading value for factor 1, and it was indicated that the amount of this compound is one of the important factors that determines the best part of the plant to harvest. As germacrene D and β-caryophyllene have been reported to contribute to the plant defense system, 10,11 a high content of these compounds during spring is considered appropriate for plant protection. In addition, Gertsch et al 12 reported that β-caryophyllene is a functional nonpsychoactive cannabinoid type 2 (CB2) receptor ligand in foodstuff and has the useful potential for treating inflammation, pain, atherosclerosis, and osteoporosis. The content of β-caryophyllene is considered to be an important factor for utilizing Japanese mugwort as a functional food ingredient.

Results of principal component analysis using the analytical data obtained after preliminary processing in different parts of type A plants collected in different seasons. (a) Scores plot, the numbers indicate the sample number in Table 1. Closed circle (•): plant tip (60 cm); closed box (▪): middle of plant (60 cm); and closed triangle (▴): bottom of plant (60 cm). (b) Loading plot. (c) Peak areas of the monoterpenes detected in type A samples (middle part of plant, 60 cm) collected in different seasons. (d) Peak areas of the sesquiterpenes and diterpene detected in type A samples (middle part of plant, 60 cm) collected in different seasons. (e) Peak areas of the monoterpenes detected in type A samples (bottom part of plant, 60 cm) collected in different seasons. (f) Peak areas of the sesquiterpenes and diterpene detected in type A samples (bottom part of plant, 60 cm) collected in different seasons.
In Figure 4, a PCA score plot (Figure 4(a)) and a loading plot (Figure 4(b)) of 3 different sizes of type A samples collected in different seasons are shown. The first 2 PCs accounted for 97.9% of total variance (PC1, 95.0% and PC2, 2.9%). All the specimens collected in spring are characterized by large amounts of monoterpenes and sesquiterpenes, despite the difference in plant height (Figures 2(c, d) and 4(c-f)). Among the sesquiterpenes, β-caryophyllene had the highest loading value for factor 1, and it was indicated that the amount of this compound is one of the important factors that determines the best time to harvest. The amounts of volatile chemicals in the samples collected from the smallest plants (20 cm) were low during summer (Figure 4(e, f)). The samples obtained from middle sized plants (40 cm) had similar amounts of chemicals from spring to the beginning of summer (Figure 4(c, d)). With regard to the chemical composition in the largest plants, it was clarified that the amount of neophytadiene increased during the summer season. Traditionally, the cilia of the leaves of well grown Japanese mugwort are utilized for moxibustion. Currently, neophytadiene is also used as an additive to liquid cigarettes to improve the aroma (United States Patent No. US 2012211015, 2010). 13 It is considered that the chemical properties of well grown Japanese mugwort make them suitable to be used for moxibustion. These results indicate that the best time to harvest mugwort is spring and that plants of all sizes can be used. In addition, the quality of middle sized mugwort plants was maintained until the middle of summer and these provide the best leaves to be used as an ingredient for food.

Results of principal component analysis using the analytical data obtained after preliminary processing in 3 different sized type A samples collected in different seasons. (a) Scores plot, the numbers indicate the sample number in Table 1. Closed circle (•): plant tip (20 cm); closed box (▪): plant tip (40 cm); and closed triangle (▴): plant tip (60 cm). (b) Loading plot. (c) Peak areas of the monoterpenes detected in type A samples (plant tip, 40 cm) collected in different seasons. (d) Peak areas of the sesquiterpenes and diterpene detected in type A samples (plant tip, 40 cm) collected in different seasons. (e) Peak areas of the monoterpenes detected in type A samples (plant tip, 20 cm) collected in different seasons. (f) Peak areas of the sesquiterpenes and diterpene detected in type A samples (plant tip, 20 cm) collected in different seasons.
The seasonal variations in the volatile constituents in A. princeps (Japanese mugwort) leaves collected from several parts of the plants were investigated using GC and multivariate analysis in order to determine the best time to harvest the plants and also to determine from which parts of the plants the best leaves for food ingredients could be obtained. As a result, it was clarified that the balance between the amounts of monoterpenes and sesquiterpenes is an important factor that determines the quality of Japanese mugwort. Of the sesquiterpenes, the amount of β-caryophyllene was found to be the important factor that determines the best time and from which parts of the plant to harvest high-quality Japanese mugwort. In addition, tips collected from middle sized mugwort plants provided the best leaves to be used as an ingredient for food.
Experimental
Plant Specimens and Reagents
Artemisia princeps (Japanese mugwort) were cultivated in the Botanical field of Taneya Co. Ltd. following the usual agronomical cultivation practices and under the same conditions. Specimens of fresh leaves were collected from an excellent quality strain (type A), a second grade quality strain (type B), and strains randomly selected from the entire field in May-August 2018 (Table 1). Frozen voucher specimens (−80°C) were deposited in the Museum of Materia Medica, College of Pharmaceutical Sciences, Ritsumeikan University. Analytical grade chemicals and chromatographic solvents of liquid chromatography-mass spectrometry (LC-MS) grade were purchased from Wako Chemical Co. Ltd. (Osaka, Japan).
Sample Extraction
The differences in extraction efficiency of the compounds in Japanese mugwort leaves with extraction solvents (ethyl acetate, acetone, and hexane) were compared. As a result, extraction with ethyl acetate was the most efficient one. Samples of 150 mg of fresh leaves from each plant were cut into small pieces and pulverized with a mortar under liquid nitrogen. The respective samples were sealed in glass vials (10 mL, SUPELCO, Bellefonte, PA, United States) and extracted with 2 mL of ethyl acetate at room temperature for 1 night. After extraction, the extract was transferred to a GC sample vial.
Gas Chromatography and Gas Chromatography-Mass Spectrometry (GC-MS) Analysis
Gas chromatography analysis was carried out using an Agilent 6890 Gas chromatograph with a flame ionization detector (FID) detector (Agilent Technologies, Santa Clara, CA, United States). The column was a fused-silica capillary column, Ritx-5MS (30 m × 0.25 mm i.d., film thickness 0.25 µm, Restek, Bellefonte, PA, United States). The injector and detector temperatures were 280°C. The oven temperature was programmed as follows: initial temperature: 50°C; initial hold time: 2 minutes; temperature ramp-up rate: 10°C/min; final temperature: 300°C; and final hold time: 9 minutes. The flow rate of the carrier gas (Helium) was 1 mL/min. The flow rates of the hydrogen, air, and the makeup gas (Helium) were 30, 400, and 29 mL/min, respectively. Gas chromatography-mass spectrometry (GC-MS) analysis was performed with a Shimadzu QP 2010 mass spectrometer (Shimadzu, Kyoto, Japan) equipped with a Shimadzu GC 2010 gas chromatography system. The column was a fused-silica capillary column, DB-5MS (30 m × 0.25 mm i.d., film thickness 0.25 µm, Agilent Technologies, Santa Clara, CA, United States). The injector and the transfer line were maintained at 250°C. The oven temperature was programmed as follows: initial temperature: 50°C; initial hold time: 3 minutes; temperature ramp-up rate: 10°C/min; final temperature: 300°C; and final hold time: 5 minutes. The flow rate of the carrier gas (Helium) was 1 mL/min. The following conditions were used for MS; ionization: electron ionization (EI) mode; ionization current: 60 μA; and ionization voltage: 70 eV. For GC-MS peak annotation, several mass spectral databases such as KNApSAcK, the NIST (http://www.nist.gov/srd/nist1a.cfm), Wiley NBS, Mass bank (http://www.massbank.jp/), mass spectral data book, 14 and the previous reports on Japanese mugwort ingredients were used. 15 In addition, RI was calculated using a standard alkane mixture (C9-C40) (GL Sciences, Tokyo, Japan).
Statistical Analysis
Principle component analysis was performed using the Pirouette (Infometrix, Bothell, WA, United States) or Statistica (TIBCO Software, Newport Beach, CA, United States) software environment for statistical computing and graphics. In this study, many metabolites in the leaves of Japanese mugwort plants were analyzed. In nontargeted metabolomics analysis like this study, finding suitable internal standards for all metabolites and creating a calibration curves are unpractical. Thus, the use of raw signal intensity data has been accepted in metabolomics analysis. 16 The peaks detected in the gas chromatograms were arranged according to the annotated compounds to create an original data set (all peaks of the compounds shown in Table 2). Principal component analysis was applied to process the original data set, and variables with small loading values (less than 50% of the biggest loading value) were removed from the original data set to create a new analytical data set. The peaks used to create a new analytical data set indicated by closed circle in Table 2. Principal component analysis was applied to this analytical data set to clarify the characteristic properties in the chemical profiles of 71 samples objectively.
Footnotes
Declaration of Conflicting Interests
The author(s) declared no potential conflicts of interest with respect to the research, authorship, and/or publication of this article.
Funding
The author(s) received no financial support for the research, authorship, and/or publication of this article.