
Abstract
Bay laurel (Laurus nobilis L.) is an evergreen tree. The objective of this study was to determine the chemical composition (polyphenols, essential oil [EO], lipid fraction, cellulose, and protein content) of laurel fruits collected from Greece (Mount Athos) and Georgia (the village of Meria), and to evaluate the antimicrobial activity of laurel fruit EOs. The major phenolic acids in the fruits from Greece were p-coumaric acid (free 261.6 µg/g) and vanillic acid (free 253.1 µg/g and conjugated 925.8 µg/g). The major phenolic acids in fruits from Georgia were vanillic acid (free 105.6 µg/g and caffeic acid [conjugated 439.2 µg/g], and syringic acid [conjugated 390.7 µg/g]). The laurel fruit EOs from Greece (1.4% content) and Georgia (1.6%) had distinct composition. Monoterpene hydrocarbons were the dominant group of compounds in the EOs, with 49.7% in the EO from Greece and 68.7% in the EO from Georgia. The major constituents of the fruit EO from Greece were 1,8-cineole (18.2%), α-phellandrene (15.0 %), β-pinene (9.4%), and α-pinene (9.1%), whereas the ones from Georgia were trans-β-ocimene (59.4%) and 1,8-cineole (7.6%). Laurel fruit EO from Greece and Georgia demonstrated low to moderate antimicrobial activity against pathogenic and spoilage microorganisms and the dimorphic yeast Candida albicans. The main fatty acids (FAs) in the lipid fractions were oleic, palmitic, and linoleic; there were differences in FA composition between the shells and the seeds of the fruits from the two countries. γ-Тocopherol predominated in the tocopherol fraction of the lipids from fruits shells and seeds from Greece (65.3% and 54.4%, respectively), whereas β-tocopherol predominated in fruits shells and seeds from Georgia (93.7% and 45.6%, respectively). Currently underutilized, the laurel fruits from both Greece and Georgia contain various valuable compounds that may potentially be used for perfumery, cosmetic, and pharmaceutical applications.
Keywords
Bay laurel (Laurus nobilis L.), family Lauraceae, is native to the southern Mediterranean region and widely cultivated in Asia, Europe, and America as a spice, medicinal, and ornamental plant. 1 -4 Turkey, Spain, Portugal, and Iran have traditionally been some of the largest exporters of dried laurel leaves (bay leaves). Laurel dried leaves, fruits, and essential oils (EOs) are used extensively in the food industry. 1,2 Oregon myrtle (also known as California bay laurel or American laurel) is a different species, Umbellularia californica (Hook. & Arn.) Nutt.; however, it is also used as a spice (it has a stronger pungency than bay leaf), and its wood is used for culinary and medicinal purposes.
Laurel berries are one-seeded ovoid fruits with a dark purple, thin, brittle, wrinkled pericarp, which, when broken, discloses a kernel whose seed coat adheres to the inner surface of the pericarp. Both EOs (about 1%) and lipids (up to 30% fixed, lipid fraction) are present in the fruit. The EO is used in the food and perfume industries and the lipid fraction for soap production. 2,5,6 The most widely used plant part of laurel is the leaf. 2,7,8 However, laurel fruit (berry) EO also has commercial value and has been investigated. 9 Interest in laurel fruit EO surged the following recent reports on its bioactivity, eg, its suppression of breast cancer cell lines 10 and in vitro human tumor models. 11 The demonstrated bioactivity of laurel fruit EO may be due to differences in its composition compared with those of laurel leaf and flowers. 2
Studies on the chemical composition of L. nobilis reveal opportunities to use it not only as a spice but also as a source of natural bioactive compounds. The fruits of L. nobilis are used in traditional medicine for the treatment of rheumatism, dermatitis, and gastrointestinal problems. 6,12 Essential oils extracted from the leaves and fruits of laurel have demonstrated various types of bioactivity, such as antimicrobial, analgesic, anticonvulsant, antiviral, anticholinergic, and insect repellency. 6,13
Most previous EO studies were conducted on laurel leaves and flowers; however, a few studies on laurel fruit EO and fatty acids (FAs) have been carried out 13 -16 (Supplemental Table S1). These studies reported the effects on various factors of laurel fruit EO and FA composition. However, most of the studies so far on laurel EO have examined fruits grown in Turkey, Iran, and Spain.
Laurel fruits offer an opportunity for dual utilization: for high-value EOs and for FAs. The hypothesis of this study was that laurel fruit EO from Greece and Georgia would differ in composition and bioactivity. To the best of our knowledge, there are no data on the chemical composition and antimicrobial activity of laurel fruits and fruit EOs from Greece and Georgia. These two countries are located in distinctly different parts of Europe and characterized by different climatic conditions. Greece and Georgia are at similar latitude but at a different longitude, and both the countries have access to the sea, the Aegean and the Black Sea, respectively. Varying climatic conditions are a prerequisite for differences in both chemical composition and biological activity of the studied samples. Most bay leaves and berries in Greece and Georgia are still collected from wild plants, since it has been shown that wild collected leaves have higher EO content and are preferred in the local cuisines. On Mount Athos (the Aton peninsula) in Greece, in the vicinity of the Bulgarian Zografski Monastery, as well as in the vicinity of the village of Meria, Georgia, there are forests of wild-growing laurel trees. The local populations collect the bay leaves, and after drying, they are used as spice. The fruits, however, remain unpicked; they fall on the ground and decay around the trees. The purpose of this paper was to investigate the chemical composition of fruits from wild-growing laurel trees growing on Mount Athos in Greece and in the vicinity of the village of Meria, Georgia, and assess the possibility for industrial production of EO and the lipid fraction for use in cosmetics and pharmaceuticals. Therefore, the specific objectives of this study were to determine the chemical composition (polyphenols, EO, lipid fraction, cellulose, and protein content) of laurel fruits collected from Greece and Georgia and to evaluate the antimicrobial activity of fruit EOs against pathogenic microorganisms and those that cause food spoilage.
The absolute weight of fruits from Georgia (moisture 28.6% ± 0.25%) was 1294.3 g/1000 fruits and from Greece (moisture 36.8% ± 0.35%) was 699.4 g/1000 fruits.
Twelve phenolic acids were determined in laurel fruits (Table 1). Derivatives of cinnamic and benzoic acids were the dominant compounds in the fruits from Greece, while the flavonol, kaempferol, and flavons apigenin and luteolin predominated in the fruits from Georgia. The major phenolic acids in the fruits from Greece were p-coumaric acid (free 261.6 µg/g) and vanillic acid (free 253.1 µg/g and conjugated 925.8 µg/g). The major phenolic acids in fruits from Georgia were vanillic acid (free 105.6 µg/g) and caffeic acid (conjugated 439.2 µg/g), and syringic acid (conjugated 390.7 µg/g).
Polyphenol and Phenolic Acid Concentrations of Laurel Fruits From Greece and Georgia.

nd, not detected.
*Significantly different (P < 0.05)
In this study, there were considerable differences between the laurel fruits from 2 locations in both free phenolic acids, such as р-coumaric and vanillic acids, and in conjugated phenolic acids, such as conjugated-vanillic and sinapic acids. Relatively high levels of flavonoids (myricetin, quercetin, and kaempferol) were detected in the samples of this study compared with the reported results in the literature. 10
The EO was light yellow with a specific odor. The EO content (Table 2) from Greece was 1.4% ± 0.01% and that from Georgia 1.6% ± 0.01%.
Chemical Composition of Essential Oils From Laurel Fruits, % of Total Oil.
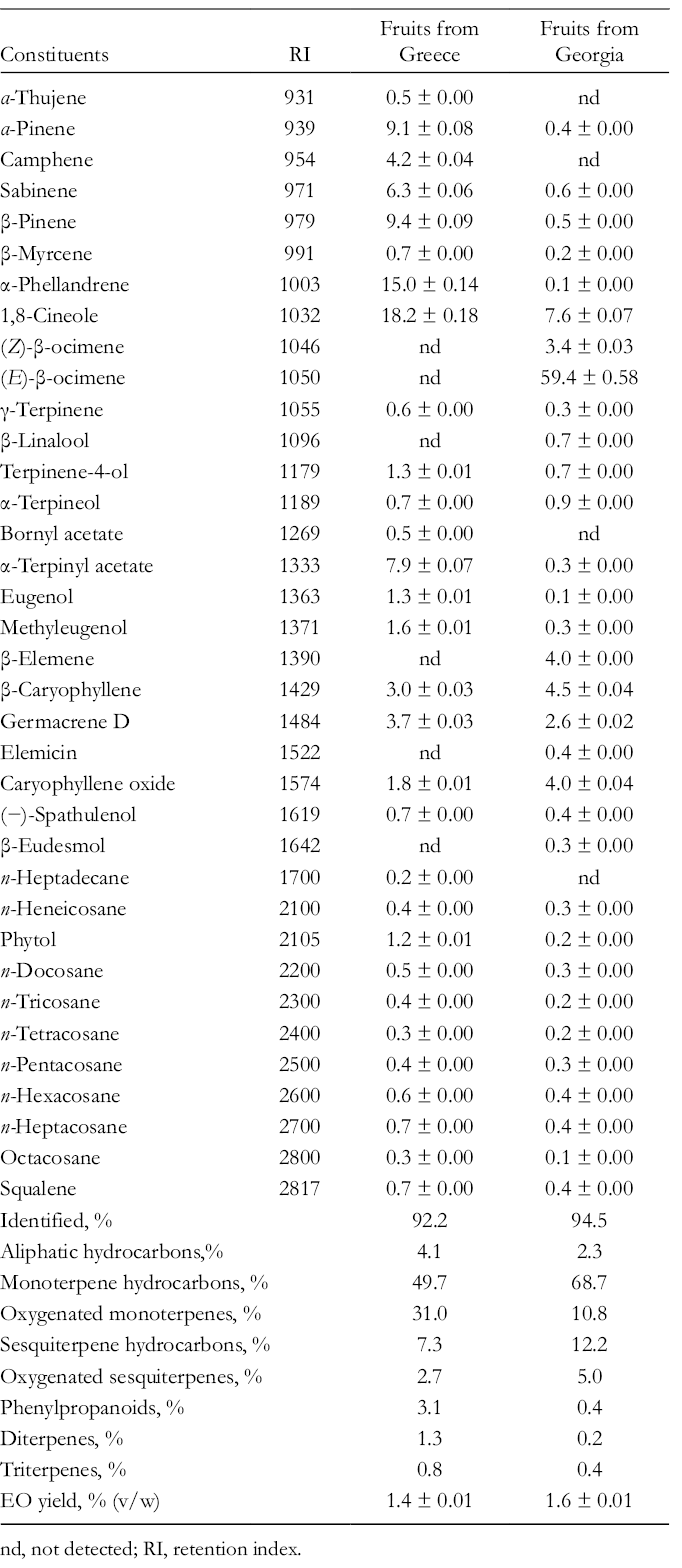
nd, not detected; RI, retention index.
Thirty EO constituents, representing 92.2% of the total EO, were identified in the Greek laurel fruit EO; 14 constituents were in concentrations over 1% and the other 16 constituents were less than 1% of the total EO. The major EO constituents (above 3% of the EO) were as follows: 1,8-cineole, α-phellandrene, β-pinene, α-pinene, α-terpinyl acetate, sabinene, camphene, germacrene D, and β-caryophyllene.
Thirty-two EO constituents, representing 94.5% of the total EO, were identified in Georgian laurel fruit EO; 7 were in concentrations over 1% and the other 25 constituents represented less than 1% of the total EO. The main constituents (above 3% of the EO) were as follows: trans-β-ocimene, 1,8-cineole, β-caryophyllene, caryophyllene oxide, β-elemene, and cis-β-ocimene.
Monoterpene hydrocarbons were the dominant group in the EOs from Greece and Georgia (Table 2), followed by oxygenated monoterpenes and sesquiterpene hydrocarbons, respectively.
Overall, laurel EO contents in this study were within the range of those reported previously for laurel fruit from other countries. For example, 2.8%, 10 0.8%, 14 0.75%, 17 and 3% were from the endocarp, and 1.2% from hulls 18 (Supplemental Table S1). This relatively wide range for laurel fruit EO content may be due to different climatic conditions and the plant parts processed.
Qualitative and quantitative differences in EO profiles of the fruits from the two countries were identified. These differences could be attributed to the distinct environmental conditions in Greece and Georgia and also to the genetic variability of the species. Indeed, the previous research from Turkey, 9,12 Serbia, 17 Iran, 18 and Tunisia 19 reported significant variation in EO composition of laurel fruits as a function of collection location and EO extraction method (Supplemental Table S1).
Antimicrobial activity of EOs from L. nobilis fruits from Greece and Georgia was tested by 2 different methods: the agar disk diffusion and the broth microdilution (Table 3). The effects of both EOs on food spoilage bacteria, pathogenic bacteria, and the dimorphic yeast Candida albicans were evaluated.
Antimicrobial Activity of Laurel Fruit Essential Oils.

EO, essential oil; IZ, inhibitory zone; MIC, minimal inhibitory concentration; nd, not detected.
As shown in Table 3, both EOs demonstrated antimicrobial activity against all test microorganisms except 2 Pseudomonas species. The antimicrobial susceptibility of Gram-positive and Gram-negative bacteria was slightly different, but the yeast C. albicans was most susceptible. The studied EOs are characterized by low to moderate antimicrobial activity compared with the positive controls (Ciprofloxacin and Fluconazole).
In this study, the EO from Greece demonstrated higher antimicrobial activity than that from Georgia, which could be attributed to the qualitative and quantitative differences in chemical compositions of 2 EOs. It was previously demonstrated that oxygenated monoterpenes play a leading role in the antimicrobial activity of EOs from Salvia sclarea, Salvia officinalis, and Hyssopus officinalis 20,21 (Supplemental Table S1). In this study, the EO from Greek L. nobilis fruits had 3 times higher content of oxygenated monoterpenes than the EO from Georgian fruits, which probably is the major reason for the differing levels of antimicrobial activity.
The chemical composition of shells from fruits parts is presented in Table 4. The content of cellulose, protein, and lipids differed between samples from the two countries, which could be explained by differences in environmental conditions and possibly different genotypes.
Chemical Composition of Laurel Fruits.
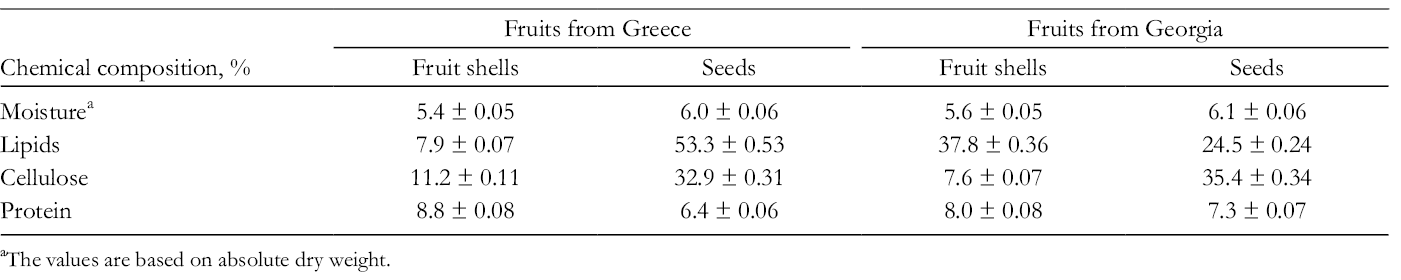
aThe values are based on absolute dry weight.
The fruits in this study contained polyphenolic compounds, EO, lipid fraction, proteins, and cellulose. The difference to 100% is explained by the content of carbohydrates, organic acids, dyes, minerals, and other compounds not identified in the present work, but their presence has been quoted by other authors. 16
Table 5 shows the amounts of the main biologically active lipids (sterols, phospholipids, and tocopherols) in the lipid fractions from the investigated samples. The FA composition of laurel fruit from both the countries is presented in Table 6. Seventeen FAs were found in the lipid fraction from laurel, constituting 100% of the total lipid fraction content. In laurel fruits from Greece, the main FAs in the lipid fraction from shells were oleic, linoleic, lauric, and palmitic acids. The ratio between the saturated and unsaturated FAs was 39.7:60.3. The main FAs in the lipid fraction from seeds were oleic, palmitic, and linoleic acids. The ratio between the saturated and unsaturated FAs was 24.1:75.9.
Content of Different Components in Lipid Fraction From Laurel Fruits.

Fatty Acid Composition of Lipid Fraction From Laurel Fruits.

nd, not detected.
The content of sterols in the investigated lipids (0.3%-0.5%) was slightly lower, but still close to that reported for the most common commercially produced plant lipid fractions (sunflower, soybean, and cottonseed) in which the respective quantities were 0.25% to 0.43%. 22
In this study, the total content of tocopherols in the lipid fractions from shells (1945-2036 mg/kg) was significantly higher than that from the seed lipid fraction (314-513 mg/kg). The amount of tocopherols observed in the scales in this study was similar to that reported previously for soybean (600-3370 mg/kg), corn (330-3720 mg/kg), and rapeseed lipid fractions (430-2680 mg/kg), 23 whereas the quantity of tocopherol in the lipid fraction of laurel seeds in this study was comparable with that of sunflower, safflower, and pumpkin oil. 23 In this study, the quantity of phospholipids in the examined lipid fractions was found to be considerably higher than that of other common lipid fractions such as sunflower, corn, and safflower (0.4%-0.9%) and close to that of soybean oil (1.0%-3.0%). 24
The main FAs in the lipid fraction from Georgian laurel shells were lauric, oleic, linoleic, and palmitic acids (Table 6). The ratio between the saturated and unsaturated FAs was 61.1:38.9. The main FAs in the lipid fraction from seeds were oleic, palmitic, and linoleic acids. The ratio between the saturated and unsaturated FAs was 30.1:69.9.
Differences between this study and the previously reported data on the FAs content of the lipid fraction may be due to the environmental conditions under which the plants had grown. The presence of oleic and linoleic acid in the lipids from laurel in this study was similar to that in glyceride oils from other nontraditional oilseed crops such as grape seeds, watermelon, tobacco, and poppy seeds. 22 Laurel fruit lipid fraction in this study was found to contain very high amounts of the saturated palmitic acid, which was close to the levels measured in other lipid fractions, reported previously for olive oil (7.5%-20.0%) and corn oil (8.0%-19.0%). 24
The previous research has shown that the chemical composition of laurel fruits may be altered by cultivation. Dias et al 16 studied the chemical composition of fruits from wild and cultivated laurel trees and found that the fruits from the cultivated trees had higher lipid fraction and carbohydrate content. In the same study, the content of FAs in the lipid fractions obtained from fruits of the wild and cultivated trees was also different. Linolenic, palmitic, and linoleic acids dominated in the lipid fraction from fruits of the wild trees, while in the cultivated trees, the main acids were palmitic, linolenic, lignoceric, linoleic, oleic, and stearic acids 16 (Supplemental Table S1).
The lipid fraction of laurel fruits has been shown to be influenced by collection site and growth conditions. Fruits from 3 different areas of Lebanon 15 were observed to have higher lipid fraction contents (17.5-28.1 mL/100 g) than those in this study, with greater amounts of oleic, linoleic, palmitic, and lauric acids (Supplemental Table S1). In other studies, the major FAs of the lipid fraction from Tunisian fruits 19 were lauric, oleic, linoleic, and palmitic acids, while the seed oil from Turkish fruits 13 was characterized by a high content of linoleic, lauric, and palmitic acids (Supplemental Table S1).
The lipid fraction profile may depend on the extraction procedure as well. Nurbaş and Bal 25 applied light petroleum and benzene for extraction of the lipid fraction from laurel fruits and reported that they were rich in lauric, palmitic, oleic, and linoleic acids. In another study, Popov and Ilinov 22 reported that the main FAs isolated from laurel fruits were palmitic, oleic, and linoleic acids (Supplemental Table S1).
The tocopherol composition of lipid fractions from laurel fruit shells and seeds is presented in Table 7. γ-Тocopherol predominated in fruits from Greece (65.3% and 54.4%, respectively), whereas β-tocopherol was predominant in fruits from Georgia (93.7% and 45.6%, respectively).
Tocopherol Composition of Lipid Fraction From Laurel Fruits.
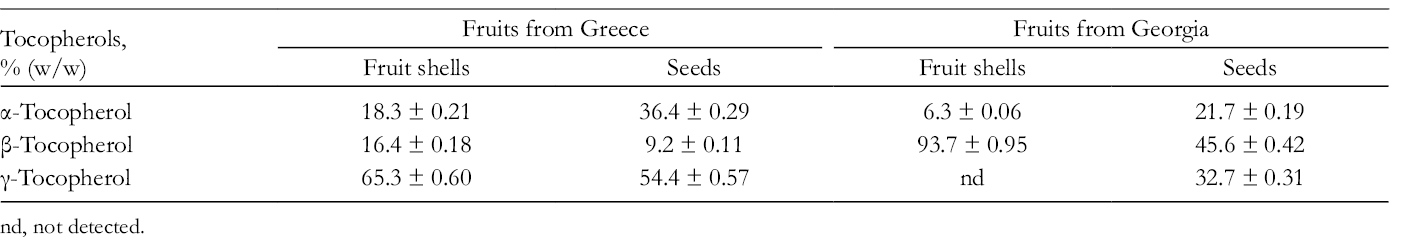
nd, not detected.
Tocopherols are a class of organic chemical compounds, many of which have vitamin E activity; the main dietary sources of these compounds are the lipid fractions of olive, sunflower, soybean, and corn. 22 β-Sitosterol and campesterol predominated in the sterol fraction. Values for laurel fruit sterol content and composition were similar to the ones reported for cotton seed lipid fraction. 23 Overall, the tocopherol composition of laurel fruit lipid fraction originating from Greece was similar to that of soybean and maize oil, whereas that from Georgia differed significantly in individual tocopherol composition from other widely used vegetable oils. 23
Sterols were present in the so-called nonsaponified part of the lipid fraction. The individual sterol composition is presented in Table 8.
Sterol Composition of Lipid Fraction From Laurel Fruits.
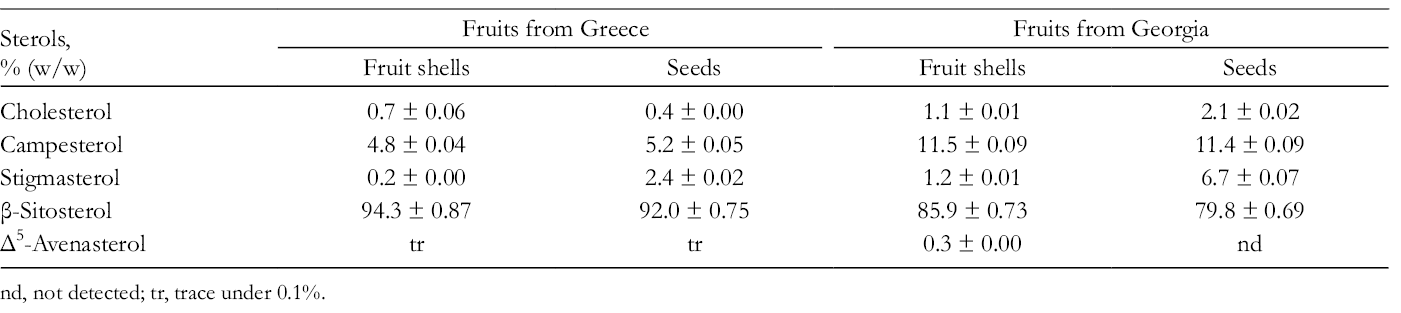
nd, not detected; tr, trace under 0.1%.
Differences in the lipid composition of laurel fruits of different origins are most likely due to the differences in agrometeorological conditions of the geographic regions where the plants were grown. For example, the long-term average rainfall at Hilandar on Mount Athos (the sampling site in Greece) is 474 mm. July is the hottest month in Mount Athos with an average temperature of 25°C and the coldest is January with an average temperature of 8°C. The wettest month is December with an average of 80 mm of rain. The climate around the village of Meria, Western Georgia (the sampling location in Georgia), is humid, mild, temperate, and warm. The weather station at Ozurgeti (around 10 km from Meria) had long-term average annual rainfall of 1981 mm. August is the hottest month with an average temperature of 22.7°C, while January has the lowest average temperature of 5.0°C.
We detected significant qualitative and quantitative differences in the chemical composition of laurel fruits and EOs of L. nobilis fruits from Greece and Georgia. The distinct environmental conditions for plant growth and EO accumulation in the fruits in the two European countries most likely played a key role in creating these considerable differences. Both EOs demonstrated low to moderate antimicrobial activity. The laurel fruits can be successfully used as a nonconventional source for production of lipids, tocopherols, and polyphenols. This study demonstrated that laurel fruits are a suitable raw material for the industrial production of EOs and lipid fractions and may have applications in cosmetics and pharmaceutical products.
Experimental
Plant Material
Laurel fruits were collected on October 10-15, 2016 from Mount Athos (the Aton peninsula) (40°09′26″N and 24°19′35″E) in Greece and on December 10-15, 2016 from the village of Meria (41°56′27″N 41°53′45″E) in Western Georgia. The plant species was identified as L. nobilis L. by Dr I. Dimitrova from the Department of Botany at the University of Plovdiv “Paisii Hilendarski,” Bulgaria. The fruits were air-dried immediately after harvesting at room temperature (22°С ± 0.5°С), packed in paper bags, and kept in a dark, dry and cool place. The weight of 1000 randomly selected fruits (absolute weight) was determined using an electronic precision balance (Mettler-Toledo, ±0.0001 g). The moisture of the fresh fruits, air-dried shells, and seeds was determined by drying at 105oС until constant weight. 26 Plant primary and secondary metabolites and potential biologically active substances were analyzed in all samples and the values were represented in absolute dry weight.
Extraction of Polyphenols
Sample preparation
Dried fruits were powdered using a laboratory homogenizer. Phenolic compounds were extracted from 1.0 g of powdered sample with 70% methanol (Sigma-Aldrich, St. Louis, MO, United States) in an ultrasonic bath at 70°C for 3 hours. The biomass was first separated by filtration, and the extraction procedure was repeated twice. The combined extract was evaporated to dryness on a rotary evaporator. The residue was dissolved in methanol and used for high performance liquid chromatography (HPLC) analyses after filtration with a 0.45 µm syringe filter. The extraction of conjugated phenolics was performed using the same procedure, except that 2 M hydrochloric acid in methanol was used for extraction.
HPLC Analyses of Polyphenols
Qualitative and quantitative determination of phenolic acids and flavonoids content were performed using a Waters 1525 Binary Pump HPLC system (Waters, Milford, MA, United States), equipped with a Waters 2484 Dual Absorbance Detector (Waters, Milford, MA, United States) and a Supelco Discovery HS C18 column (5 µm, 25 cm × 4.6 mm), and operated under the control of Breeze 3.30 software.
Analyses of Phenolic Acids
A gradient elution using the mobile phase of Solvent A (2% acetic acid) and Solvent B (0.5% acetic acid:acetonitrile, 1:1) was used. The gradient was set up according to Marchev et al. 27 The phenolic acids (Sigma-Aldrich) were used as standards to build calibration curves. The detection was carried out at 280 nm.
Analyses of Flavonoids
Gradient elution using Solvent A (2% acetic acid) and Solvent B (methanol) was used. The gradient was set up according to Marchev et al. 27 Flavonoids (Sigma-Aldrich) were used for the creation of standard calibration curves. The detection was carried out at 380 nm.
Quercetin glycosides were analyzed following the method of Ivanov et al. 28 The quercetin glycosides (Sigma-Aldrich) were used as standards to build calibration curves. The detection was carried out at 370 nm.
Isolation of EO
The laurel fruits were subjected to hydrodistillation for 3 hours in a laboratory glass apparatus of the British Pharmacopeia, modified by Balinova and Diakov. 29 Then, the fruits were cut (since the EO is accumulated endogenously), peeled, separated manually into shells, and seeds, and air dried for 10 days at room temperature (20°C).
Chemical Composition of EO
Gas chromatography (GC) analysis was performed using an Agilent 7890A gas chromatograph (column HP-5 ms: 30 m × 250 μm × 0.25 μm; temperature: 35°C/3 minutes, 5oC/min to 250°C for 3 minutes, total 49 minutes; carrier gas helium: 1 mL/min constant speed; split ratio of 30:1). The GC/MS analysis was carried out on an Agilent 5975C mass spectrometer using helium as a carrier gas and the same column and temperature conditions as the GC analysis.
Antimicrobial Activityof EOs
The antimicrobial effects of both EOs were tested against Gram-positive bacteria Bacillus cereus (ATCC 11778) and 2 strains of Staphylococcus aureus (ATCC 6538 and 1 food spoilage isolate), as well against the following Gram-negative bacteria: 2 strains of Escherichia coli (ATCC 25922 and 1 food spoilage isolate), 2 strains of Salmonella abony (ATCC 6017 and 1 clinical isolate), 2 strains of Pseudomonas aeruginosa (ATCC 27853 and 1 clinical isolate), and a food spoilage isolate of Pseudomonas fluorescens (sources given in Table 3). Additionally, antimicrobial testing against 2 strains of C. albicans (ATCC 10231 and 1 clinical isolate) was performed. All strains were deposited in the Microbial Culture Collection of the Department of Biochemistry and Microbiology (“Paisii Hilendarski” University of Plovdiv, Plovdiv, Bulgaria). The bacterial strains were stored on Nutritional Agar (NA, HiMedia Laboratories Ltd., India), and the yeast strains were stored on Sabouraud Dextrose Agar with chloramphenicol (SDA, HiMedia Laboratories Ltd.).
Bacterial cultures were prepared by inoculating about 2 mL of Muller-Hinton Broth (MHB, HiMedia Laboratories Ltd.) with 2 to 3 colonies selected from NA. Cultures were incubated at 37°C for 24 hours. For preparation of the inoculum overnight, cultures were diluted in sterile MHB to achieve an absorbance of 0.5 McFarland turbidity standard. A bench top densitometer was utilized to measure turbidity of the cell suspensions (DEN-1, Grant Instruments, Ltd., Shepreth, United Kingdom). The yeast cultures were prepared following the same procedure, except Sabouraud Dextrose Broth (SDB, HiMedia Laboratories Ltd.) which was used instead of MHB.
Stock solutions of EOs for antimicrobial testing were prepared by dispersing the respective sample in 2% dimethyl sulfoxide (DMSO; Sigma-Aldrich). Stock solutions were added to the RPMI1640 broth medium buffered to pH 7.0 with 0.165 mol/L 3-N-morpholinopropanesulfonic acid (MOPS) buffer (Sigma-Aldrich) to reach dilutions in the final sample concentrations, after inoculation with microbial test suspension, between 10.24 and 80 µg/mL. Controls were also prepared consisting of inoculated medium without the EO sample and with and without DMSO. The DMSO concentration in the broth dilution assay was kept low in order to minimize the effect on microbial growth.
Antibacterial activity of EOs was performed according to the Clinical Laboratory Standard Institute 30 reference method for antimicrobial disk susceptibility tests and the reference method for dilution antimicrobial susceptibility tests for bacteria that grow aerobically. 31 Anticandidal activity of both EOs was performed according to the CLSI reference method for antifungal disk diffusion susceptibility testing of yeasts 32 and the reference method for broth dilution antifungal susceptibility testing of yeasts. 33
Antimicrobial activity of EOs determined by disk diffusion tests was expressed as inhibitory zone diameter measured to the nearest millimeter on the antibiotic zone scale (HiMedia Laboratories Ltd., India). Antimicrobial activity of EOs determined by broth microdilution tests was expressed as minimal inhibitory concentration (MIC) in µg/mL. Minimal inhibitory concentration was defined as the lowest concentration of the EO at which the total inhibition of microbial growth was detected.
The antimicrobial activity of Ciprofloxacin (CPH 5 µg/disk, HiMedia Laboratories Ltd., India) and Fluconazole (FLC 25 µg/disk, HiMedia Laboratories Ltd., India) was also determined as positive control. Minimal inhibitory concentrations of Ciprofloxacin (CPH MIC strip 0.016-256 µg/mL, HiMedia Laboratories Ltd.) and Fluconazole (FLC MIC strip, 0.016-256 µg/mL, HiMedia Laboratories Ltd.) were also determined as positive controls using the HiComb MIC test (HiMedia, Laboratories Ltd., India) which was carried out according to the manufacturer’s instructions. All tests were performed in triplicate.
Isolation of Lipid Fraction
The dried parts of the fruits (shells and seeds) were ground with a laboratory mill to a size of 0.5 to 1.0 mm, and the lipid fractions extracted with n-hexane in a Soxhlet apparatus for 8 hours. 34
Fatty Acids
The total FA composition of the lipid fractions was determined by GC after transmethylation of the respective sample with 2% sulfuric acid in methanol at 50°C. 35 Determination was performed on a gas chromatograph equipped with a 75 m × 0.25 mm × 18 μm (I.D.) capillary Supelco column and a flame ionization detector. The column temperature was programmed from 140оC (5 minutes) to increase at 4 оC/min to 240оC (3 minutes); injector and detector temperatures were 250°C. Hydrogen was the carrier gas at a flow rate of 0.8 mL/min; the split ratio was 50:1. Identification was performed by comparison of retention times with those of a standard mixture of fatty acid methyl esters subjected to GC under identical experimental conditions. 36
Sterols
Unsaponifiables were determined by weight after saponification of the lipid fractions and extraction with n-hexane. 37 Sterol composition was determined by GC using a HP 5890 gas chromatograph equipped with a 25 m × 0.25 mm DB-5 capillary column and a flame ionization detector. The temperature gradient started at 90°C (2 minutes), raised to 290°C at a rate of 15°C/min, and finally to 310°C (10 minutes) at a rate of 4°C/min; the injector temperature was 300°C and the detector temperature 320°C. Hydrogen was the carrier gas at a flow rate of 0.8 mL/min, with a split ratio 50:1. Identification was confirmed by a comparison of retention times with those of a standard mixture of sterols. 38
Tocopherols
Tocopherols were determined directly in the lipid fractions by HPLC using a Merck-Hitachi unit equipped with a 250 mm × 4 mm Nucleosil Si 50-5 column and a fluorescent detector Merck-Hitachi F 1000. The operating conditions were as follows: mobile phase n-hexane:dioxan (96:4 by volume) at flow rate of 1.0 mL/min. The detector was set at excitation 295 nm and emission 330 nm. A volume of 20 µL of 1 g/100 mL solution of crude lipid fraction in n-hexane was injected. Tocopherols were identified by comparing the retention times to those of authentic individual tocopherols standards. The tocopherol content was calculated through comparison of tocopherol peak areas in the sample vs the tocopherol peak area of the standard tocopherol solution. 39
Phospholipid Content
The quantification of phospholipids was carried out spectrophotometrically by measuring the phosphorous content at 700 nm after mineralization of the lipid fraction with a mixture of perchloric acid and sulfuric acid (1:1, v/v). 40
Cellulose Content
Cellulose content was determined by the method of Brendel et al. 41
Protein Content
For measuring protein content, the Kjeldahl procedure was used according to the Association of Official Agricultural Chemists (AOAC) 42 method with the UDK 152 System (Velp Scientiffica, Italy)
Statistics
The measurements were made in triplicate (n = 3). The results are presented as mean value of the individual measurements with the corresponding standard deviation (mean ± SD).
Supplemental Material
Supplementary material - Supplemental material for Phytochemical Investigations of Laurel Fruits (Laurus nobilis)
Supplemental material, Supplementary material, for Phytochemical Investigations of Laurel Fruits (Laurus nobilis) by Zhana Petkova, Galina Stefanova, Tania Girova, Ginka Antova, Magdalena Stoyanova, Stanka Damianova, Velizar Gochev, Albena Stoyanova, and Valtcho D. Zheljazkov in Natural Product Communications
Footnotes
Declaration of Conflicting Interests
The author(s) declared no potential conflicts of interest with respect to the research, authorship, and/or publication of this article.
Funding
The author(s) received no financial support for the research, authorship, and/or publication of this article.
References
Supplementary Material
Please find the following supplemental material available below.
For Open Access articles published under a Creative Commons License, all supplemental material carries the same license as the article it is associated with.
For non-Open Access articles published, all supplemental material carries a non-exclusive license, and permission requests for re-use of supplemental material or any part of supplemental material shall be sent directly to the copyright owner as specified in the copyright notice associated with the article.