
Abstract
Rosmarinus officinalis L. is an aromatic plant belonging to the Lamiaceae family widely distributed in the Mediterranean area. The interest on this species is related to the multiple uses of the plant as a food ingredient, in the pharmaceutical and cosmetic industries. The chemical composition of essential oil (EO) from 5 accessions of R. officinalis L., collected monthly through a full year in Sardinia, has been studied by gas chromatography (GC) and GC-mass spectrometry technique. The EO ranged from 0.29% to 0.89%. The qualitative determinations revealed the presence of 27 compounds belonging to 6 chemical groups (hydrocarbon monoterpene, alcohols, aldehydes, ketones, esters, hydrocarbon sesquiterpene). Overall the GC-flame ionization detector analysis showed the presence of 7 major compounds: α-pinene (26%-28%), camphene (5%-8%), 1,8-cineole (15%-25%), borneol (5%-11%), camphor (3%-12%), verbenone (6%-15%), and bornyl acetate (4%-7%). Chromatographic data were also subjected to a chemometric approach that evidenced discrimination of the samples according to the site of collection.
Rosmarinus officinalis L. is an aromatic and medicinal plant widely spread in the Mediterranean area. Rosemary is a well-known shrub with a typical strong smell, belonging to the Lamiaceae family, which includes about 3500 plant species. This evergreen plant is very abundant in the costal region of the Mediterranean, and it is very common in Sardinia, where wild populations have found a specific essential oil (EO) composition. 1 The interest on this species is associated with the multiple uses of the plant: as aromatic plant, it is well appreciated for the culinary quality of its leaves; as shrub, it is useful as ornamental plant in garden; finally, the high production of phenol biological compounds and EOs made rosemary the most used medicinal and aromatic plant worldwide. 2 Antibacterial, 3 -5 antifungal, 6,7 anticancer, 8,9 and antioxidant 10 -13 proprieties have been found in the EO extracted from its leaves. The production of secondary metabolites is affected, as in many other plants, 14 by environmental conditions; in literature are reported examples of the variability of both polar fraction 15 and volatile organic compounds. 16,17
On the basis of EO composition and the principal compounds characterizing the volatile fraction of rosemary, 3 principal chemotypes can be identified 18 : chemotype I, with a high content of 1,8-cineole; chemotype II, with a content of camphor >20%; chemotype III, with a content of verbenone >15%. Conventionally the chemotypes reported above are also called cineoliferum, camphoriferum, and verbenoniferum, respectively. Jordan et al 16 reported high variability in rosemary EO composition in wild populations based on several environmental factors. The qualitative and quantitative composition and yield of the EO are influenced by the place of origin, 19 environmental conditions, 20 plant development stage, 21 and harvest time. 22 More recently, studies have reported that even the soil type and its composition could influence the EO profile of aromatic plant in the Mediterranean area. 23,24 Chemical compositional and temporal variations in rosemary EO have been reported in southern Spain. 25 In this case, the chemical variability of the EO profile was deeply influenced by geographical area. 26
To the best of our knowledge, no previous studies have explored the monthly variation in EO composition of R. officinalis through a full year of exploration in Sardinia. The aim of the study is to (i) assess the influence of meteorological condition on the qualitative and quantitative composition of EO in a specific area of Sardinia and (ii) evaluate the effect of environmental content in the EO profiles through monthly observations.
The seasonal EO yield, water content, and DW from rosemary leaves and branch and the plant origin are reported in Tables 1 and 2. The EO yield of all 5 R. officinalis accessions ranged from 0.29% to 0.89%. The minimum EO percentage was found in RMD2 sample while the highest EO content was found in RPC accession. Overall, the analyzed plants showed the highest EO percentage in summer in all accessions. The lowest yield is recorded in winter (RMD3, RCC, RPC) and spring (RMD1, RMD2). Variation in the EO content based on the accession and the season was statistically significant (P < 0.001). As reported by Hassanzadeh et al, 27 the phenological stage of rosemary has a significant impact on EO production. Before and during full flowering stages, the authors reported the highest content of EOs in rosemary plants. R. officinalis flowering is highly associated with the environmental conditions, and in particular, this phenological stage tends to anticipate at low altitude and near to the sea. In the coastal area, the flowering season starts in summer and proceeds until the beginning of winter. Therefore, the maximum EO production corresponds to the summer-autumn period, while the minimum EO production is associated with the vegetative stage that occurs in winter-spring. 28 The effect of the maximum temperature of summer (36.7°C ± 3.1°C) and low rain (15.1 ±7 mm), as expected, induced a significant seasonal reduction of plant water content and a parallel increased DW in all the tested accessions (Table 3). An opposite trend was observed during winter, where the minimum temperature and higher water availability (based on the rain precipitation) induced a consequent increase in water content and decrease in DW. Both water percentage and DW were significantly affected by the season, while the accession did not influence these 2 parameters.
Seasonal Essential Oil (EO) Yield, Water Content (%), and Dry Weight (g) of Rosmarinus officinalis Accessions Collected From 5 Sampling Sites.

n.s., not significant.
Probability of significant ANOVA results was also reported.
aThe analysis of variance (ANOVA) table shows the results of a 2-way ANOVA performed using season (A) and accession (B) as factors. Means separation was performed by Fisher’s least significant difference (LSD) procedure (P < 0.05) and the LSD value is provided.
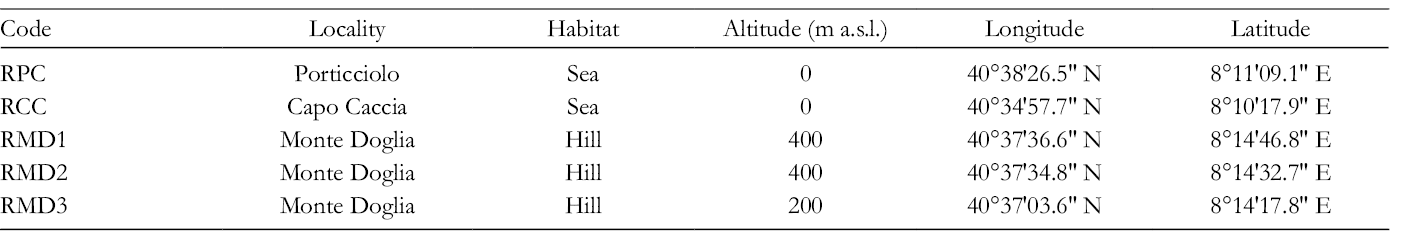
Rosmarinus officinalis L. Sampling Sites.
Climatic Condition of the Sampling Site.

Spring, summer, autumn, and winter average temperatures (average, Av. Temp; maximum, Av. Max. Temp; minimum, Av. Min. Temp), maximum and minimum temperatures (Max. Temp, Min. Temp, respectively), and rain precipitation mm were obtained from the 1991 to 2016 data series. In table are reported the average value ± the standard deviation.
The rosemary EO composition has been reported by several research studies. 16,29-31 A total of 27 compounds, belonging to 6 chemical groups (hydrocarbon monoterpene, alcohols, aldehydes, ketones, esters, hydrocarbon sesquiterpene), were identified as reported in Table 4. Seven compounds represent the predominant chemical fraction of rosemary EO: α-pinene, camphene, 1,8-cineole, borneol, camphor, verbenone, bornyl acetate (Table 4). The identified principal compounds are in agreement with the Sardinian rosemary “α-pinene\borneol\bornyl acetate\verbenone” chemotype previously described by Pintore et al 1 and later by Angioni et al. 31 Accession and season significantly affect the EO composition of R. officinalis. Despite the fact that these compounds are highly represented in the EO composition, only a few of them were produced differentially based on accession and season. Camphene, 1,8-cineole, borneol, camphor, and verbenone varied according to the accession (Table 4).
The Main Constituents of Essential Oil of Rosemary as Affected by Growing Location and Harvest Season.

RI, retention index on HP5 column.
Average values of 12 months and standard deviations are reported for each accession. In addition, the average seasonal values and standard deviations are also reported. In bold are reported the most produced compounds.
As shown in Table 4, 15 compounds are produced differently based on the genotype. β-Pinene, γ-terpinene, α-terpinolene, and bornyl acetate significantly varied during the 4 seasons. β-Pinene and bornyl acetate showed the maximum production during spring, while the lowest was found in autumn (3.1 and 0.8; 6.8 and 4.8, respectively); γ-terpinene and terpinolene showed the highest production during summer (0.8 and 0.7, respectively), while the minimum values (0) were found in winter and autumn, respectively.
In addition, relative percentages of α-terpinolene and bornyl acetate are influenced by both accession and seasonal conditions. According to these data, it seems that the accession and environmental conditions affect the EO composition of both the principal and minor compounds.
Data on the volatile fraction obtained by internal normalization of the FID chromatograms were subjected to multivariate analysis. The raw matrix composed of the volatile organic compounds was detected and all the samples were subjected to principal component analysis (PCA). Analyzing the loading plot is possible to evaluate which variables mainly contain the information able to discriminate the samples (the farther from zero) and, in contrast, which variables are mainly involved in increasing the noise of the model (the closer to zero). Myrcene, camphor, geraniol, α-fenchene, trans-caryophyllene, and ocimene were located closer to zero in the loadings plot meaning that their contribution to the discrimination was not relevant. For this reason, those variables were removed from the dataset and a new PCA was then performed. After PCA of the new matrix, the explained variance of the first 2 components increased to about 40%. In the score plot, the samples resulted partially separated in 3 groups in the plane obtained by the first 2 principal components according to the geographical area of the plant grown (Figure 1a). The influence on the model of each variable is reported in the loading plot; α-campholenal, iso-borneol, and cis-carveol are characteristic, with respect to the other samples, of MD plants since they are located in the area corresponding to the MD samples in the score plot; 1,8-cineole and α-terpineol are found in high concentration, when compared with other samples, in RPC samples, while the RCC samples are characterized by a high amount of linalool, borneol, t-pinocarveol, and verbenone (Figure 1b). In contrast, the chemometric approach does not highlight any discrimination between samples collected in the different seasons.

Principal component analysis of volatile organic compounds from Rosmarinus officinalis populations. (a) Score plot, (b) loading plot. Nomenclature of volatile compounds (variables): α-pinene, V1; camphene, V2; α-pinene, V3; α-phellandrene, V5; Δ3-carene, V6; α-terpinene, V7; 1,8-cineole, V8; γ-terpinene, V9; t rans-sabinene hydrate, V10, α-terpinolene, V11; linalool, V12; campholenal, V13; t rans-pinocarveol, V15; borneol, V16; terpinen-4-ol, V17; α-terpineol, V18; verbenone, V19; iso-borneol, V20; cis-carveol, V21; bornyl acetate, V23; α-citronellol, V24. Samples are listed according to the code reported in Table 1 (RPC, RCC, and RMD1, 2, and 3) and the months of collections (1-12).
In conclusion, the harvesting time of different R. officinalis accessions significantly affected the EO yield and composition. In summer, a general higher EO yield was observed for all accessions compared to the other seasons. Besides the yield, the EO composition also varied based on the accession and season. Seven compounds (α-pinene, camphene, 1,8-cineole, borneol, camphor, verbenone, bornyl acetate) were highly produced in all seasons with a dominant presence during summer. In addition to the major compounds, few minor compounds showed a significant variation based on the period of the year. These findings will be useful to efficiently select the best season for the qualitative and quantitative composition of R. officinalis EO.
Experimental
Sampling Sites, Plant Material, and Essential Oil Extraction
Rosmarinus officinalis L. was collected from 3 sampling sites in the natural reserve of Capo Caccia (Alghero, Sassari, Italy) (Table 1). Monthly collected aerial parts of each plant were subjected daily to steam distillation according to the European Pharmacopoeia protocol (2002). A sample of about 100 g precisely weighed R. officinalis leaves was subjected to hydrodistillation using a Clevenger-type apparatus for 2 hours. The yield of the EOs was calculated on the dry weight. The dry weight was determined by weighing a measured amount (about 10 g exactly weighed) of fresh material for each sample, which was dried at 40°C in an oven until constant weight. The collected EOs were dried under anhydrous sodium sulfate (Na2SO4) and then stored under a nitrogen atmosphere at 4°C in amber glass vials until use. Two samples were collected for each month. Results in Table 4 are expressed as mean ± standard deviation.
Chemicals and Reagents
Unless stated otherwise, all chemicals and reagents were supplied by Sigma (Dorset, UK). For the following terpenoid compounds commercial reference standards were used: α-pinene, verbenene, β-pinene, myrcene, α-phellandrene, α-terpinene, p-cymene, 3-carene, limonene, 1,8-cineole, γ-terpinene, terpinolene, linalool, camphor, borneol, terpinen-4-ol, α-terpineol, myrtenol, verbenone, and bornyl acetate.
Gas Chromatography Mass Spectrometry Analysis
Gas chromatography (GC)-mass spectrometry (MS) analysis of the EO in hexane (dilution ratio 1:100) was carried out using an Agilent 7890 GC equipped with a Gerstel MPS autosampler, coupled to an Agilent 7000C MSD detector. Chromatographic separation was performed on a HP-5MS capillary column (30 m × 0.25 mm, film thickness 0.17 μm), using the following temperature program: 60°C held for 3 minutes, then increased to 210°C at a rate of 4°C/min, then held at 210°C for 15 minutes, before increasing to 300°C at a rate of 10°C/min, and finally held at 300°C for 15 minutes. Helium was used as the carrier gas at a constant flow of 1 mL/min.
A mixture of aliphatic hydrocarbons (C9-C23; Sigma-Aldrich, USA) in n-hexane was injected under the abovementioned chromatographic conditions to calculate the linear retention indices using the generalized equation of Van den Dool and Kratz (1963): Ix = 100[(tx - tn)/(tn +1 - tn) +n], where t is the retention time, x is the analyte, n is the number of carbons belonging to the alkane that elutes before the analyte, and n + 1 is the number of carbons belonging to the alkane that elutes after the analyte.
For data analysis, a Mass Hunter Workstation B.06.00 SP1 was used. Identification of the individual components was performed by comparison with the co-injected pure compounds (see the section “Chemicals and Reagents”) and by matching the MS fragmentation patterns and retention indices with the built-in libraries or literature data or commercial mass spectral libraries (NIST/EPA/NIH 2008; HP1607 purchased from Agilent Technologies).
Gas Chromatography-Flame Ionization Detector Analysis
GC analysis of the EO in hexane (dilution ratio 1:100) was conducted using an Agilent 4890N instrument equipped with a flame ionization detector (FID) and a HP-5 capillary column (30 m × 0.25 mm, film thickness 0.17 µm). The column temperature program was the same as described above for the GC-MS analysis.
The constituent’s quantification in the R. officinalis EOs was carried out using the internal standard method, injecting a solution of EOs in hexane (dilution ratio 1:200). A calibration curve was built for each matching standard compound in the EOs. When standards were unavailable, quantification was performed with a calibration curve of a compound of the same class of volatiles. Data were expressed in weight-to-weight percentage (w/w%).
Meteorological Conditions
Altitude level, geographic localization, and climatic conditions were recorded (Tables 1 and 2). Meteorological data were provided by “Settore Idrografico della Regione Sardegna.” Seasonal meteorological parameters were obtained for the monthly data. Monthly precipitation and temperatures (average, maximum, and minimum) of historical series (1991-2016) were considered (Table 2).
Statistical Analysis and Principal Component Analysis
Correlations of EO production and composition and seasonal trends were calculated. All data were subjected to analysis of variance. All meteorological variables were standardized before the statistical analysis. Correlations were carried out by JMP 7 software (SAS Institute, Cary, NC, USA). GLM was run to evaluate the effect of the variables.
The multivariate analysis of samples was carried out subjecting the GC-FID data to PCA. The relative percentages of VOCs data of each EO were used to define a matrix m × n where m are the samples and n the variables. The data were centered and autoscaled before the PCA. All PCA analyses were performed with R-based chemometric software designed by Chemometric group of Chemical Italian Society.
Footnotes
Declaration of Conflicting Interests
The author(s) declared no potential conflicts of interest with respect to the research, authorship, and/or publication of this article.
Authors’ Note
Sara Melito and Giacomo Luigi Petretto contributed equally to this work.
Funding
The author(s) received no financial support for the research, authorship, and/or publication of this article.