
Abstract
Xanthones are the main active constituents isolated from Garcinia mangostana L. (Hypericaceae). Among these, α-mangostin (
Garcinia mangostana L. (Hypericaceae), commonly known as mangosteen, is considered as the “queen of tropical fruits.” The species is native to Southeast Asia and highly regarded among connoisseurs as one of the best-tasting fruits. For centuries, the pericarp of this fruit has been marketed for its health benefits as a functional food and in dietary supplements.
1,2
Prenylated and oxygenated xanthone derivatives are the main secondary metabolites identified and isolated in the species.
1
-3
The most abundant are α-mangostin (
Unlike conventional drugs, there is no standardization of active ingredients in herbal supplements, resulting in considerable differences between the safety and efficacy of the preparations. 12 Therefore, investigations have shown that some products do not contain any measurable amount of the substances identified on the label, while others may contain up to 150% of the specified dose. The adulteration, either intentionally or otherwise, of botanical supplements with undeclared conventional pharmaceuticals or heavy metals is even more disturbing. 13
Even though G. mangostana is widely commercialized around the world as a crude drug for several herbal preparations, the back-of-pack label for mangosteen supplements often shows the total extract content, ie, the amount of individual xanthones is not specified; and a routinely analytical procedure to determine the content of α-mangostin (
The most adequate separation, with the highest resolution between the major components γ- (

Typical HPLC chromatogram of the methanol extract of mangosteen.
Next, the method was fully validated according to the International Conference on Harmonization (ICH) guidelines and was evaluated for its selectivity, linearity, precision, accuracy, and robustness. 14 The overall results are summarized in Table 1.
Method Validation Parameters.
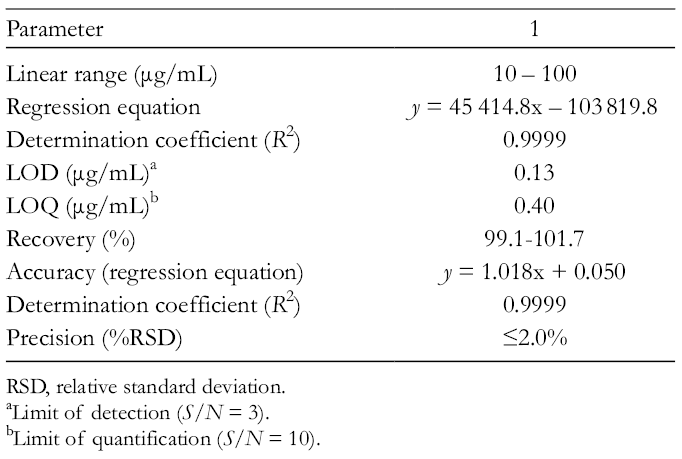
RSD, relative standard deviation.
aLimit of detection (S/N = 3).
bLimit of quantification (S/N = 10).
The linearity of the system was determined using calibration curves. All the curves were plotted based on a least squares regression analysis of peak area (y) vs concentration (x; μg/mL) of the standard solution at 5 different concentrations in the range of 10 to 100 µg/mL with correlation coefficient >0.9999.
The accuracy of the method was evaluated by recovery experiments spiking 5 concentrations of
The intra- and interday precision RSDs were under 2.0%. The repeatability variation was also under 2.0%. Altogether, the results indicate that the method was precise, accurate, and linear for the quantification of
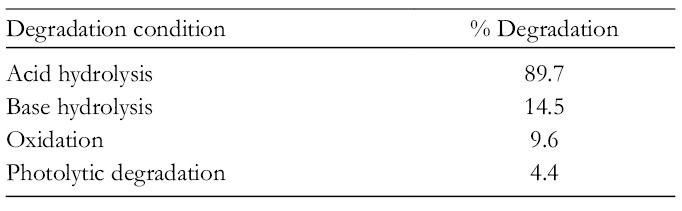
Until now, no stability-indicating method has been reported for analyzing
Stress Degradation Studies Results.
Thus, the proposed method was successfully applied for long-term and accelerated stability studies of
A robustness test was performed to evaluate the effect of small, but deliberate variation in a method parameter test. For robustness assessment, a 23 factorial design was used as statistical tool, and the adequacy of the model was evaluated showing that when acetonitrile and flow rate decrease, an improvement in resolution occurs (P value <0.05). In addition, the fit of the model to the data was evaluated by analysis of variance. The high value of the coefficient of determination for the response evaluated (R 2 = 0.988) indicated the suitability of the model. Lastly, the mathematical model afforded to define the best chromatographic system for quantification as 80% of acetonitrile content in the mobile phase, flow rate of 1.0 mL/min, and 10 µL for injection size.
Finally, the developed and validated method was used for the quantification of
Content of α-Mangostin (1) in Mangosteen Dietary Supplements.

UPLC-/MS was employed to confirm the identity of α-mangostin (

Typical ion current chromatogram in positive and negative modes (ESI) of α-mangostin (1) for the stability studies.
To investigate the possible stability issues of the extract, an accelerated stability study was carried out according to the ICH regulation at 40°C/75 relative humidity (RH) during 1, 2, 3, and 6 months. Evaluation of the extracts showed no significant changes in the content of α-mangostin (
Stability Testing of α-Mangostin (1) in Garcinia mangostana Extract Under Controlled Room Temperature and Humidity.
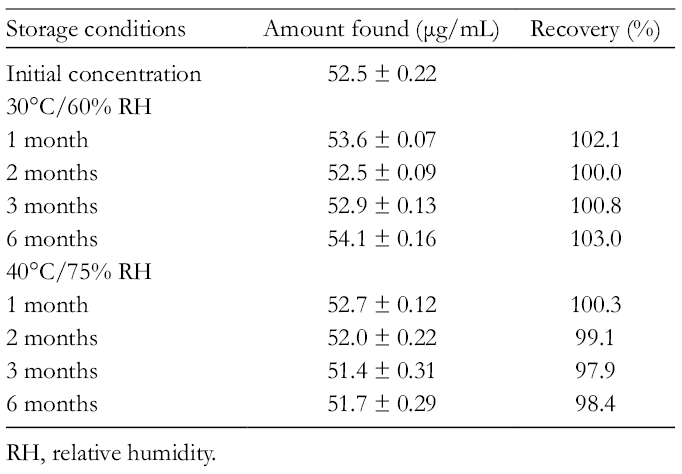
RH, relative humidity.
According to the global results, a simple and reliable HPLC analytical method was developed and fully validated for quantifying α-mangostin (
Furthermore, the method was highly specific for the quantification of
Experimental
Plant Material and Reagents
All solvents used were of analytical and HPLC-grade from Honeywell Burdick and Jackson (Morristown, NJ, USA). TFA, formic acid, and α-mangostin (
Dry powdered mangosteen pericarp (100 g) was exhaustively extracted by maceration with methanol at room temperature. The extract was filtered and the solvent was evaporated to dryness under reduced pressure at 70°C using a rotary evaporator yielding the crude extract.
Instrumentation and Chromatographic Conditions
The HPLC system consisted of a Shimadzu instrument equipped with a degasser (DGU14A), a quaternary pump (LC-10ATVP), an autosampler (SIL-10ADVP), a column oven (CTO-10A), a diode array detector (SPD-10A), and a computer with the LC Solution software for data analysis. All analyses were performed using a C18 stationary phase in a Purospher STAR column (150 mm × 4.6 mm, 5 µm particle size). The mobile phase was an isocratic binary phase consisting of 0.1% TFA in water (A) and acetonitrile (B) (20:80) at a flow rate of 1.0 mL/min with an injection volume of 10 µL. The detection was monitored at 340 nm. The retention time (R
T) of
Accelerated and intermediate studies were performed according to ICH guidelines. 15 BINDER KBF stability chambers were used for all the stability studies. The storage conditions were 30°C and 65% RH for intermediate studies and 40°C and 75% RH for accelerated studies. The extract was placed in stability chambers that were taken out periodically in different months.
Preparation of Standard Solutions
The standard stock solutions were prepared by stepwise dilution of a solution with 10 mg of α-mangostin (
Sample Solution (Soft-Gelatin Capsules)
Test solutions were prepared by emptying the content of 20 individual dosage forms of each commercial product (soft-gelatin capsules) to determine their average weight. Then, an amount equivalent to 100 mg of extract was placed in a volumetric flask and 100 mL of methanol was added. This solution was filtered through a 0.45-µm PVDF membrane syringe filter for HPLC analysis.
Method Validation
The method was validated according to ICH guidelines.
14
The following characteristics were evaluated: selectivity, accuracy, precision, linearity, and robustness. The selectivity was assessed based on the peak purity function of the photolytic, oxidative, and hydrolytic degradation of
For accuracy, 3 replicates of the extract sample were spiked with standard compounds. The calibration curves were prepared in the concentration range expected for
Linearity of the calibration plot was evaluated by a least squares regression according to the correlation coefficients using Statgraphics XVI versión 16.1.03 software (Statpoints Technologies, Warrenton, VA, USA). Thus, the linearity of
Precision was determined based on the repeatability (intraday precision) and intermediate precision (interday precision) using the standard adding method. For system repeatability, 6 replicate analyses of the same solution containing 50 µg/mL of
The LOD was calculated as 3.3 times the SD at signal-to-noise (S/N) ratio and the LOQ was calculated as 10 times the SD.
Robustness of the method was assessed using a 23 factorial design. The factors evaluated were the following: acetonitrile content in the mobile phase; flow rate (mL/min); injection size (μL). The response evaluated was the resolution of peaks of 3-isomangostin and α-mangostin. The experiments were carried out in randomized order and in replicate (2 blocks). All analyses were performed using Statgraphics XVI versión 16.1.03 software. (StatPoint Technologies Inc, 2009, Warrenton, VA, USA).
Footnotes
Declaration of Conflicting Interests
The author(s) declared no potential conflicts of interest with respect to the research, authorship, and/or publication of this article.
Funding
The author(s) disclosed receipt of the following financial support for the research, authorship, and/or publication of this article: This work was supported by Facultad de Química, UNAM (PAIP-5000-9165).