
Abstract
Schisandra has been used to treat insomnia for hundreds of years in China. This study was aimed at proving the contribution of Schisantherin A (STA), the most abundant component in Schisandra, on sleeping, and uncover its mechanisms. Mouse autonomic activity and sleep tests were conducted for the behavioral examinations. The γ-aminobutyric acid (GABA), glutamic acid (Glu), and glutamic acid decarboxylase (GAD) in the blood and/or brain tissues of mice and rats were measured by enzyme-linked immunosorbent assay kits, and GABAA Rα1 and GABAA Rγ2 expressions in the brain tissues of rats were detected by reverse transcriptase polymerase chain reaction (RT-PCR) and Western blot. STA decreased the autonomic activities and sleep latency, increased the number of sleeping periods, sleep time, and duration in mice, showing a sedative and hypnotic effect. STA significantly elevated GABA, reduced Glu in the blood and brain, and increased GAD in the brain. STA upregulated the expressions of GABAA Rα1 and GABAA Rγ2 mRNA in the brain of rats. Thus, STA is an active component for sedative and hypnotic effects in Schisandra and these effects may be through its regulation of the GABA/Glu ratio, GAD, and GABAA expression in mice and rats.
Insomnia is a common disorder with a prevalence ranging from 31% to 56% in the general population. 1 Many studies demonstrate that γ-aminobutyric acid (GABA), one of the inhibitory neurotransmitters in the central nervous system, plays a key role in the pathogenesis of insomnia, 2,3 so that extensive studies on the management of insomnia have been carried out to seek drugs and supplements with the function of modulating the GABAergic nervous system. Schisandra chinensis Fructus (Schisandra), the dried ripe fruit of Schisandra chinensis Turcz. Baill., has been widely used for the treatment of insomnia for hundreds of years in China. 4,5 Schisantherin A (STA), a dibenzocyclooctadiene lignan derived from Schisandra, 6 can synergize with another 5 monomeric lignans of Schisandra to play a sedative and hypnotic effect. 7,8 Our previous study also revealed that Schisandra total lignans containing STA, and Schisandrin B had a good sedative and hypnotic effect. 9,10 We also identified Schisandrin B as one of the active components of Schisandra responsible for the sedative and hypnotic function through upregulating the expression of GABAA receptors and modulating the content of GABA and glutamic acid (Glu) in the peripheral blood and brain tissues. However, up to now, whether STA also contributes to the sedative and hypnotic function of Schisandra total lignans has not been reported. Therefore, this study was aimed to clarify the sedative and hypnotic effect of Schisantherin A by behavioral experiments in mice and to investigate the related mechanism with GABA as the target in both mice and rats.
Effects of STA on the autonomic activity and sleep quality in mice were observed for evaluating its sedative effect by a mouse autonomic activity recorder. The mice were intragastrically given different doses of either STA (1.75, 3.5, and 7 mg/kg) or diazepam (4 mg/kg) as the reference, or left untreated as a blank control. As shown in Figure 1a, in comparison with those in the blank control group, autonomic activities of the mice in the diazepam-treated and STA-treated groups (3.5 and 7 mg/kg) decreased significantly (P < 0.01, P < 0.05 and P < 0.01, respectively).
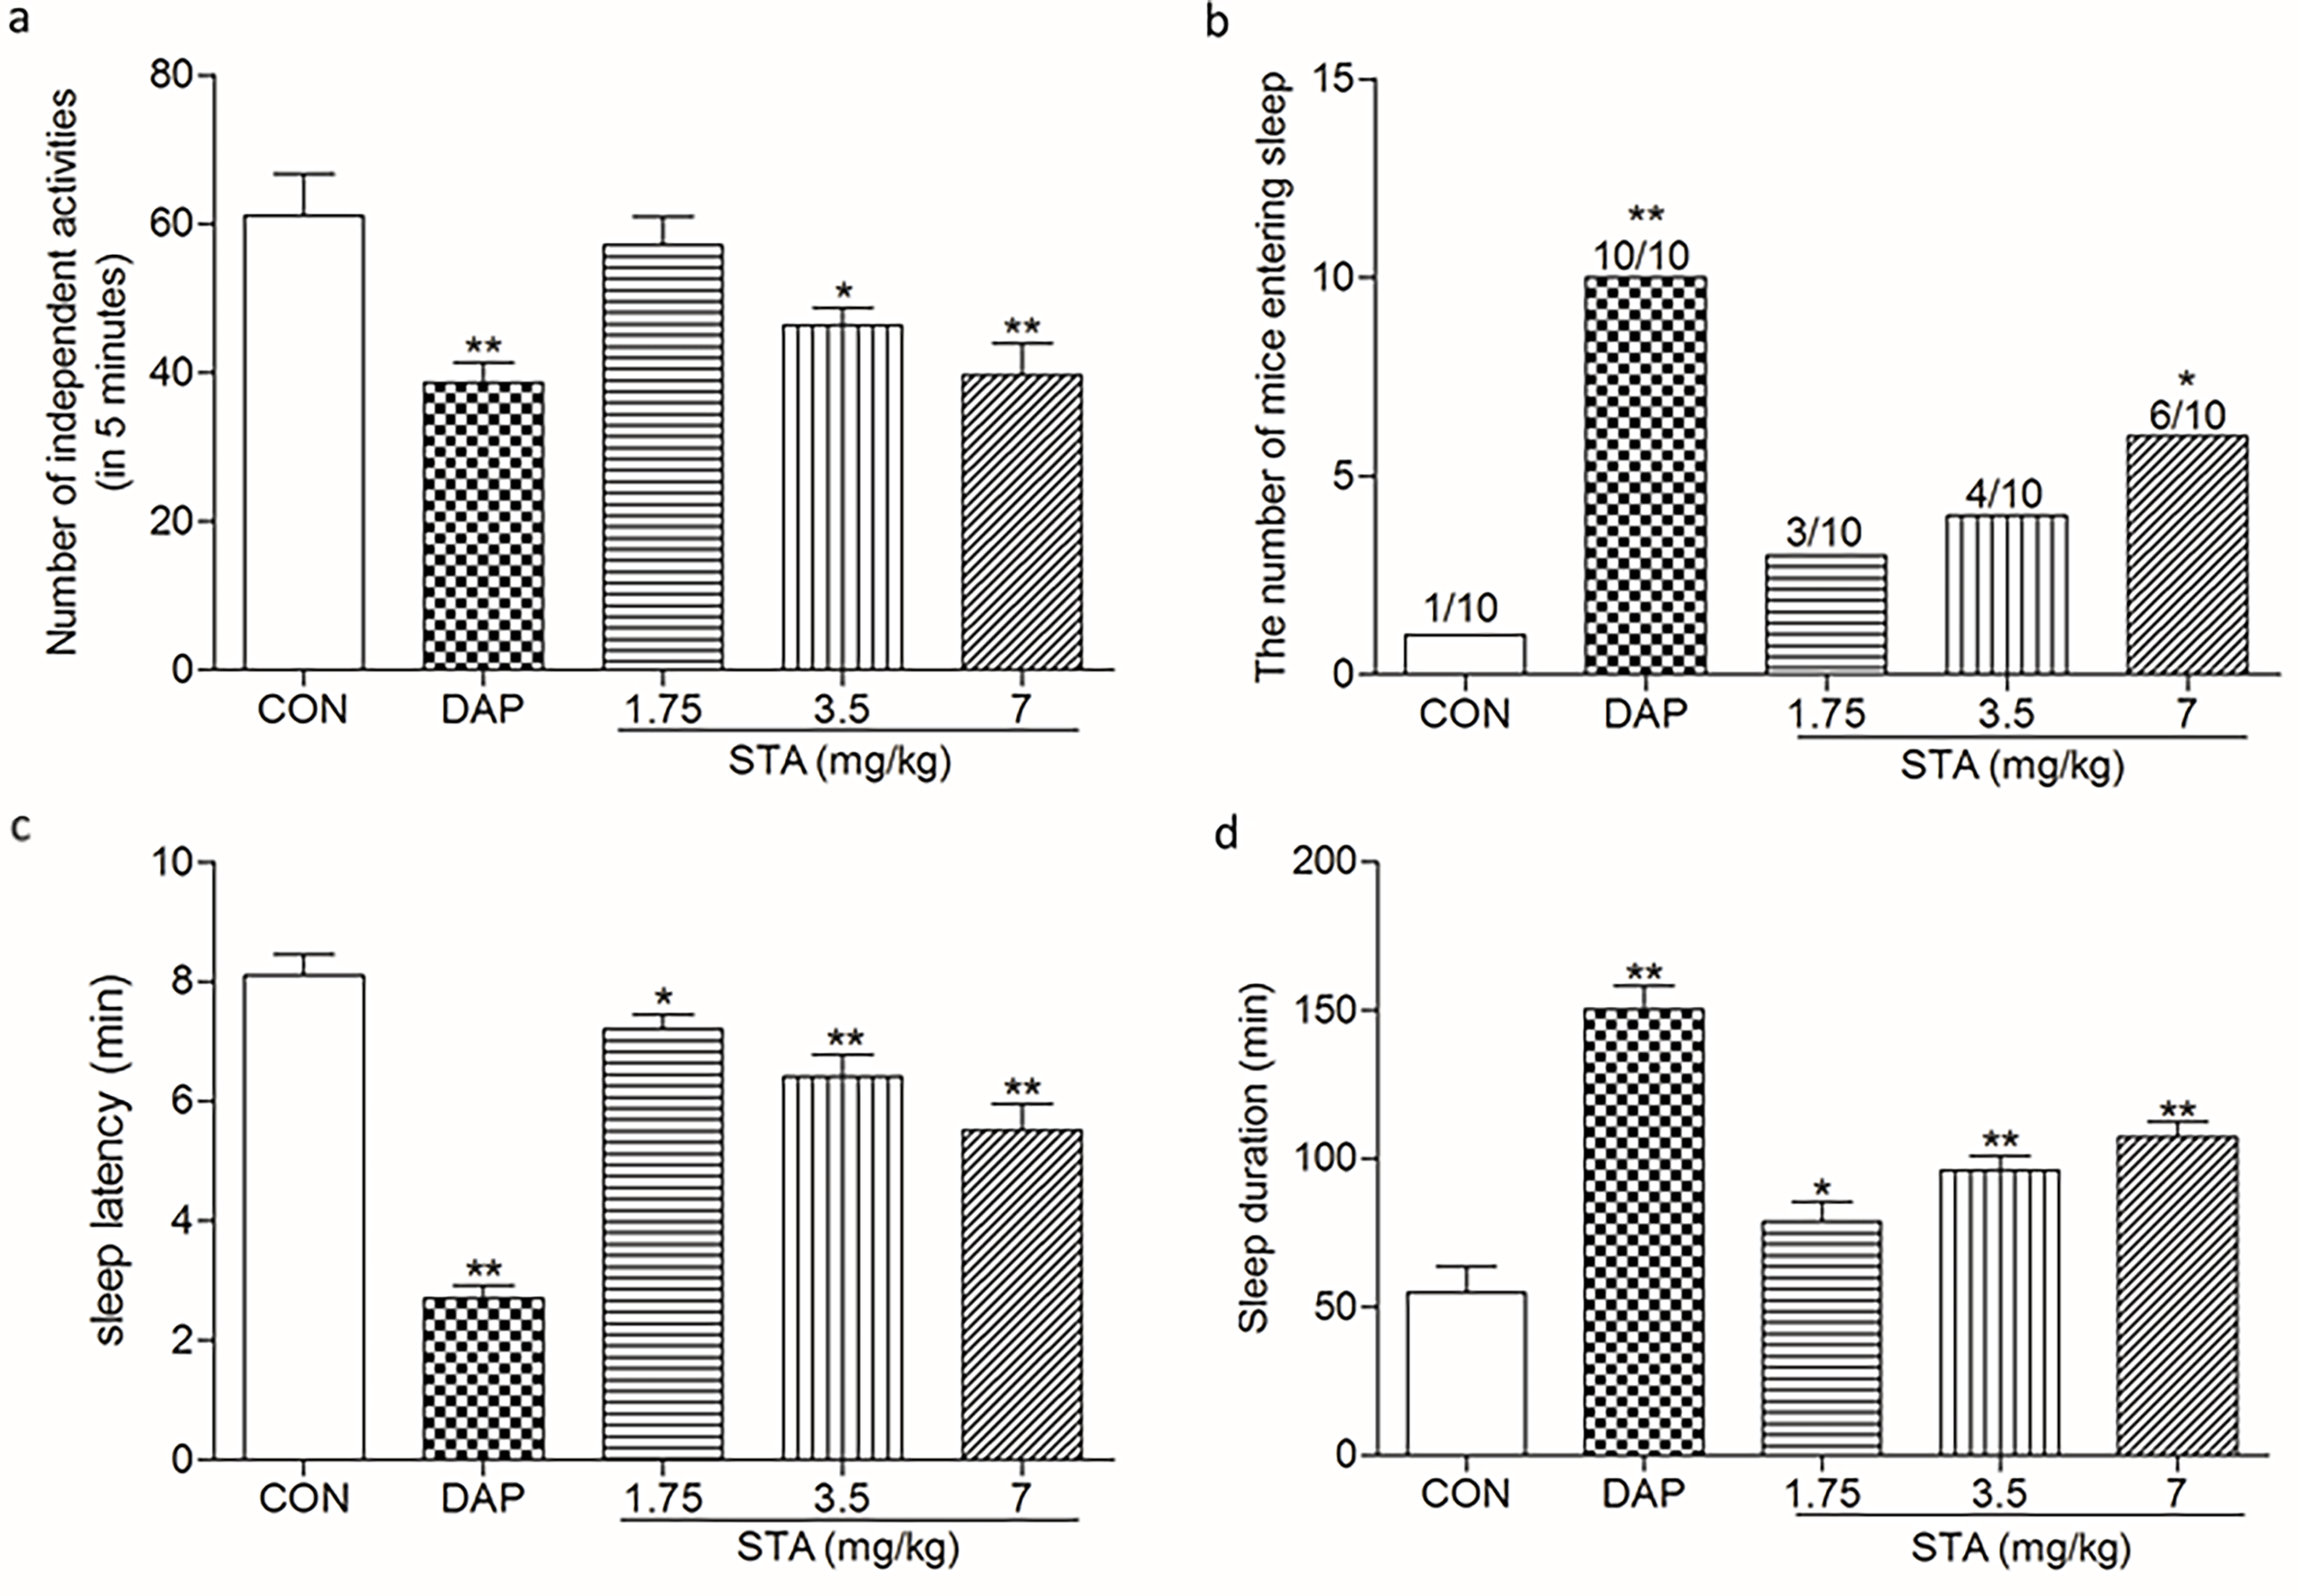
(a) Effects of STA on the autonomic activity of mice (mean ± SD, n = 10) *P < 0.05, **P < 0.01 vs the blank control group. (b) Effect of STA combined with the subthreshold dose of pentobarbital sodium on the numbers of sleeping mice (n = 10). *P < 0.05, **P < 0.01 vs the blank control group. (c) Effect of STA on the sleep latency of mice treated with threshold dose of pentobarbital sodium (mean ± SD, n = 10). *P < 0.05, **P < 0.01 vs the blank control group. (d) Effect of STA on the sleep duration of mice treated with threshold dose of pentobarbital sodium (mean ± SD, n = 10). *P < 0.05, **P < 0.01 vs the control group. CON: control group; DAP: Diazepam; STA: Schisantherin A.
To evaluate the hypnotic effect of STA, we performed a sleep test on mice treated with a subthreshold dose of pentobarbital sodium. As shown in Figure 1 (b), the numbers of sleeping mice in the diazepam-treated and STA (7 mg/kg) groups were significantly increased in comparison with the blank control group (P < 0.01, P < 0.05, respectively), indicating that STA plays a hypnotic role.
The sleep latency and sleep duration of mice treated with STA combined with the threshold dose of pentobarbital sodium were observed for evaluating the effect of STA on the sleep quality of mice. The sleep latency in the diazepam-treated and STA-treated groups (1.75, 3.5, and 7 mg/kg) was significantly shortened in comparison with the blank control group (P < 0.01, P < 0.05, P < 0.01, P < 0.01, respectively) (Figure 1 (c)), indicating that STA could potentiate the hypnosis of pentobarbital sodium.
The sleep duration of mice treated with STA combined with the threshold dose of pentobarbital sodium was observed for examination of the effect of STA on it. Diazepam was included in the test as the reference. As shown in Figure 1 (d), in comparison with that in the control group, the sleep duration of mice in the diazepam-treated and STA-treated groups (1.75, 3.5, and 7 mg/kg) was also significantly prolonged (P < 0.01, P < 0.05, P < 0.01, and P < 0.01, respectively), indicating that STA could synergize with pentobarbital sodium in prolonging the sleep duration of mice.
It is well known that GABA and Glu levels, as well as the GABA/Glu ratio, play important roles in the regulation of sleep. Therefore, we examined whether STA would affect the GABAergic nervous system. The levels of GABA and Glu were detected in the peripheral blood of mice treated with STA and distilled water. As shown in Figure 2, in comparison with the blank control group, STA in the 3.5 and 7 mg/kg groups increased GABA significantly (P < 0.01 for both), decreased the Glu level significantly (P < 0.05 for both), and increased the GABA/Glu ratio (also in 1.75 mg/kg group) significantly (P < 0.01 for all), suggesting that STA could modulate the GABAergic nervous system in mice.

Effects of STA on GABA and Glu levels in the peripheral blood of mice (mean ± SD, n = 10). (a-c) Effects of STA on the GABA and Glu levels, and GABA/Glu ratios, respectively, in the peripheral blood. *P < 0.05, **P < 0.01, vs the blank control group. CON: control group; GABA: γ-aminobutyric acid; GLU: glutamic acid ; STA: Schisantherin A.
To explore further the mechanism of sedation and hypnosis of STA related to the GABAergic nervous system, the rats were treated with STA, and then GABA and Glu were detected in their cerebral cortex, hippocampus, hypothalamus, and serum. The results showed that STA could significantly increase the GABA levels in all the brain tissues and serum (P < 0.05) and decrease the Glu levels in the cerebral cortex, hippocampus, hypothalamus, and serum (P < 0.01, P < 0.05, P < 0.05, and P < 0.05, respectively), and increase the GABA/Glu ratios in all brain tissues and serum (P < 0.01 for all brain tissues, P < 0.05, respectively) (Figure 3a-c).

Effects of STA on GABA, Glu and GAD levels in the brain tissues and peripheral blood of rats (mean ± SD, n = 6). (a-c) Effects of STA on GABA, Glu, and GAD levels and GABA/Glu ratios in the brain cortex, hippocampus, hypothalamus, and peripheral blood of rats, respectively. *P < 0.05, **P < 0.01, vs the blank control group. CON: control group; GABA: γ-aminobutyric acid; GAD: glutamic acid decarboxylase; Glu: glutamic acid; STA: Schisantherin A.
The enzyme glutamic acid decarboxylase (GAD), which is found almost exclusively in GABAergic neurons, catalyzes the conversion of Glu to GABA. 11 Therefore, we also investigated the changes of GAD levels in the brain tissues of rats (the cerebral cortex, hippocampus, and hypothalamus), as well as the peripheral blood. The results showed that STA significantly increased the GAD levels in the cerebral cortex, hippocampus, and hypothalamus (P < 0.05, P < 0.01, and P < 0.05, respectively) (Figure 3d), suggesting that STA could promote the conversion of Glu to GABA by upregulating the activity of GAD and then increase the GABA/Glu ratio to play a sedative and hypnotic role.
The physiological sedative and hypnotic effects of GABA are mainly via its specific binding to GABAA receptors (GABAAR). GABA acts on GABAAR to increase the permeability of Cl- across the nerve cell membranes. 12 To explore whether STA would have a regulatory effect on GABA receptors, in this study the expression of GABAAR was observed in the brain tissues of rats with and without STA. First, the expressions of GABAAR in the different brain tissues were analyzed at the mRNA level. As shown in Figure 4, in comparison with the blank control group, GABAA Rα1 and GABAA Rγ2 mRNA expressions were elevated significantly in the cerebral cortex, hippocampus, and hypothalamus in the STA groups (P < 0.01). Secondly, the expressions of GABAA Rα1 and GABAA Rγ2 in the rats’ brain tissues were also examined at the protein level. As shown in Figure 5, compared with those in the control group, the GABAA Rα1 and GABAA Rγ2 protein levels increased significantly in the cerebral cortex, hippocampus, and hypothalamus of rats treated with STA (P < 0.05 or P < 0.01). These results indicate that STA may regulate the sedation and hypnosis through modulating the GABAergic system, affecting both GABA and its receptors in the brain of rats.
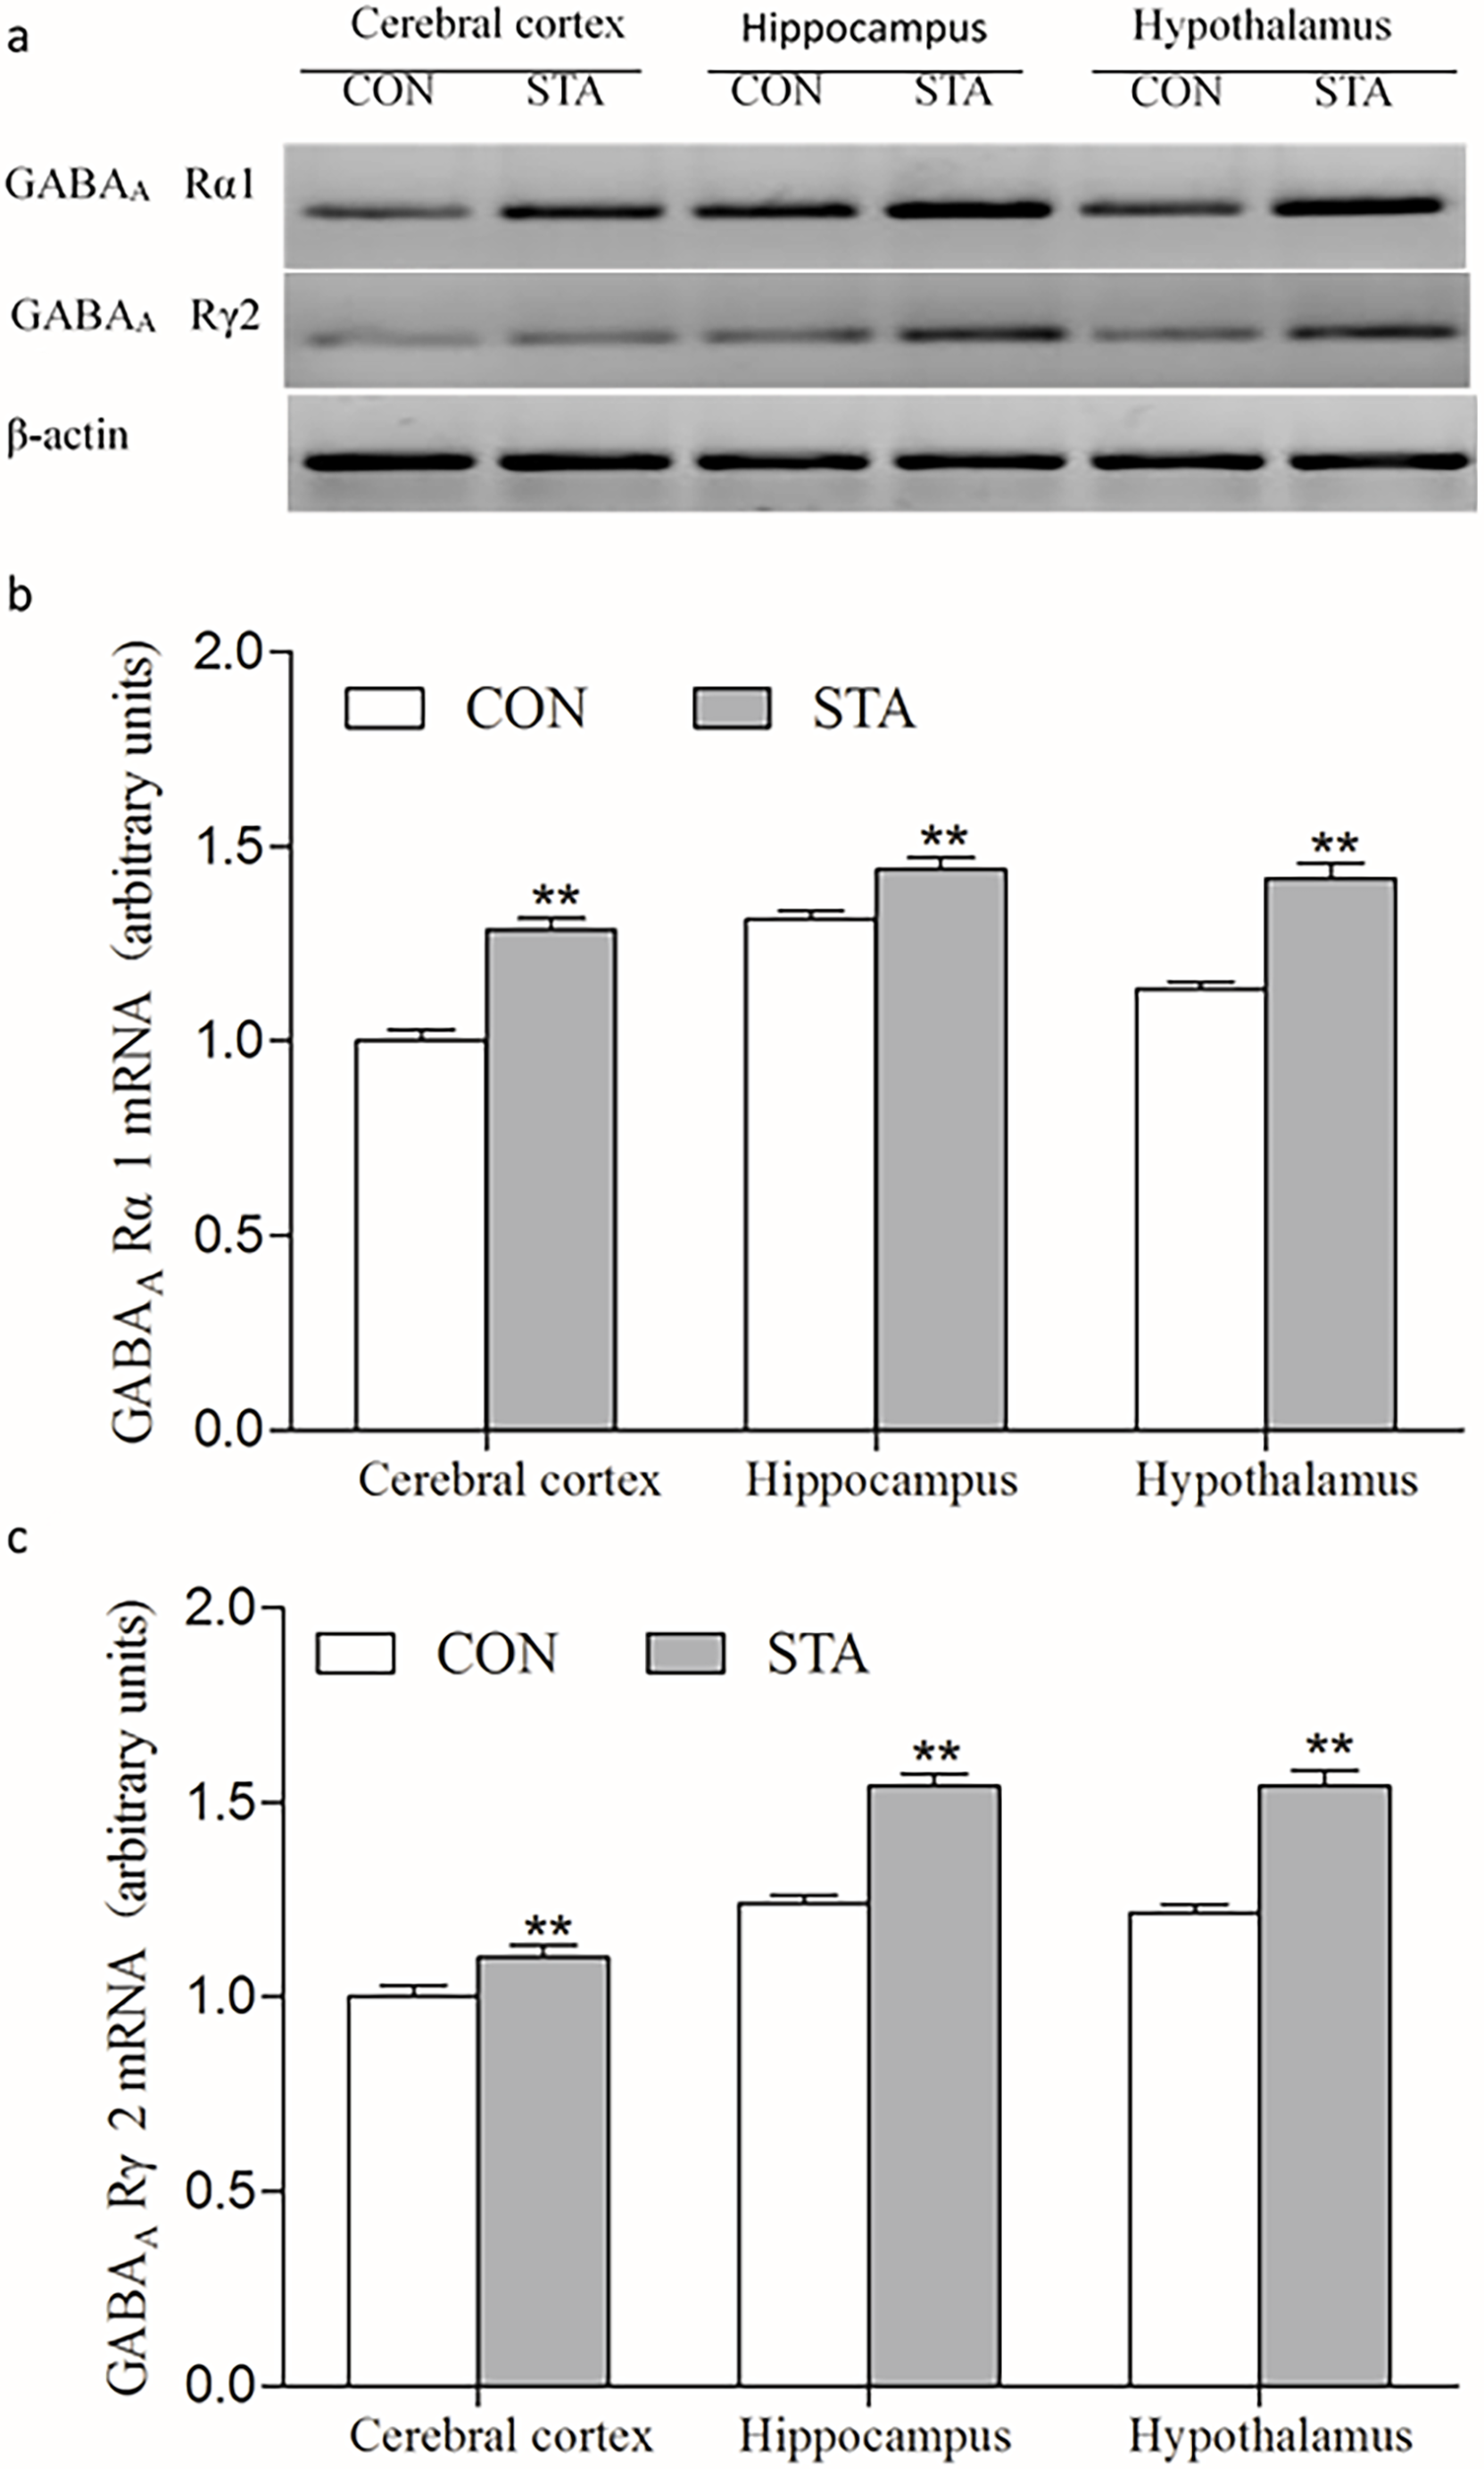
Effects of STA on the expression of GABAA Rα1 and GABAA Rγ2 mRNA in the brain tissues of rats (mean ± SD, n = 3). (a-c) illustrate the electrophoretogram (a) and the arbitrary units (b and c) of the expression of GABAA Rα1 and GABAA Rγ2 mRNA in the cerebral cortex, hippocampus, and hypothalamus of rats. The values of the control for the cerebral cortex are arbitrarily taken as 1 unit and other values are expressed as relative units to the control. **P < 0.01, vs the blank control group. CON: control group; GABA: γ-aminobutyric acid; STA: Schisantherin A.

Effects of STA on the expression of GABAA Rα1 and GABAA Rγ2 proteins in the different brain tissues of rats (mean ± SD, n = 3). (a-c) illustrate the electrophoretogram (a) and the arbitrary units (b and c) of the expression of GABAA rα1 and GABAA Rγ2 proteins in the cerebral cortex, hippocampus, and hypothalamus of rats. The values of the control for the cerebral cortex are arbitrarily taken as 1 unit and other values are expressed as relative units to the control. *P < 0.05, vs the blank control group; **P < 0.01, vs the blank control group. CON: control group; GABA: γ-aminobutyric acid; STA: Schisantherin A.
STA is one of the main active components of Schisandra chinensis lignans and has a good effect in the treatment of Parkinson disease, protecting against ischemia-reperfusion injury, anti-inflammation, and Alzheimer’s disease, 13 -19 but there is no explicit animal behavior experiment to confirm its sedative and hypnotic effects. This study showed that STA has sedative and hypnotic effects, and these effects may be related to its regulating the function of the GABAergic nervous system. As in our previous report, Schisandra contains more sedative and hypnotic components, such as STA and Schisandra B. From our studies, STA was a little more potent in shortening sleep latency. 10 As for the raw contents of these 2 components in Schisandra, we extracted 2.16 mg/g of STA and 3.19 mg/g of Schisandrin B from dried fruits of Schisandra by using supercritical CO2 fluid extraction. We will compare other differences in functions and mechanisms in further studies.
As one of the main inhibitory neurotransmitters, GABA plays an important role in the regulation of sleep and arousal. Studies have shown that the average brain GABA level can be much lower in primary insomnia patients than that in the normal control. 20 Glu, one of the most important excitatory neurotransmitters in the body, can induce the depolarization of neurons, produce an excitatory postsynaptic potential, and then participate in the regulation of arousal. 21 The GABA/Glu ratio plays a decisive role in sleep arousal, that is, while the level of Glu increases, the neurons are excited and the arousal is activated, facilitating the awakening of the body, and while the level of GABA increases, the excitation of the neurons is inhibited and the arousal is inactivated, facilitating sleep. 22 GAD can convert Glu into GABA, thus increasing the GABA level and decreasing the Glu level, indicating that GAD plays a crucial role in the GABA/Glu metabolic pathway. 23 This study found that STA could significantly elevate the GABA level and lower the Glu level in the brain tissues of rats and peripheral blood of mice and rats to increase the GABA/Glu ratio, which can help maintain the sleep state. Furthermore, it was also found in this study that STA could increase the GAD content in different brain tissues of rats. Therefore, it could be speculated that the regulatory mechanism of STA on the GABA level might be through changing the level of GAD in the brain tissues, thus affecting the conversion of Glu to GABA and then affecting the GABA/Glu ratio in both brain tissues and peripheral blood, through which STA could change the sleeparousal rhythm.
The physiological sedative and hypnotic effects of GABA are mainly via its specific binding to GABAAR, causing an increase of the Cl− permeability across the nerve cell membranes and the membrane hyperpolarization, and, as a result, showing an inhibitory effect. 12 GABAA Rα1 and GABAA Rγ2, the subunits of GABAA R, are widely expressed in the brain and their expression levels are closely related to the degree of sedation and hypnosis. 24 -26 The reverse transcriptase polymerase chain reaction (RT-PCR) and Western blot results showed that the GABAA Rα1 and GABAA Rγ2 mRNA, and protein expression levels increased significantly in the cerebral cortex, hippocampus, and hypothalamus in the rats treated with STA, suggesting that STA could upregulate the expression of GABAA Rα1 and GABAA Rγ2, as a good response to the increased GABA.
In conclusion, STA, as schisandrin B, is another main component of Schisandra responsible for sedative and hypnotic effects, which may be related to the GABA pathway from regulating the levels of GABA, Glu, and GAD to the expression of GABAA Rα1 and GABAA Rγ2 in brain tissues.
Experimental
Animals
Clean-grade male ICR mice, weighing 20 ± 2 g, were provided by Changchun Yis Experimental Animal Technology Co., Ltd., (license number: SCXK [Jilin] 2016-0003); male Wistar rats, weighing 200 ± 10 g, were provided by Changchun Yis Experimental Animal Technology Co., Ltd. (license number: SCXK [Jilin] 2016-0005). The animals were raised in separate cages in a quiet environment with proper temperature and humidity, and a free access to water and food, and acclimatized to the laboratory environment for 7 days before experiments. The animal experiments were approved by the Institutional Animal Care and Use Committee (IACUC) of Beihua University.
Animal Administration and Experimental Protocol
Male ICR mice were randomly divided into blank control group, STA groups (1.75, 3.5, and 7 mg/kg), and diazepam group (4 mg/kg) in the sedative and hypnotic experiments, with 30 mice in each group. Mice in the different groups were intragastrically given the same volume of distilled water, the corresponding doses of STA and diazepam, once daily, respectively, continuously for 7 days, and the administration volume was 0.1 mL/10 g. All behavioral experiments and peripheral blood examination of GABA and Glu levels were carried out and measured in sequence 40 minutes after the last administrations.
Male Wistar rats were randomly divided into blank control group and STA group (4.9 mg/kg), 12 rats in each group. Rats in the blank control group were intragastrically given the same volume of distilled water and STA, once daily, respectively, continuously for 7 days, with an administration volume of 1 ml/100 g.
Mouse Autonomic Activity Test
Ten mice in each group were placed in a mouse autonomic activity recorder (Chengdu Taimeng Technology Company, Chengdu, China) 40 minutes after the last administration. After the mice acclimated to the environment for 5 minutes, the number of autonomic activities in each group was automatically measured and recorded for 5 minutes.
Sleep Test in Mice Treated with Subthreshold Dose of Pentobarbital Sodium
Ten mice in each group were intraperitoneally given a subthreshold dose of pentobarbital sodium (37.5 mg/kg, 0.1 mL/10 g) 40 minutes after the last administration. Then, the number of mice with a loss of righting reflex for 1 minutes or more was recorded.
Sleep Test in Mice Treated with Threshold Dose of Pentobarbital Sodium
Ten mice in each group were intraperitoneally given a threshold dose of pentobarbital sodium (49.5 mg/kg, 0.1 mL/10 g) 40 minutes after the last administration. Then, the sleeping number, the sleeping time, and the awakening time within 30 minutes were recorded.
Measurement of GABA and Glu Levels in the Peripheral Blood of Mice
After following the above autonomic activity test, the mice were anesthetized by inhalation with 5% ether and blood samples were collected by removing the eyeballs. Mice were monitored for the loss of righting reflex and were maintained at a respiratory rate of 100 to 200 breaths/min to ensure that anesthesia was effective. The mice were sacrificed by CO2 asphyxiation, the concentration of input CO2 was 100% and the flow rate was set at 20% of the chamber volume/min, the apnea of mice was an indicator to determine if mice had succumbed. The blood samples were centrifuged at 4°C and 1006.2 × g for 10 minutes with a high-speed centrifuge (LD5-10B, Beijing, China) to obtain the serum. The levels of GABA and Glu in the serum were detected according to the instructions of the kits.
Measurement of GABA, Glu, and GAD Levels in the Brain Tissues and Peripheral Blood of Rats
Male Wistar rats were randomly divided into blank control group and 4.9 mg/kg STA group, 6 rats in each group. Forty minutes after the last administration on the seventh day, the rats were anesthetized by inhalation of 5% ether and blood samples were collected by collecting from the abdominal aorta. Rats were monitored for the loss of righting reflex and were maintained at a respiratory rate of 100 to 200 breaths/min to ensure that anesthesia was effective. The rats were sacrificed by CO2 asphyxiation, the concentration of input CO2 was 100%, and the flow rate was set at 20% of the chamber volume/min; the apnea of rats was an indicator to determine if rats had succumbed. The samples were centrifuged at 4°C and 1006.2 × g for 10 minutes with a high-speed centrifuge (LD5-10B, Beijing, China) to obtain the serum. Then, the rats were sacrificed by decapitation to take their cerebral cortex, hippocampus, and hypothalamus on an ice pad, and saline was used to wash out the residual blood on the surface of the brain tissues; filter paper was used to clean the excess water on the surface. Ten percent tissue homogenates at a 1:9 ratio of the brain tissue weight to normal saline were prepared and centrifuged at 4°C and 1006.2 × g for 10 minutes to obtain the supernatants, respectively. Finally, the levels of GABA, Glu, and GAD in the serum and tissue supernatants were measured according to the instructions given with the kits.
RT-PCR
Male Wistar rats were randomly divided into a blank control group and a 4.9 mg/kg STA group, 3 rats in each group. The cerebral cortex, hippocampus, and hypothalamus of rats from each group were taken 40 minutes after the last administration. The total RNA in the brain tissues was extracted according to the instructions of the high-purity total RNA rapid extraction kit (centrifugal-column type). By following the instructions of the one-step RT-PCR reverse transcription kit, the cDNA was synthesized and amplified by PCR amplification. The sequence numbers of all genes were found in Genebank. The primers were designed with Primer 6.0 software and synthesized by Beijing Dingguo Changsheng Bioengineering Company and β-actin was used as the internal reference gene. All the primers are shown in Table 1.
Primer Sequence.
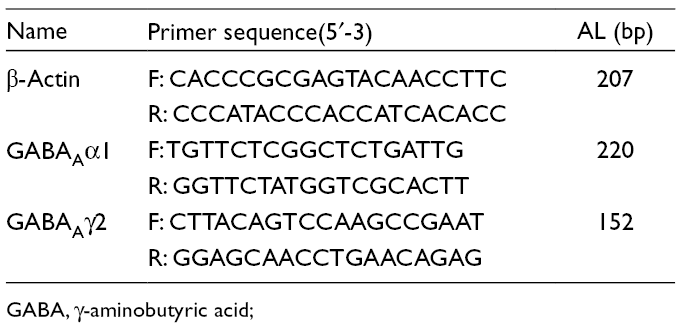
GABA, γ-aminobutyric acid;
The amplification conditions were as follows: predenaturation at 94°C for 3 minutes, denaturation at 94°C for 30 seconds, and annealing for 30 seconds (annealing temperature: 57°C for α1 and γ2 subunits, 63.5°C for β-actin); extension at 72°C for 30 seconds, with 30 cycles, and then extension at 72°C for 7 minutes; finally, save at 4°C. Gel electrophoresis on 10 µL PCR products was conducted in which the results were observed and photographed by the gel imaging system (Tanon 1600 gel Image system. Shanghai Tianneng Technology Co., Ltd., Shanghai, China); the density of the photographs was scanned by the gel imaging system, and the optical density values of GABAA Rα1 and GABAA Rγ2 were used to express the relative amount of GABAA Rα1 and GABAA Rγ2 mRNA.
Western Blot
Male Wistar rats were randomly divided into a blank control group and a 4.9 mg/kg STA group, 3 rats in each group. The cerebral cortex, hippocampus, and hypothalamus of rats were taken 40 minutes after the last administration. Lysis buffer was added to the brain tissue samples for the ice cracking for 1 hour, and then the sample-lysis buffer solution was centrifuged to obtain the supernatant. Protein concentrations in the brain tissues were determined by the bicinchoninic acid method. The target proteins were separated by sodium dodecyl sulfate polyacrylamide gel electrophoresis and transferred to polyvinylidene fluoride membranes for 2 hours. The membranes were rinsed with Tris buffer for 5 minutes, then blocked with the blocking buffer (TBST buffer containing 5% skim milk powder) for 1 hour. After incubation at room temperature, the blocking buffer was discarded, then the first GABAA Rα1 and GABAA Rγ2 antibodies were added on the membranes, respectively, and the membranes were incubated at 4°C overnight. The membranes were washed with TBST 5 times, each for 5 minutes, then the second antibodies (1:2 000) were added to the membranes, and incubated for 2 hours. The membranes were washed with TBS-T 5 times, 5 minutes each time, and finally, added to the chromogenic solution enhanced chemiluminecence for the color development.
Statistical Analysis
The data were analyzed with SPSS 19.0 software. The experimental data, including the number of autonomic activities, standing times, sleep latency and sleep time, GABA, Glu, and GAD levels, GABA/Glu ratios, and RT-PCR and Western blot results are presented as mean ± SD. One-way analysis of variance using the GraphPad Prism program (GraphPad Software, Inc., San Diego, CA, USA) was used for the significant test for differences between 2 or more sample averages, and the comparison between 2 groups was performed with Student’ s t-test, in which P <0.05 was considered a significant difference.
Footnotes
Declaration of Conflicting Interests
The author(s) declared no potential conflicts of interest with respect to the research, authorship, and/or publication of this article.
Funding
The author(s) disclosed receipt of the following financial support for the research, authorship, and/or publication of this article: This study is partially supported by Grants from Jilin City Bureau of Science and Technology (20166018, 20163024, 20163054, 20162004).