
Abstract
Zosteric acid (ZA), a bioactive component in Zostera marina eelgrass, was applied to assess closure of normal mouse fibroblast scratch and collagen I expression. The cytotoxicity of ZA on the fibroblast at different ZA concentrations was evaluated. ZA showed low toxicity with ~80% of cell viability at a concentration of ~1600 ppm. A single scratch (~1500 μm) was made on a layer of fibroblast, and collagen expression was determined after 72 hours when the scratch fully closed for both ZA-treated and untreated samples. Compared to control, the ZA-treated cells were slightly less dense and randomly oriented in the closure region and had lower actin and vinculin expressions. The total collagen expressions were comparable to the control, whereas collagen I expression of the mouse fibroblast treated with 1600 ppm of ZA was significantly lower than untreated fibroblasts.
Eelgrass, Zostera marina, is a submersed macrophyte found in north America. 1,2 Its leaf and root are a source of secondary metabolites such as rosmarinic acid, caffeic acid, 3 and zosteric acid (ZA). 4 The quantities of these metabolic components depend on the age of Z. marina and variation of environmental temperatures. 2,3 Zosteric acid (Figure 1) acts as an antiadhesive biochemical. It is released and bound on the leaf surface of the eelgrass, which deters the attachment of marine microorganisms and bryozoans. 1 With this defensive property, ZA has been studied as an effective anti-biofilm agent against algae, 5 fungal spore, 6 aquatic bacteria, 7,8 yeast, 9 and quagga mussels. 10 In the case of Escherichia coli, ZA increased flagellin production resulting in stimulation of cell motility instead of firm attachment. This causes the reduction of biofilm formation. 11 Because of the sulfoxy functional group in ZA, similar to that in sulfated polysaccharides (eg, heparan sulfate) which exhibit an anti-infection property against dengue virus (DENV), ZA also has DENV-inhibitory activity toward cell culture systems. 12 The antioxidant and anti-inflammatory properties of ZA have also been demonstrated because of their ability in scavenging peroxy nitrite in vitro. 13

Chemical structure of zosteric acid.
The antiadhesions, antioxidant, and anti-inflammatory properties of ZA make it an attractive candidate to be considered in preventing surgical adhesions and/or scar tissue formation. Adhesions are the undesired result of wound repair when denser and less functional fibrous tissues form. 14 Adhesions could grow larger and tighter with time, leading to pain/suffering and infertility years after surgery. The common approaches for reducing surgical adhesions are barrier-based and they have not been proven to be effective. 15,16 Incorporating antiadhesion drugs into barriers to achieve a synergistic effect is more desirable, but no effective drugs have been found. 17 Thus, the potential of ZA as an antiadhesion drug warrants assessment.
Many proteins, including collagen, are involved in adhesions. Collagen is the major protein component of connective tissue. Normally, collagen is produced when the body responds to diseases and injuries to repair the defect, and to restore the function and anatomic structure. Among many types of collagen, collagen I, which is soluble when initially secreted from cells and then polymerizes into insoluble fibrils in fibrotic tissue, 18 is an indicator in scar tissue (ie, adhesions) formation. In general, a mature scar formed toward the end of wound healing has more collagen I than the granulation tissue at the early stage of wound healing. 19
The present study aims to investigate the antiadhesion properties of ZA against fibroblast cells. The cytotoxicity of ZA was first assessed toward mouse embryonic fibroblast (NIH/3T3). Wound healing, actin and vinculin expressions, and collagen synthesis focusing on collagen I were evaluated based on in vitro scratch assay.
Cytotoxicity evaluation shows that ZA exhibited low toxicity toward NIH/3T3 cells, that is, ~80% viability at a concentration of ~1600 to 3200 ppm (Figure 2). Compared to cells without pre-incubation, the 2-days pre-incubated cells showed a slightly more susceptibility to ZA, but overall the cytotoxicity trends were similar. The scratch assays were carried out with cells exposed to 1600 ppm of ZA.
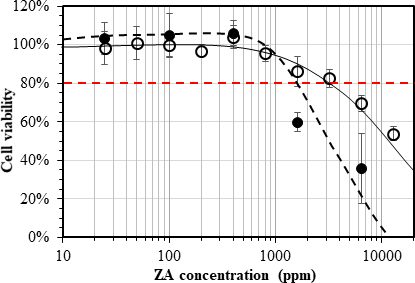
Drug-response curves of NIH/3T3 cells after 72 hours of exposure to zosteric acid. Open and filled symbols in the curves represent cells without and with pre-incubation for 2 days, respectively.
In Figure 3, cells treated with ZA had a characteristic fibroblastic morphology similar to those of control. Cells migrate from the boundary of the scratch into the scratched region to close the scratch. The control cells migrated mostly in a single direction (Figure 3a), whereas the treated cells migrated in random directions (Figure 3b). Cell spreading and migration can normally be visualized by actin and vinculin expressions. With ZA treatment, the relative actin filaments (F-actin) expression of cells decreased by 15% to 30% from the nontreated cells (Figure 3c), and the difference was noticeable for ZA-treated cases with 24 hours of drug exposure, but not with 72 hours of drug exposure. In the case of vinculin expression, slightly lower, but still significant difference was observed for ZA-treated cells from those of controls for both 24 and 72 hours of ZA exposure.
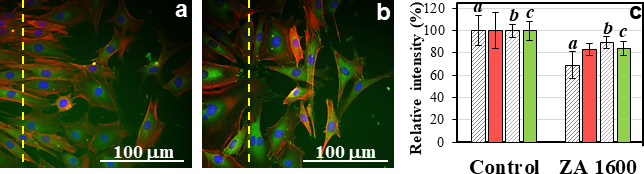
Morphologies of NIH/3T3 cells with F-actin (red)/vinculin (green)/nuclei (blue) stains of control (a) in response to 1600 ppm of ZA (b) after 24 hours. The dashed lines indicate the boundary of the scratch, and the scratch region is on the right of the dashed line. In the presence of ZA, cells migrated randomly into the scratched region during closure. Relative intensities of F-actin (red) and vinculin (green) expressions of NIH/3T3 (c) in the presence of ZA for 24 hours (striped bars) and 72 hours (solid bars) are shown. Letters a, b, and c above the bars indicate a paired comparison versus control with a P < 0.05 (0.0002, 0.029, and 0.049, respectively, based on the t-test; and 0.008, 0.031 and 0.031, respectively, based on the binomial sign test).
A reduced F-actin expression corresponds to a lesser degree of actin polymerization and a decreased adhesion between cell and substrate. 20 The reduced vinculin, an important protein in focal adhesion, suggests that the cells have a lower ability to adhere and spread and a higher motility. 21,22 Thus, with ZA treatment, mouse fibroblast cells would have lower adhesion and migrate more easily and randomly into the scratched region during scratch closure. The scratch closure, defined as the scratched area occupied by migrated cells, was, however, indifferent for ZA-treated and nontreated cells. It reached ~60% after 24 hours, and a complete closure resulted in 72 hours (Figure 4). The cell density inside the scratched region was, however, found to be 10%-15% lower for ZA-treated cells. Because ~80% or greater of cells were viable and could migrate, scratch closure was expected.

Microscopic images of a scratch on a NIH/3T3 cell layer in the absence and presence of ZA. The scratches were marked and the images were captured close to the same spot. A scale bar represents 500 µm.
In Figure 5, the collagen synthesized by fibroblast cells 72 hours after scratch was quantified. The amounts of collagen synthesized by NIH/3T3 totaled to an average of 30-36 μg, or no difference. Cells treated with ZA had a collagen I of ~0.05 µg, which was significantly lower than the control (~2 µg). Without ZA treatment, the cells had grown into a denser layer, allowing more collagen I to be synthesized. 19 While maintaining the normal cell morphology, the reduced collagen I expression indicated the collagen I regulation potential of ZA. Further studies on the mechanisms of drug action and cell-specific characteristics to ZA are necessitated.

Sirius Red-stained cell layer of control cells (a) and zosteric acid (ZA)-treated cells (b) within the scratch closed region after 72 hours of incubation. Slightly less cells (10%-15%) were noticed for ZA-treated samples. Histogram (c) shows total collagen (red bars) and collagen I (striped bars) after closing a scratch on a cell layer (with ~72 hours of incubation). Letter a above the bars indicates a paired comparison versus control with a P of 0.0000002 (t-test) or 0.031 (binomial sign test) (P < 0.05).
Experimental
Materials
Zosteric acid or p-(sulfoxy) cinnamic acid, not yet commercially available, can be extracted from eelgrass Z. marina using methanol, but the process is tedious and the yield is very low, that is, 66 mg/1700 g of dry biomass. 23 For this study, ZA was synthesized in our laboratory using p-coumaric acid (98%) and chlorosulfonic acid (99%), both from Sigma-Aldrich, according to previously reported procedures. 4 The final product we synthesized, characterized by mass spectroscopy and 1H nuclear magnetic resonance, had a purity of ~97% ZA. Culture medium for mouse embryonic fibroblast cell line (NIH/3T3; ATCC®CRL-1658TM) contained Dulbecco’s Modified Eagle Medium, 10% of fetal bovine serum (USA origin, heat inactivated), and 1% of antibiotic antimycotic solution (100×), all purchased from Sigma-Aldrich.
Cytotoxicity Testing
The cytotoxicity of ZA was screened using NIH/3T3 cells (passage 8-12). After detachment of the confluent cells (80%-90%), 90 µL of individual cells containing 5 000 cells was seeded into each well of a 96-well polystyrene plate (USA Scientific, Inc., FL, USA). The serial dilutions of ZA solutions, previously prepared, were gently added (90 µL) to obtain the final concentrations of 25 to 12 800 ppm of ZA in the wells. For cytotoxicity of cells without pre-incubation, ZA solutions were added right after seeding the cells. For cytotoxicity of cells with pre-incubation, the cells seeded in a 96-well plate were allowed to incubate for 2 days prior to adding the drug. After incubation with the drug for 72 hours, the cell survival was determined using PrestoBlue™ Viability Reagent (Invitrogen, MD, USA).
Scratch Assay
Cells were seeded into 6-well tissue culture plate at a density of ~32 000 cells/cm2 and incubated for 2 days. The cell monolayer was gently scratched, to a size of 1.5 mm × 30 mm by a cell scraper (Costar® 3008; Corning, Inc., NY, USA), washed with its medium to remove the detached cells, and then the medium was completely aspirated. To each well, 3 mL of fresh medium without or with ZA of 1600 ppm was added. The cells were then allowed to expose to ZA for 72 hours. Cell mobility was observed every 24 hours through an Olympus IX70 microscope using a 4× phase objective and an eyepiece digital camera (model HDCB-90D). Scratch closure was recorded using the YAWCAM software (version 0.5.0, Magnus Lundvall) and measured using Image J (version 1.43 t, National Institutes of Health). The cell layer with a scratch in the absence of ZA was used as control. The scratch closure was estimated by the area where cells had migrated and spread from the initial scratched edges divided by the original area of the scratch. The areal cell density inside the scratched region was not taken into account in estimating the closure. The scratched cells after 72 hours of treatment were fixed with 4% paraformaldehyde (PFA) and then stained using Sirius Red (Chondrex, Inc., WA, USA). The cell morphology within the scratched region was imaged.
Immunocytochemical Analysis
For the observation of actin cytoskeleton and focal adhesion contacts, the cells, treated with the drug for 24 hours and 72 hours, were fixed by 4% PFA (from Sigma-Aldrich) and stained with FAK100 staining kit and immunoglobulin G antibody AP124F (Sigma-Aldrich). The stained cells were rinsed 3 times with ~3 mL of washing solution and visualized by a fluorescence microscope (Olympus IX70) at the magnification of 20×. The images of cells at the edge of the scratch and within the scratch were captured using a digital camera (Olympus E-420) through the eyepiece of the microscope. These images, without any color enhancement or further processing, were used to obtain the fluorescent intensities of stained actin filaments (F-actin) and vinculin. To better show the cell morphology, some higher resolution images with enhanced fluorescent intensity were also captured using a Hamamatsu digital camera (C10600 ORCA-R2) and an image acquisition software (MetaMorph Advanced from Molecular Devices).
Determination of Collagen and Collagen I Synthesized During Scratch Closure
Total collagen, deposited on the cell layer and released into the cell media, was determined using the Sirius Red detection kit (Chondrex) according to the manufacturer protocols. Briefly, the sample was treated with Sirius Red solution, washed, and Sirius Red bound to collagen was extracted and the absorbance was measured using a spectrophotometer at 530 nm. For collagen in the medium, the culture media, at the end of 72 hours of scratch assay, were collected and diluted by 1× phosphate-buffered saline. To collect collagens deposited on cells, 0.05 M acetic acid (0.5 mL) was added to each well, and the cells were scraped off the well; after collecting all the suspension, the well was rinsed with another 0.5 mL acetic acid and the solution was added to the collection. The collected collagen suspension was digested using 1 mg/mL of Pepsin (Chondrex) and then centrifuged at 10 000 rpm for 5 minutes to collect collagen in the supernatant.
For collagen I, the mouse type I collagen detection kit 6012 (Chondrex) was used. The collection and preparation of medium and cell layers were the same as those for total collagen detection. Other details outlined in the manufacturer’s protocols were followed.
Statistical Analysis
The obtained data was reported as an average with the standard deviation as the error bar. The pair comparison of the data (ZA 1600 ppm treated vs control) was carried out with 2-tailed hypothesis by t-test for 2 dependent samples and also checked with the binomial sign test for 2 dependent samples. The pair was considered difference with a P-value of <0.05.
Footnotes
Declaration of Conflicting Interests
The author(s) declared no potential conflicts of interest with respect to the research, authorship, and/or publication of this article.
Funding
The author(s) disclosed receipt of the following financial support for the research, authorship, and/or publication of this article: This research is supported by the National Institute of General Medical Sciences of the National Institutes of Health (NIH) under award number 1R15GM097626-01A1.