
Abstract
Structural information pertaining to the interactions between biological macromolecules and ligands is of potential significance for understanding of molecular mechanisms in key biological processes. Recently, nuclear magnetic resonance (NMR) spectroscopic techniques has come of age and has widened its scope to characterize binding interactions of small molecules with biological macromolecules especially, proteins. NMR spectroscopy-based techniques are versatile due to their ability to examine weak binding interactions and for rapid screening the binding affinities of ligands with proteins at atomic resolution. In this review, we provide a broad overview of some of the important NMR approaches to investigate interactions of small organic molecules with proteins.
Specific molecular interactions of biological macromolecules with ligands of different sizes are central to the understanding of the regulation of key cellular processes. 1 Proteins are the most important class of biological macromolecules as they govern the crucial structural and functional properties of cellular systems. A good understanding of the molecular mechanisms underlying important cellular processes will obviously involve examination of structural interactions forged by proteins with themselves or with other biological macromolecules such as, nucleic acids, polysaccharides, and lipids. Owing to the central role of proteins as drivers of cellular functions, specific interactions of small molecular organic ligands with proteins are critical for a rational drug design. Several biophysical and biochemical techniques, such as isothermal titration calorimetry, surface plasmon resonance, fluorescence resonance energy transfer, infrared spectroscopy, circular dichroism, confocal microscopy, enzyme-linked immunosorbent assay, have been successfully used to characterize the binding constant (K D), kinetics, dynamics, and thermodynamics characterizing protein-ligand interactions. In addition, computational studies have also proved to be useful in the virtual high throughput screening of potential small molecule drug candidates against protein targets. 2 However, NMR spectroscopy has proven to be the most valuable tool to obtain an atomic-level view of the ligand-protein interactions. 3-5 NMR spectroscopy evolved as a powerful tool over the past few decades to investigate protein-ligand binding affinities in the nanomolar to millimolar regime. 6-9 An additional advantage of NMR has been its ability to not only provide information on binding affinity between ligands and their target protein(s) but also its strength to shed valuable insights into the protein conformational changes that plausibly occur upon binding to their ligand(s). Therefore, the aim of this review is to provide a comprehensive list of commonly used NMR-based techniques that can be used to investigate different aspects of protein interactions with small molecule organic ligands.
1D-1H Line Broadening
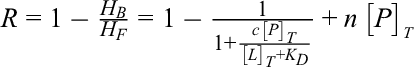
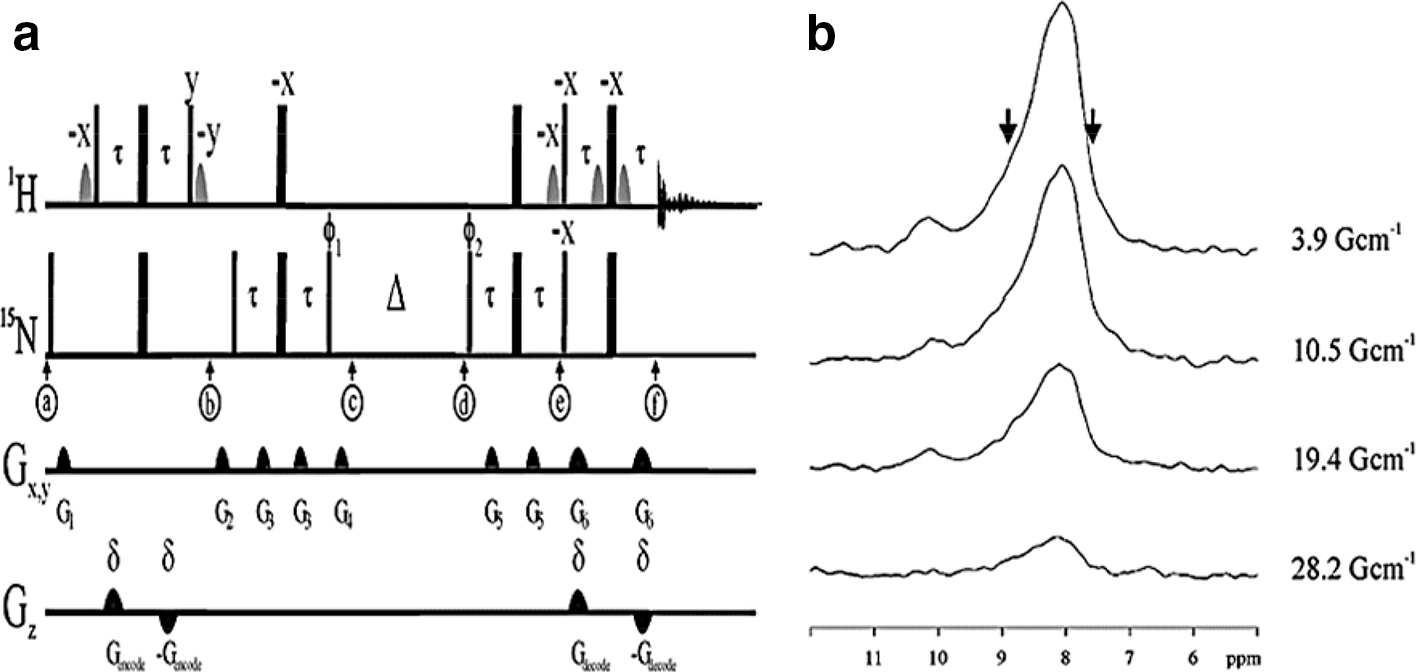
Ligand-observed 1D NMR methods are well established to detect hits from chemical libraries because they prefer ligands with K D values in the micromolar to millimolar range and require lower data-acquisition times and reduced sample requirements. 10 The dissociation equilibrium constant for protein-ligand complex can be measured by a change in linewidth or chemical shift of the peaks corresponding to the free ligand upon binding to a protein. Binding interactions between a protein (MW >5000 Da) and a low molecular weight ligand (MW <500 Da) can be measured by monitoring the decrease in the NMR peak height of ligand upon addition of ligands to a protein solution. Ligand that shows an observable decrease in peak height is considered to be a binder. Therefore, the K D values of a 1:1 protein (P)- ligand (L) binding complex, can be represented by the equation,

wherein [L]F is the concentration of the free ligand, [P]F is the concentration of the free protein at equilibrium, and [PL] is the concentration of the protein-ligand complex. Shortridge et al., assuming that [L]T > [P]T (wherein [P]T is total protein concentration and [L]T is the total ligand concentration) transformed equation-1 using the Taylor series expansion 10 to calculate the NMR peak height ratio ‘R’ as,

wherein
HF and HB are the sum of NMR peak heights of ligand in the free state and the bound state, respectively. wF and wB are the NMR-linewidth(s) of the ligand in their free and bound states, respectively. NMR line width ratio constant (c) represents the change in the ligand linewidth upon binding of a ligand to a protein. In the bound state, the resonance of the free ligand linewidth (wF) gains the linewidth of the protein (wB), and as a result, the increased linewidth causes a corresponding decrease in the ligand peak height which is measured by the ratio of the NMR peak height (R). One can obtain K D value from this equation (equation (2)) on the basis of the relative changes in the ligand peak height. Shortridge et al. rearranged equation-2 for measuring K D (see equation (3)) values. The rearranged equation can also be written in terms of fractional occupancy at a given protein concentration (Rgiven) as,

For proteins which possess multiple non-specific binding sites, the nonspecific binding term n[P]T corresponds to a linear increase in fraction bound upon addition of protein, accounts for the correction of the decrease in ligand signal at high protein concentration. After the addition of the n[P]T term, equation (2) can be represented as
However, the 1D -1H NMR spectra of small molecules have extremely sharp peaks. However, upon binding to protein(s), widening of the peak and subsequently decrease in the ligand’s NMR signal height are observed due to shorter relaxation time of the ligand-protein complex. Human serum albumin (HSA), which possesses multiple binding sites, experiences 1D-1H line broadening effect upon binding to small molecule drugs phenytoin and naproxen (Figure 1). 11

1D - 1H nuclear magnetic resonance (NMR) spectra phenytoin (a) and naproxen (b) titrated with increasing concentrations [(i) 0 µM, (ii) 0.4 µM, (iii) 1 µM, (iv) 2 µM, and (v) 4 µM] of HSA. The height of the NMR signal of the ligands decrease because of the shorter relaxation times of the ligand-human serum albumin complex. 11 This figure has been reproduced from ref.11 with permission from the publisher.
The observed increase in the linewidth of the ligand depends on the dissociation equilibrium constant for the protein-ligand interaction, K D. In general, the observed change in the ligand’s linewidth (wobs) for the fast exchange limit will follow the equation shown below

wherein fB is the fraction of the bound protein-ligand complex, wF is the free ligand NMR line-width, and wB is the line-width of the bound state of the ligand.
There are some assumptions considered here. If it is assumed that the linewidth of the protein-ligand complex is higher than that for the free ligand, then the ratio of the ligand linewidth in the free state and in the bound state represent the remaining free ligand concentration which is expressed by equation (2). This assumption is valid for ligand screening against a single protein target wherein the contribution of chemical and dynamic line-broadening of the ligand(s) may remain almost constant. As a matter of fact, the lower contribution of linewidth from the exchange processes is not expected to change the ligand binding affinities. This assumption is applicable for protein-ligand interaction for single binding-site of a protein. The assumption is not applicable for multisite binding or other factors such as allosteric interactions which would warrant a more complex binding model. 12,13 Upon binding to a protein target, the 1H NMR resonances of the ligand would broaden significantly or even disappear but background interference should be expected to increase with concentration and the size of protein accounting for the enhancement in false-negative rates. Worley et al. reported a statistical method uncomplicated statistical spectral remodeling (USSR) method to analyze 1D-1H NMR line-broadening spectra for removing interfering protein baseline signals. 14 It was reported that a chemical library of 456 compounds identified 43 binders using BSA but the background signals of BSA completely concealing the ligand spectra. 14 Identification of the protein baseline from screening data requires highly reproducible sample preparation, data collection and processing. The later of these requirements can be achieved by the use of phase-scatter correction (PSC) method. 15 When protein signals are the major problem, PSC methods yield the good results compared to the USSR method. Therefore, Worly et al. reported that the combined use of PSC and USSR method would provide the convenient analysis for 1H line-broadening screening data in order to estimate the K D values. 14
Relaxation Time to Identify Ligand Binding
The binding of ligand to the protein can be assessed by line-broadening effect as described earlier. Line-broadening effect also has limitation(s) for the detection of binding activity of one or more components in a complex mixture. Therefore, in the investigation of complex mixtures, the observation and quantification of such effects needs well-separated signals. 16 Another experimental approach was proposed that involves subtraction of the spectra responsible for contributions stemming from binding ligands. However, this approach requires the inclusion of critical steps that are often time-consuming. 17 As binding induces relatively minor chemical shift perturbations (CSPs), as compared to the line-width changes, the effects of relaxation rate are more effective and therefore preferred. A spin-labeled ligand is first selected that has a propensity to bind to the primary binding site of a protein. This ligand is used for screening for binding of other ligands to second binding site of protein(s). 18 As a consequence, T2 relaxation is enhanced on other ligand by the presence of the spin labeled first ligand and this effect depends on the distance between the spin label and the second binding site on the protein. As a matter of fact, due to fast T2 relaxation, resonance signals of ligands that bind to a second protein binding site is not detected in the T2-filtered NMR spectrum. The binding of ligands with FKBP was investigated by Jahnke et al. wherein spin labels (such as, 2,2,6,6-tetramethylpiperidine-1-oxyl; TEMPO) were attached to the lysine side chains of FKBP, a FK506 binding protein, to detect the binding ligands and these lysine residues were situated in the proximity of FK506 binding site [Figure 2]. Therefore, any ligand that binds to this site would experience increased T2 relaxation. This method was applied to a complex mixture of two p-hydroxybenzanilide and 4 nonbinding aromatic compounds. Interestingly, the binding affinity of p-hydroxybenzanilide to FKBP was detected by using spin-labeled FKBP because p-hydroxybenzanilide experienced significant quenching in the presence of spin-labeled FKBP. However, the method is limited when covalent modification of the protein is required because it affects the binding affinity. 19

Relaxation experiments of a complex mixture of 2 p-hydroxybenzanilide and 4 nonbinding aromatic compounds without FKBP (left), unlabeled FKBP (middle), and spin-labeled FKBP (right) with spin lock periods of 10 ms and 200 ms. Arrows indicate the cancelation of signals generating from compounds with binding activity for FKBP. 18 This figure has been reproduced from ref.18 with permission from the publisher.
Chemical Shift Perturbations
Several parameters of protein and ligand change upon interaction of a protein with its ligand. (CSP) can occur due to the spatial proximity of aromatic rings or due to the non-covalent interactions with ligands and solvent molecules. In this type of experiment, the chemical shift of the protein can be assessed when ligand is titrated against protein into the solution. 20,21 Saturation of the protein binding site is observed when the ligand is titrated into the protein in excess. The standard technique of 15N-heteronuclear single quantum correlation (HSQC) titration requires 15N labeled protein produced in Escherichia coli with unlabeled ligand. The changes in chemical shift during titration can be monitored by acquiring 2D 15N-HSQC spectra within 30 minutes by using protein concentrations in the range 200 µM. 22 When interactions occur, specific 1H-15N cross peaks in the 15N-HSQC spectra are displaced from their original position. CSPs allows calculation of equilibrium dissociation constant (K D) and also the ligand binding sites. 23 It is essential to maintain some of the physical parameters to remain constant during the course of the experiment because small changes in sample pH, salt concentration, temperature and buffer composition will significantly affect the 1H-15N CSP.
When the ligand is added, some of the residues undergo selective 1H-15N CSP. 24 Generally, backbone amide protons of residues in the protein located in close proximity to the ligand binding site exhibit significant 1H-15N CSP. Figure 3 represents the titration of new acidic fibroblast growth factor (n FGF-1) with sucrose octasulfate (SOS), and 2D 15N-HSQC spectra were acquired at a nFGF-1 concentration of 1 mM. Sometimes prominent 1H-15N CSP is also observed due to backbone conformational changes induced in the protein by the binding ligand. 25 In addition, 1H-15N CSP also furnishes information of allosteric changes in the protein due to complexation to a ligand. For the calculation of CSP two approaches are used. One of them is the quantum chemical approach using Gaussian 98. 26 In this method, CSP can be calculated from the shielding of nuclei from the external magnetic field by their electrons. The problem with this method is the accuracy and also it does not provide significant information on the structural features that generated the calculated shift. The second method is an empirical one wherein the chemical shifts are the summation of independent effects but any problem(s) in experimental data leads to errors in calculation such as, differences between calculated and the experimentally observed values. 27 This is primarily because the calculated values are based on crystal structures which are in variance with the ensemble of solution structures which are calculated from the solution weighted average of the chemical shift changes. In general, protein (P) binds to ligand (L) and forms a protein-ligand complex, P + L↔PL, wherein the rate constant for forward and backward reactions are represented as k on and k off. At equilibrium, K D is equal to k off/ k on. 28 In a HSQC spectrum representing weak interactions/fast exchange, the k off value is higher than the chemical shift difference between the free and bound protein. As a consequence, the protein-ligand complex is only stable for a short period of time. This aspect poses a challenge to acquire reliable NMR data. Therefore, the observed chemical shift is subjected to the weighted average of the chemical shifts of protein in free state and in the bound state. When k off is lower than the chemical shift difference or for slow exchange (very strong interactions), signals either for free protein or protein-ligand binary complex are observed (Figure 4).

Overlap of 1H–15N HSQC spectra of newt FGF-1(red) in the presence of sucrose octasulfate (SOS) (cyan). The labeled residues are those in newt FGF-1 that undergo significant chemical shift perturbations when the protein binds to SOS in a 1:1 ratio. 25 This figure has been reproduced from ref.25 with permission from the publisher.

The effect of exchange rate on peak shape in a 2D 1H-15N HSQC spectrum. Figure 4: depicts peaks shifts representing a fast exchange: the peak shifts from free (blue) to bound (red) and for slow exchange: the intensity decreases of a peak in the free (blue) state but increases (red) when the protein is bound to the ligand.
However, CSP of any protein signal measured at different ligand concentrations can be used in a nonlinear least-square fitting to predict the K D value using the following equation reported by Becker et al. 29 The equation can be expressed as
wherein
Paramagnetic Ligand Tagging
Ligand-transferred paramagnetic NMR is a commonly used sensitive technique for the identification of protein binding site of low affinity drugs. Chemical shift of a protein is dependent on metal binding site. Paramagnetic effects are observed as a difference between NMR data that is acquired in the presence of paramagnetic metal ion and a diamagnetic metal ion. The data acquired in the presence of the diamagnetic metal ion serves as reference. However, paramagnetic shifts are observed through bond interactions as well as through space interactions. The pseudocontact shifts are subjected to through-space interactions when a paramagnetic metal ion bound to a protein.
30
This method is useful for the detection of the paramagnetic properties of a metal ion bound to the target protein adjacent to the ligand binding site. Metal ions such as most of the lanthanide ions are paramagnetic (except La3+ and Lu3+) and possess suitable ionic radii to coordinate with the metal binding site of the target protein. To determine the relative orientation of paramagnetic lanthanide ion in the area of binding site, pseudocontact shifts can be expressed in terms of polar coordinates r, θ

wherein ΔX ax and ΔX rh are the axial and rhombic components of the magnetic susceptibility tensor (ΔX) of the lanthanide ion. The angles θ and φ denote its orientation with respect to the protein coordination frame and r is the distance between the lanthanoid and nuclear spin of protein. John et al. reported the complex between a lanthanide (Ln3+)-labeled protein, the N-terminal domain of the subunit ε bound to the subunit Θ of E. coli DNA polymerase III (ε186/ Θ), and a small ligand molecule, thymidine. 31 Stoichiometric complexes ε186/ Θ /Ln3+ are easily obtained by the addition of equimolar amounts of LnCl3 [where Ln3+ are Dy3+, Tb3+ , and Er3+, (except La3+ and Lu3+ because they are used as diamagnetic references)]. Thymidine exchanges between the free state and the ε186/ Θ /Ln3+/thymidine complex state and the PCS in the bound state are transferred to produce the averaged NMR signal in 15N-HSQC spectrum. Therefore, the transferred PCS and transferred paramagnetic line broadenings are useful to measure binding affinities and the structure of the protein-ligand complex. 31 Paramagnetic tagging with ligand also accounts for measuring binding affinities. The lanthanide ion first recognizes the metal binding site of a protein, and then a lanthanide ion binding tag is covalently anchored to a protein side chain. The transient complex of lanthanide ion-ligand then interacts with the protein. Calmodulin-sevoflurane interaction was studied by paramagnetic tagging where the ligand sevoflurane was attached to DOTA. 32 Brath et al. reported the interaction of complex of DOTA-bound sevoflurane La3+, Eu3+, Yb3+, or Dy3+ with calmodulin where the terminal fluorine of sevoflurane was substituted with oxygen because of similar electronic character of oxygen and fluorine. 33 Intramolecular ligand δPCS was measured for complexation Eu3+, Yb3+, or Dy3+ with DOTA-bound sevoflurane and the binding of the paramagnetically labeled drug to calmodulin binding site produced chemical shift changes due to the pseudocontact shift effect (Figure 5 (a,b)). The tagged sevoflurane was observed to possess K D of ∼4.0 mM for the N-lobe and ∼1.8 mM for the C-lobe respectively.

(a) Overlay of 2D NMR 1H−13C HSQC spectra of calmodulin C-lobe titrated with the lanthanoid La3+/Dy3+ complexed with sevoflurane analogs (DOTA-bound sevoflurane). 1H−13C HSQC spectra of 0.1 mM calmodulin C-lobe (black) titrated with 0.05 mM (blue), 0.1 mM (purple), and 0.2 mM (red) Dy3+ complexed sevoflurane analog. (b) represents δPCS of Calmodulin lobe induced by Dy3+ labeled sevoflurane and control ligands. Amide proton δPCS for calmodulin lobes in the presence of sevoflurane ligand and control compound complexed to Dy3+ are indicated as black and gray filled circles, respectively. 33 This figure has been reproduced from 33 Pwith permission from the publisher. [https://pubs.acs.org/doi/10.1021/jacs.5b06220].
This method has some limitations. Selective attachment of the lanthanide ions to different side chain positions enhances the accuracy of the location of the binding moiety and therefore protein site-directed mutagenesis is required. Moreover, detection of the low affinity binding ligands sometimes may be challenging, because the observed paramagnetic effect is small due to the low molar fraction of bound ligand. Modification of the structure of the ligand may influence its binding to protein, and therefore tag attachment at several positions of the ligand may be necessary.
The Transferred-NOESY, ILOE, and NOE Pumping Experiment
The 1H-1H NOESY experiment attributes to the correlation signals caused by dipolar cross-relaxation between spatially closed nuclei. 34 Large molecules produce large negative NOE peaks. For small molecules (MW <500 Da) and for medium-sized molecules (MW range of 500 to 1000 Da) the corresponding NOE peaks are positive and very small negative, respectively. Large molecules build-up NOE quickly in contrast to smaller molecules and therefore for large molecules the maximum NOE is shifted to shorter mixing times. Transferred NOE (trNOEs) spectrum yields a negative NOE because in the bound state (protein-ligand complex), a small molecule (ligand) adopts subsequent NOE behavior of protein. Transferred NOE measurements provide information on the bound state of ligand that bind weakly (K D in µM to mM range) to the target. Transferred NOE measurements may increase the resolution and signal-to-noise ratio of intermolecular NOE cross peaks by narrowing the linewidth in one of the two dimensions. There are two important parameters for these measurements: (1) The mixing time should be short enough for the negligible contribution of NOE signals of free ligands, but long enough when bound to protein, (2) The molar ratio of ligand molecules to the target protein. Therefore, screening of a library of compounds in the presence of a protein receptor, the bound ligand molecules exhibit strong negative NOEs, whereas non-binders will show weak positive NOEs. 35 The trNOE cross peaks arise due to intramolecular interactions between protons in the bound ligand or intermolecular interactions between protons in the protein and protons of the ligand. The trNOE approach has been used for studying the conformation of small ligand-large proteins complexes that are characterized by fast off-rates but if dissociation constant (K D) or dissociation rates (koff) are not known, a titration as well as the recording of trNOE spectra at each point is essential. 36
trNOESY measurement were first employed to examine the binding affinity carbohydrates to lectin, Aleuria aurantia agglutinin (AAA). 37 Lucas et al. demonstrated that exchange-transferred NOE (trNOE) on diffusion time scale can provide valuable information on the multiple binding orientations of HSA with dansylglycine and caprylate wherein both the ligands exhibited primary binding affinity for HSA’s drug site II (Figure 6(b)). 38

(a) 1H BPP-STE (bipolar gradient pulse pair-stimulated echo) spectra for dansylglycine (DG) and caprylate (CAP) at a different ligand to HSA ratio. (i) 25:1 CAP:HSA, (ii) 25:1 DG:HSA, (iii) 25:1:1 DG:CAP:HSA, and (iv) 25:25:1 DG:CAP:HSA. The small peaks observed in (ii) and (iii) between 0 and 2.5 ppm are spectral subtraction artifacts. (b) represents NOESY spectrum for the 25:25:1 DG:CAP:HSA solution. All cross-peaks are the same phase as the diagonal. Intra-ligand cross-peaks (circled) arise from trNOE and indicate binding but ilNOE cross-peaks (boxed) between the two ligands suggest that they are their binding sites on the protein are in close spatial proximity. 38 This figure has been reproduced from ref.38 with permission from the publisher.
In general, NOESY experiments are recorded in the presence of two ligands that bind simultaneously to adjacent binding pockets of the protein forming a ternary complex, to yield intermolecular ligand-ligand NOEs (ILOEs). 39 ILOEs were successfully used to examine the complexation of NAD+ and lycolate to lactate dehydrogenase. 40 Intermolecular trNOEs are important for the analysis of protein-ligand interactions. There are two effects such as spin diffusion and magnetic leakage to the protein can obscure the analysis of the bound conformations of low-molecular weight ligands. As spin diffusion and leakage of magnetism to the protein are the results of intermolecular NOE between protein and ligand. Therefore, in case of spin diffusion, false confirmations of the complex may be obtained. Magnetic leakage to the protein, which occurs due to use of longer mixing times, an artifactual change in the conformation of the ligand-protein complex may be observed. 19 Several techniques have been developed to diminish these two effects. 41
Diffusion-assisted NOE-pumping technique relies on NOE to transfer the signal from the target protein to the bound ligands wherein signal of the non-binding ligands can be suppressed through diffusion filter. 42 The non-binding ligands are separated by the diffusion experiment at the beginning of the NOE experiment and at the end of the NOE experiment, only bound ligand signal is identified because the magnetization is transferred from protein to the bound ligand only. After ligand dissociation from the protein, the delivered magnetization is preserved by the relatively long T1 of the ligands in the free state. As a consequence, ligand signals can still be observed at shorter T2. Figure 7 (a,b) show (Bipolar gradient pulse pair-stimulated echo) BPP-STE pulse sequence and diffusion-assisted NOE pumping pulse sequence, respectively. 42 Diffusion-assisted NOE-pumping experiments were used for interactions of HSA with a binding ligand (salicylic acid) and nonbinding ligands (l-ascorbic acid and glucose). 42,43 1D- 1H NMR spectrum of salicylic acid, L-ascorbic acid, glucose, and HSA in D2O with and without BPP-STE is shown in Figure 8a and stack plot of 1D 1H spectra of HSA with three ligands is shown in (Figure 8 (b)). 42 A standard set-up of BPP-STE diffusion-filtered experiment (Figure 8 (b)) is unable to distinguish a mixture of binding ligand (Salicylic acid) and non-binding ligands (L-ascorbic acid and glucose) with HSA because of insignificant differences in diffusion co-efficient for 3 ligands whereas in NOE-pumping experiment, sufficient gradient is applied to discriminate the binding ligand signal from the unbinding ligands signals, therefore binding interaction of salicylic acid with HSA is easily detected. NOE-pumping experiment can successfully identify the binding ligands whereas the affinity NMR method fails to discriminate between a binding and non-binding ligands.


(a) (Top panel) 1D- 1H NMR spectrum and (Bottom panel) 1D- 1H NMR spectrum with BPP-STE of 10 mM salicylic acid (S), 10 mM L-ascorbic acid (A), 10 mM glucose (G), and 100 µM HSA in D2O. (b) stack plot of 1D- 1H spectra of HSA (at 300 K) in the presence of three ligands as the mixing time tm is increased from 5 ms to 1.2 s in intervals of 0.05 s. 42 This figure is reproduced from ref.42 with permission from the publisher.
A reverse of the previous experimental set-up was also reported wherein for the first set-up involves intermolecular trNOEs between ligand protons and protein protons are suppressed. In the second reference set-up, the T2 filter is applied after the mixing period so that during the mixing time intermolecular trNOEs build up and lead to a decrease of the ligand signal intensities. 44 As a result, the difference of those experiments provide signals of the ligands which are specifically bound to the protein.
Interligand NOE for Pharmacophore Mapping (INPHARMA)
INPHARMA peaks are observed when two ligands can bind competitively to the same binding pocket of a target protein. INPHARMA method is observed through spin diffusion mediated (via protons of protein), transferred NOEs between two ligands that bind competitively to the same target molecule. This method was first successfully used for two ligands such as epothilone A and baccatin III which can bind competitively but not simultaneously to the same target protein, tubulin. 45
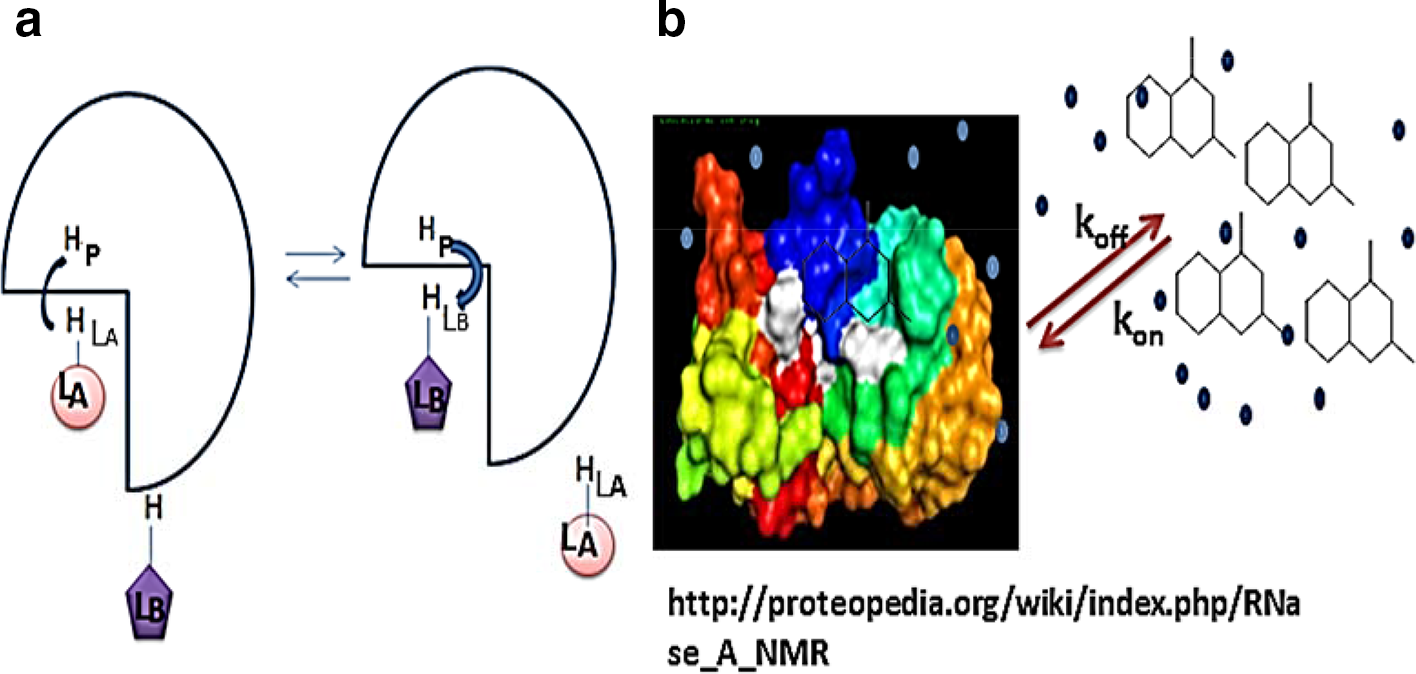
In general, during the mixing time in NOESY experiment, ligand LA binds to the receptor protein P and magnetization is transferred from its proton HLA to the receptor proton HP and ligand LA dissociates from the receptor protein P and then ligand LB binds into the same binding site of the target protein. Subsequently, magnetization transfers from the receptor proton HP to a proton in the ligand LB (HLB) resulting in the observation of an intermolecular transferred NOE between HLA and HLB through spin diffusion-mediated effect via a proton of the protein. Figure 9a shows two ligands, LA and LB, bind to a common target consecutively and not simultaneously. This method is particularly useful to optimize the ligands from chemical library as it detects relative orientation of different compounds in the same target binding site.
(a ), Schematic presentation of the INPHARMA method, two competitive binding ligands LA and LB can bind to the same receptor (P) consecutively but not simultaneously. (b) represents the schematic representation of LOGSY-titration method, for reversibly binding ligands magnetization received from water during the WaterLOGSY experiment is a combination of cross-relaxation obtained from bulk water and cross-relaxation delivered via protein-bound water molecule as proposed in ref.46
Saturation Transfer Difference (STD) NMR Spectroscopy
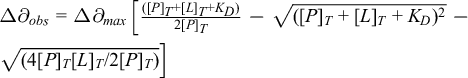
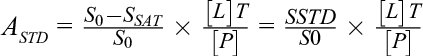
The STD-NMR screening technique is useful to identify ligand moieties that are important for binding to target proteins. The STD-NMR experiment is observed on the ligand-based resonance signals and the technique is based on the principle of nuclear Overhauser effect (NOE). The target protein is irradiated with a radiofrequency field which selectively hits resonances of the protein generally known as on-resonance spectrum. Therefore, in the fast exchange between ligand in the free and in the bound state, the saturation is delivered to the bound ligand via the protein and that saturation is carried over to the free ligand. As a consequence, the second spectrum has to be collected wherein saturation takes place off-resonance. Therefore, the difference measured in STD spectrum represents resonance which originates selectively from the saturated ligand in ligand-protein complex. 47 STD NMR was reported for the interaction of Alisertib (MLN8237), an orally administered inhibitor of Aurora A kinase, with HSA. 48 A schematic representation of STD method is shown in Figure 10a. STD measures the difference of saturated peak of protein (on-resonance spectrum) with signal intensities SSAT, from without protein saturation (off-resonance spectrum), with signal intensities S0. Therefore, difference in the spectrum (SSTD=S0-SSAT) only measures the signal of the ligand that received saturation transfer from the protein as compared to non-binding ligands. However, in the presence of large excess of ligand, the saturation of free ligands in solution gets amplified because the relaxation of small molecules is slower than the saturation transfer. Viegas et al. analyzed STD effect in terms of amplification factor (ASTD) which can be expressed in the following form, 49

(a) Schematic representation of the STD-NMR experiment. (b) STD-NMR spectra of 2-(3’-pyridyl)-benzimidazole in the presence of unlabeled FKBP, perdeuterated, Ile-protonated FKBP, perdeuterated, Val-protonated FKBP, perdeuterated, Leu-protonated FKBP, perdeuterated, Met-protonated FKBP, and perdeuterated FKBP. The resonances corresponding to the ligand are highlighted. (c) STD-NMR spectra of uridine diphosphate N-acetylglucosamine (UDP-GlcNAc) in the presence of unlabeled MurA, perdeuterated, His-protonated MurA, perdeuterated, Trp-protonated MurA, and perdeuterated, Phe protonated MurA. The resonances corresponding to UDP-GlcNAc are highlighted. 50 This figure has been reproduced from ref.50 with permission from the publisher.
wherein ASTD is the amplification factor which is defined as the average number of ligand molecules saturated per molecule of receptor. In equation (8), SSTD/S0 denotes the relative STD effect of ligand concentration[L]T which is present excess of the protein [P] at a molar ratio of [L]T/[P]. Viegas et al. rearranged equation (8) for measuring K D value and which can be represented as
A novel method was introduced based on STD-NMR for the structural determination of ligands complexed to target protein independent of size and composition called SOS-NMR. 50 This method is focused on a ligand complexed to a series of proteins (deuterated except for specific amino acids) and the amino acid composition of the ligand-binding site can be identified, thus leading to the definition of the 3-D structure of the protein-ligand complex. This method is useful when XRD and conventional NMR methods fail to produce the required information on the ligand binding site. This method was successfully applied to 2 systems, FKBP-2-(3’-pyridyl)-benzimidazole complex and MurA-uridine diphosphate N-acetylglucosamine complex, respectively (Figure 10 (b and c)). 50 This method has some limitations. For example, for the application of this method, moderately soluble ligand is required in fast exchange NMR time scale (typically K D >1 µM). Therefore in the case of “lead-like” compounds, the potency will be small or moderate. 51 Thus, this method may be useful in preliminary stages for ligand screening in the drug discovery process. Another novel approach to STD-NMR was proposed by Jayalakshmi et al. 52 This method relies on the optimization of intensity-restrained procedure to predict the structures of ligand in the bound protein. This is achieved by inclusion of a structure refinement method involving CORCEMA (complete relaxation and conformational exchange matrix) calculation. This method was used for screening of carbohydrate and peptide ligands.
Water-LOGSY Method
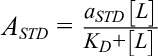
Water-LOGSY is one of the powerful techniques used to screen ligand binding to target proteins. In this experiment, 1H of bulk water is excited and magnetization is transferred from 1H of bound water to 1H of bound ligand via indirect spin diffusion. 53 In this experiment, compounds that can interact with the target protein usually yield positive resonances (that have the same sign as protein resonances), and compounds that do not bind to the target usually show-up as negative resonances. Water-LOGSY experiments provide information on the bound ligand population. This method can be applied for the characterization of ligand-protein interactions in relatively large molecular weight systems. 54 The K D value was successfully measured for HSA-L-tryptophan complex using Water-LOGSY method. The K D values calculated are accurate and are consistent with those calculated using other methods. 17,55,56 Another reports showed that K D values became higher for titration experiment of varying concentrations of bovine serum albumin (BSA) with L-tryptophan. 57 The deviations of K D value was also observed for binding of 3-fluorophenylboronic acid to α-chymotrypsin at higher concentrations of α-chymotrypsin and long mixing time. However, accurate K D value may be obtained at lower concentrations of protein. 58 The use of Water-LOGSY method is restricted in fragment screening where determination of K D is the needful step. 58 Water-LOGSY method also is limited due to its inability to differentiate between buried and surface-accessible area of ligands. A novel technique was emerged called LOGSY titration to discriminate between buried and solvent-accessible area of ligands and to map protein-bound water molecules in close proximity to the ligand. 59 The scheme of LOGSY titration is shown in Figure 9 (b). The method was applied to determine buried and solvent-accessible epitopes for binding of two synthetic molecules 6-(3,4-Dimethoxyphenyl)-3-methyl 1,2,4 triazolo[4,3-b]-pyridazine and 1-Methyl-5-phenoxy-1H-pyrazole-4-carboxylic acid ethyl ester with bromodomain 1 present in protein 4 (Brd4-BD1), a prominent cancer target (Figure 11 (a and b). 59 The merit of this method as compared to conventional ligand-based methods is its independence of the molecular mass of the protein.
LOGSY titration of 6-(3,4-Dimethoxyphenyl)−3-methyl
1,2,4
triazolo[4,3-b]-pyridazine (a ) and 1-Methyl-5-phenoxy-1H-pyrazole-4-carboxylic Acid Ethyl Ester (b )with perdeuterated bromodomain 1 present in protein 4 (Brd4-BD1) ligands. 100% corresponds to the signal with the strongest slope. X-ray crystal structures of the complexes Brd4-BD1 with ligand are shown here. H2O molecules resolved in the electron density map and within a distance of 6 Å from the ligand are shown as blue spheres.
59
This figure has been reproduced from ref.59 with permission from the publisher. [https://pubs.acs.org/doi/abs/10.1021/acs.jmedchem.7b00845]
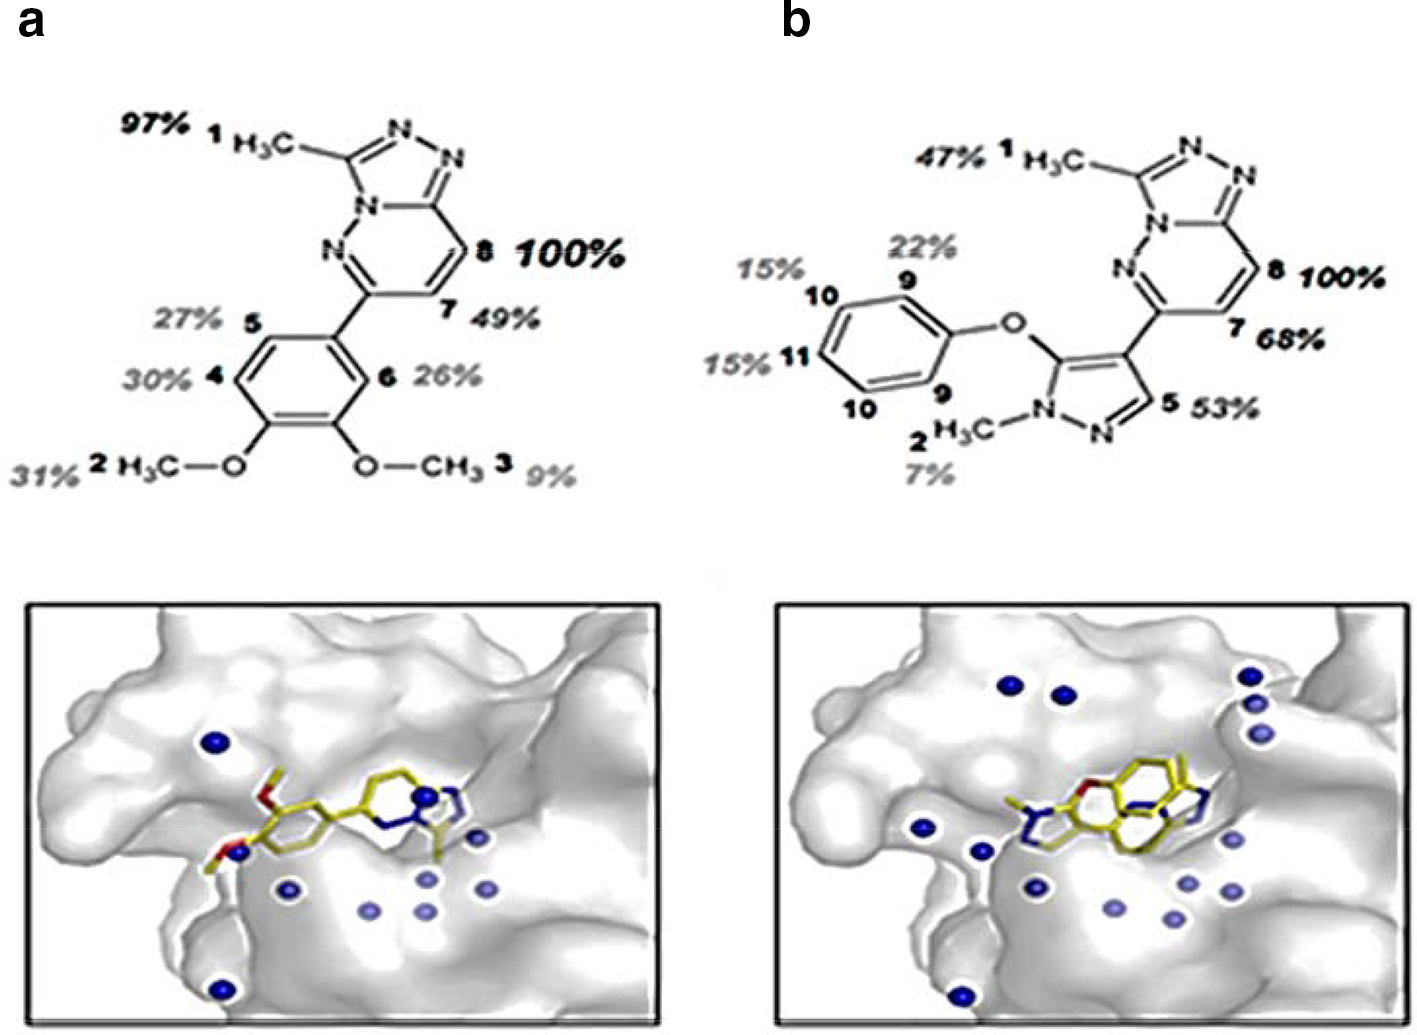
Cross Saturation and Transferred Cross Saturation
The characterization of protein-large molecules interfaces is a key factor to understanding of biological mechanisms at a molecular level. Cross-saturation experiment provides accurate information on the interface of larger protein complexes. 46 The cross-saturation mapping of protein–large molecule interfaces is based on the steady-state NOE-difference experiment wherein 1H resonance signals of a non-deuterated target components (protein II) are saturated and accounts for observation of magnetization of NH protons of a second deuterated and 15N-labeled protein (protein I) (Figure 13(a)). However, in cross-saturation method residue-specific information can be helpful to provide accurate information about protein-large molecule interfaces but the cost of sample preparation is high.
It is observed that mapping of binding site of 15-nucleotide RNA on the RNA-binding protein, Nova1 KH3, obtained from cross-saturation 1H/15N-HSQC experiments was almost similar to the binding site predicted from the CSP method and X-ray crystallography. 60 Therefore, it can be suggested that combined use of CSP and cross-saturation data will be helpful to identify the interaction sites with high accuracy. Ferrage et al. proposed a novel approach to the direct determination of the likely pose of a peptide from the proline-enriched tyrosine phosphatase, onto a protein Src homology 3 (SH3) domain of the C-terminal Src kinase (CSK) by utilizing frequency-selective cross-saturation using a low stringency isotopic labeling method(s) and side-chain protons as probes of the interface (Figure 12(a and b). 61 It is demonstrated that the advantages of the methods related to the enhancement of overall efficiency of saturation along with better coverage of interaction interface could lead to the increase in accuracy of the overall results. The biggest advantage of this approach involves significant variations of the saturation transfer between experiments could be associated to the local chemical shift distribution in the protein to achieve site-specific restriction on both elements which will be helpful for molecular docking studies. 62,63 This method will be very applicable for confirmation of most occupied contacts in the particular cases wherein substantial motion is present in a complex which may lead to design of potential ligands. However, cross-saturation method is difficult to be applied to the protein complexes with a molecular mass greater than 150 kDa. The molecular weight limitation is overcome by introducing an extended version of cross-saturation method called transferred cross-saturation (TCS) method. 64 In this method, saturation in target protein (protein II) in the complex is transferred significantly to the residues of the bound uniformly isotopically labeled (with 2H and 15N) ligand protein (protein I) at the interaction interface, and the contact residues of protein I in the complex are identified by observing the decrease of the peak intensities on a 1H–15N shift correlation spectrum (Figure 13(b)). The information on the contact residues is transferred on the ligand proteins in the complex, from the ligand proteins in the bound state to those in the free state, under a fast exchange process (k ex>0.1 s). 65 The TCS method has a higher sensitivity toward low-affinity transient interactions. It is demonstrated that this method is effective for the investigation of very large systems including membrane-embedded protein interactions, liposomes, and insoluble biomolecules. 66

Saturation of the signals from 13C bonded aromatic (
Schematic representation of cross-saturation (
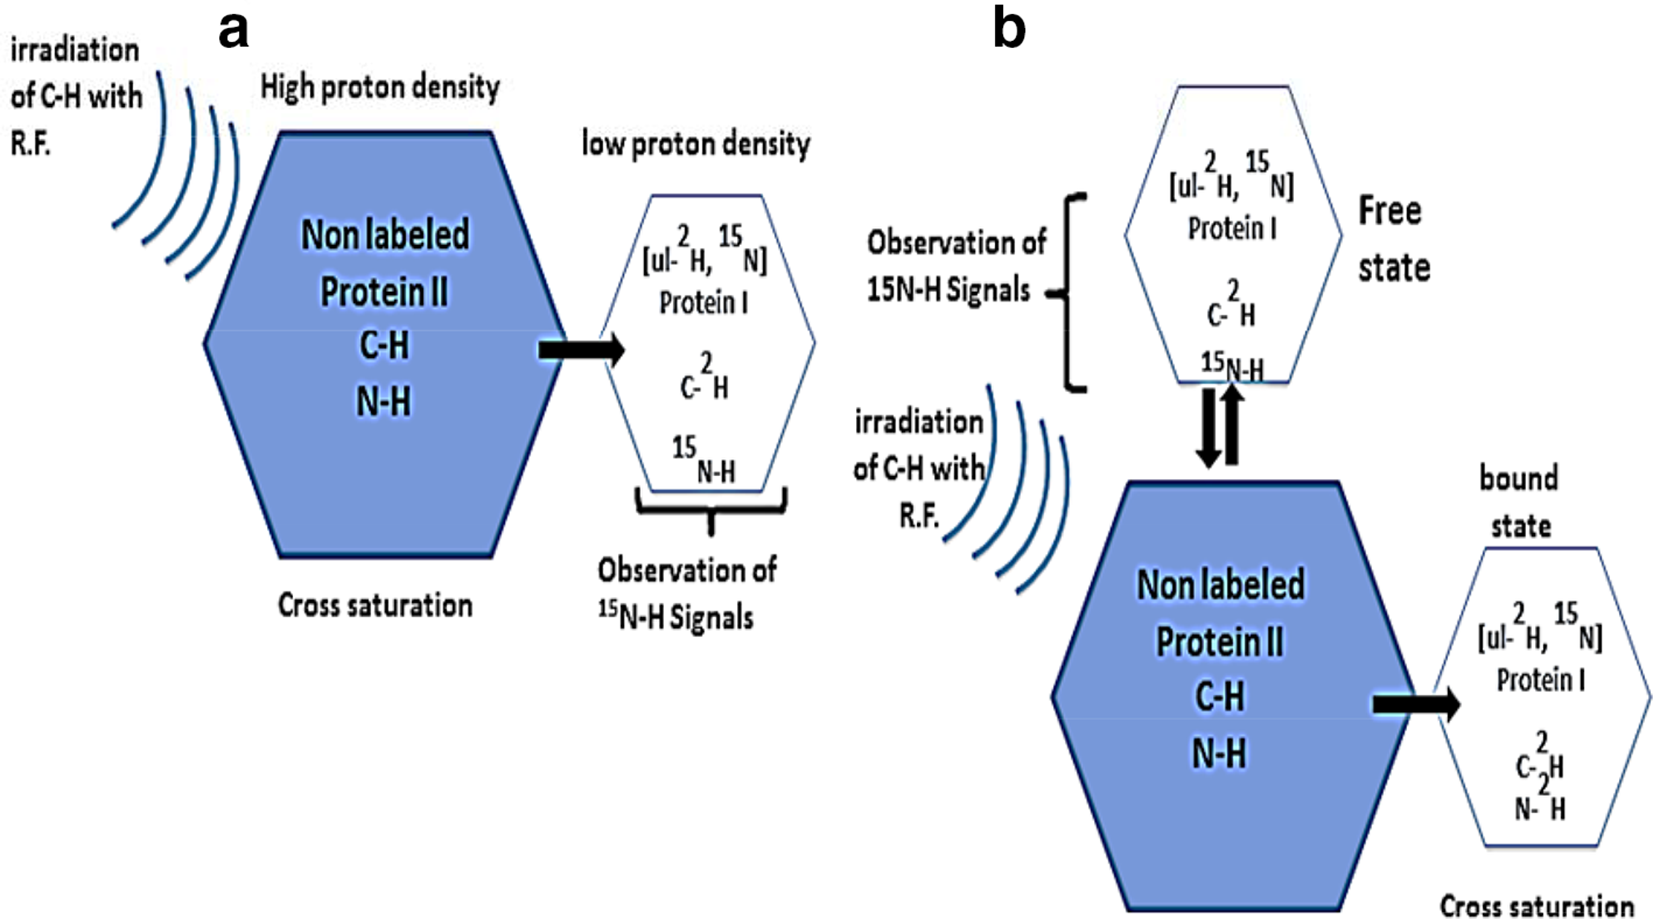
Diffusion-Ordered Spectroscopy (DOSY)
The translational diffusion coefficient of a protein is an useful parameter to obtain information on a protein’s hydrodynamic state in solution as well as to study conformational changes upon addition of ligands. 67 In the DOSY method, it is possible to measure translational diffusion in solution by utilizing pulse-field gradients (PFGs) with higher accuracy. 68 This method is a valuable approach for the detection of binding of low-molecular-weight compounds to large molecular weight protein receptors, ie specific for molecules with weak binding affinity (K D>1 mM). Small molecules bound to protein diffuse at the slower rate of the protein than at the typical rate for small molecules. Therefore, it is possible to distinguish compounds in the presence or absence of protein from a mixture of compounds according to their diffusion properties. 69 Ferrage et al. reported a novel pulsed field gradient(PFG) NMR method for measuring the translational diffusion coefficient of an integral membrane protein/surfactant complex. 70 The novel pulsed field gradient NMR method has advantage compared to the conventional NMR methods with pulse field gradient because this method can be applied to macromolecular assemblies (>25 kDa) in aqueous solution at room temperature. This new method was successfully applied to a water-soluble complex of tOmpA, the hydrophobic transmembrane domain of bacterial outer membrane protein A, with the detergent octyltetraoxyethylene (C8E4; total mass of complex ~ 45 kDa) (Figure 14(b)). Another novel method was proposed for considering multiple diffusion measurements associated with each molecule in a mixture. In a mixture of ligands, multiple pairs of diffusion coefficients for each ligands arise from a pair of DOSY spectra in the presence and absence of protein. Separation of diffusion data characterizing ligands along two dimensions would allow for more efficient clustering to distinguish between ligands. Snyder et al. demonstrated the use of CoLD-CoP (Clustering of Ligand Diffusion Coefficient Pairs) technique to identify specific ligands that bind to target protein(s). 71 Thus CoLD-CoP technique was useful to discriminate the binders such as, N-acetylglucosamine (GlcNAc) and tryptamine with lysozyme and tartrate with wheat germ acid phosphatase (WGAP) from non-binders. This method is not applicable when the protein binding is weak and when protein concentration is limited. However, this method is particularly useful for fragment-based ligand screening. 71 Didenko et al. reported that 3D DOSY–heteronuclear multiple quantum coherence (HMQC) pulse sequence that uses the TROSY (transverse relaxation-optimized spectroscopy) effect of the HMQC sequence on 13C methyl-labeled proteins and is highly suitable for measuring the diffusion coefficient of large proteins. 72 3D DOSY–HMQC experiment is suitable for a detailed analysis of the diffusion coefficients of complex mixtures of small organic molecules. 73
(a) Pulse sequence for the measurement of diffusion coefficients using longitudinal magnetization of a heteronucleus such as nitrogen-15 with stimulated echoes (X-STE). Narrow and wide pulses represent 90° and 180° pulses, respectively.
SAR (Surface Activity Relationship) by NMR
SAR by NMR-based approach is introduced for discovering high-affinity ligand binding to the individual binding sites of protein. 74 Binding of small molecules to proximal sites in a protein are primarily identified and optimized by this method. Small molecules are screened by 15N-1H- chemical shift changes monitored by 1H-15N HSQC using 15N labeled proteins. The subsequent step requires the optimization of the second weakly interacting ligand to an adjacent binding site and the binding is identified via the observed chemical shift changes. Final step involves, structural orientation of the bound ligands in order to guide their linkage and maintain this structural orientation and information to obtain high binding specificity to the target compound (Figure 15(a)).
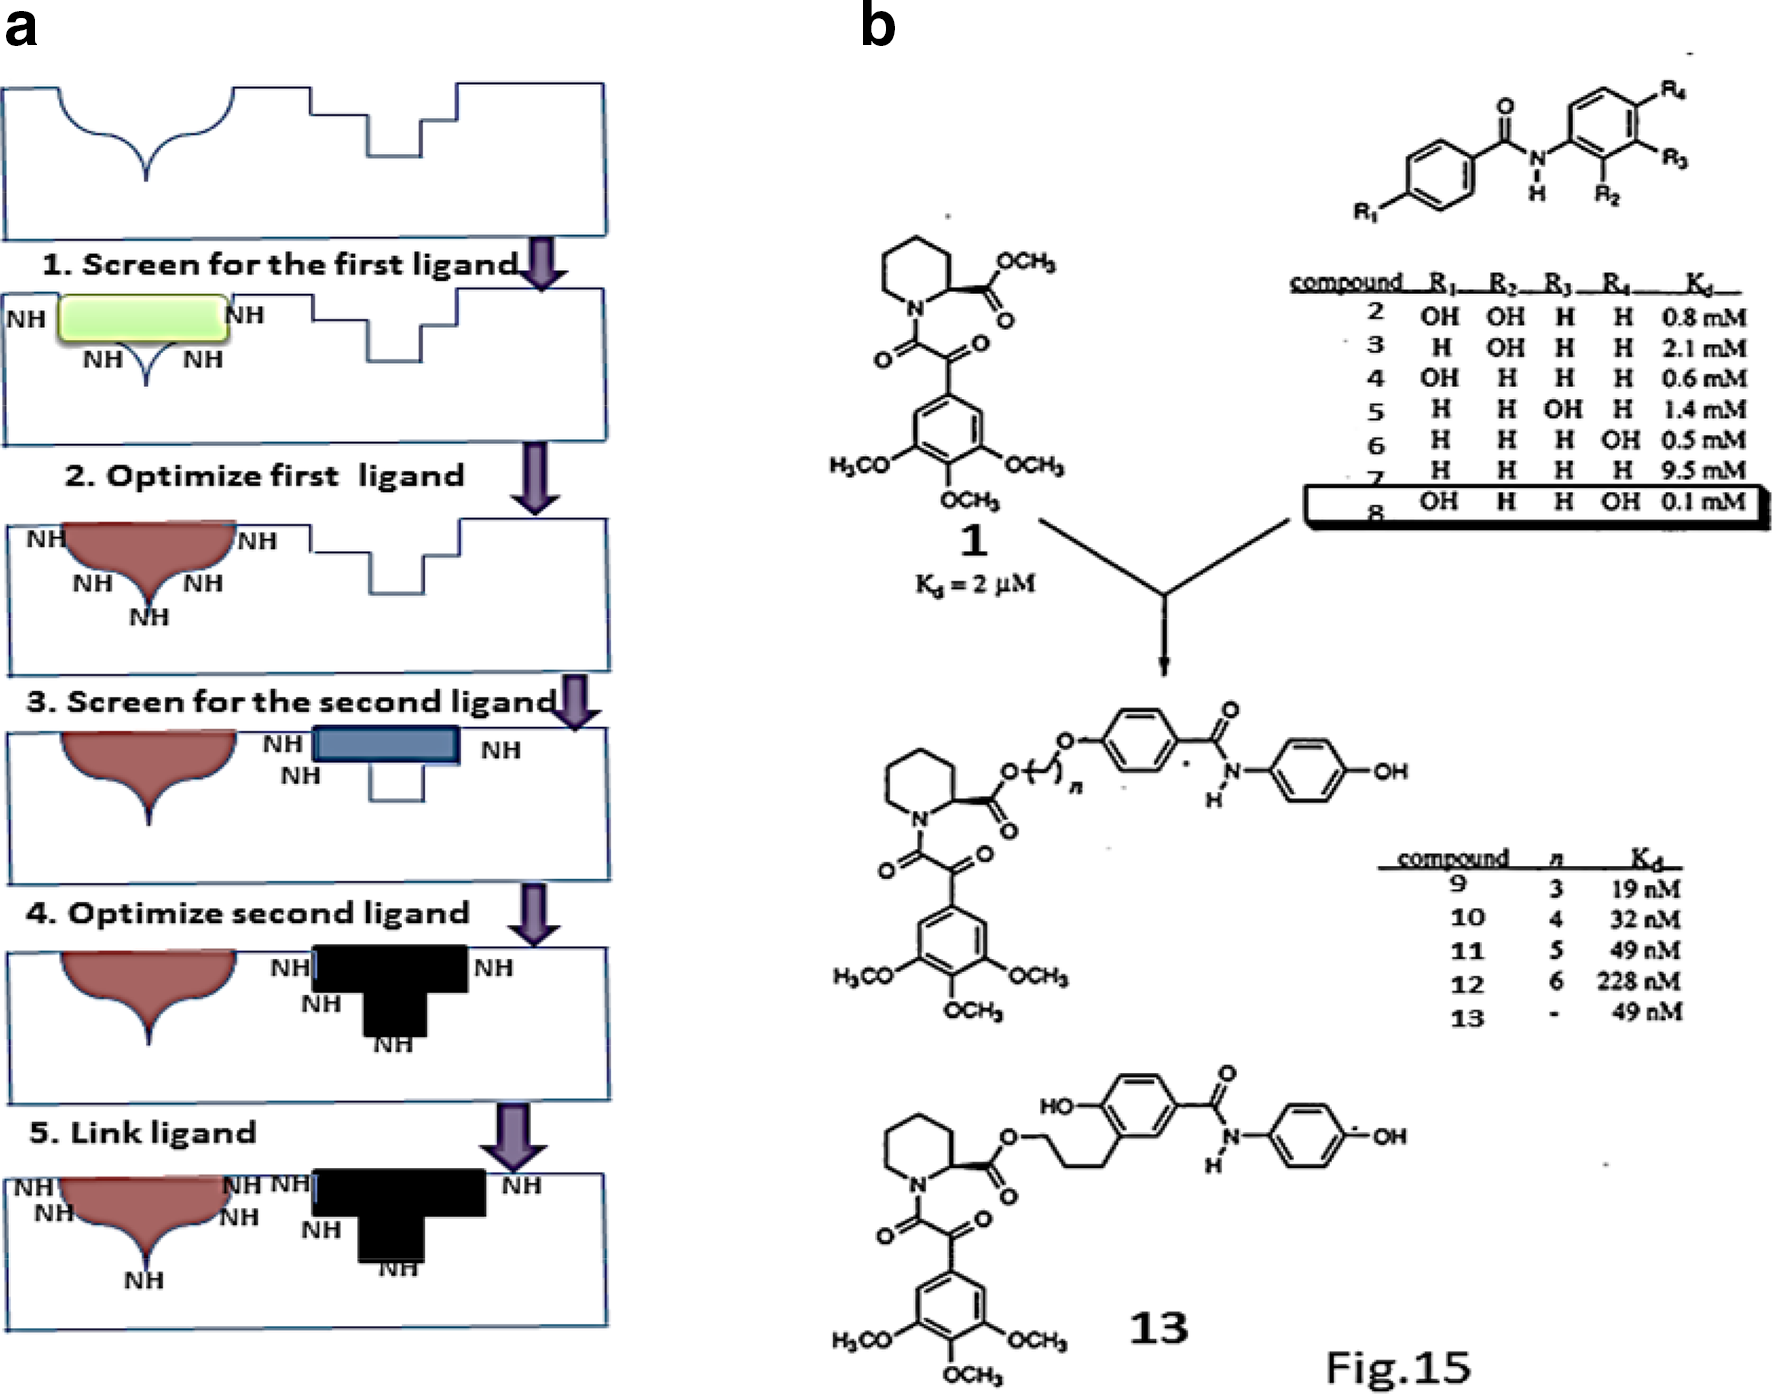
(a), Schematic representation of SAR by NMR. (b), list of compounds with different substituents tested in 1H/15N-HSQC binding experiments to FKBP. 74 The equilibrium binding constants(K D) are given in the table for different compounds. This Figure has been reproduced from ref. 74 with permission from the publisher.
First a 15 N-1H HSQC spectrum of the labeled protein is collected as a reference spectrum and if the resonance signal is shifted in presence of one or many other molecules with respect to reference spectrum it is marked as a sign of binding (Figure 16). The SAR by NMR method effectively leads to the development of highly potent compounds and this method has been emerging as one of most powerful techniques for fragment-based lead discovery (FBLD) as it produced a large number of high-affinity ligands for target macromolecules.
75
The SAR by NMR approach has been successfully used to screen ligands that bind to the FK506-binding protein, FKBP.
74
A number of compounds from a designated chemical library were first screened for binding. Among all other compounds, trimethoxyphenyl pipecolinic acid derivative (
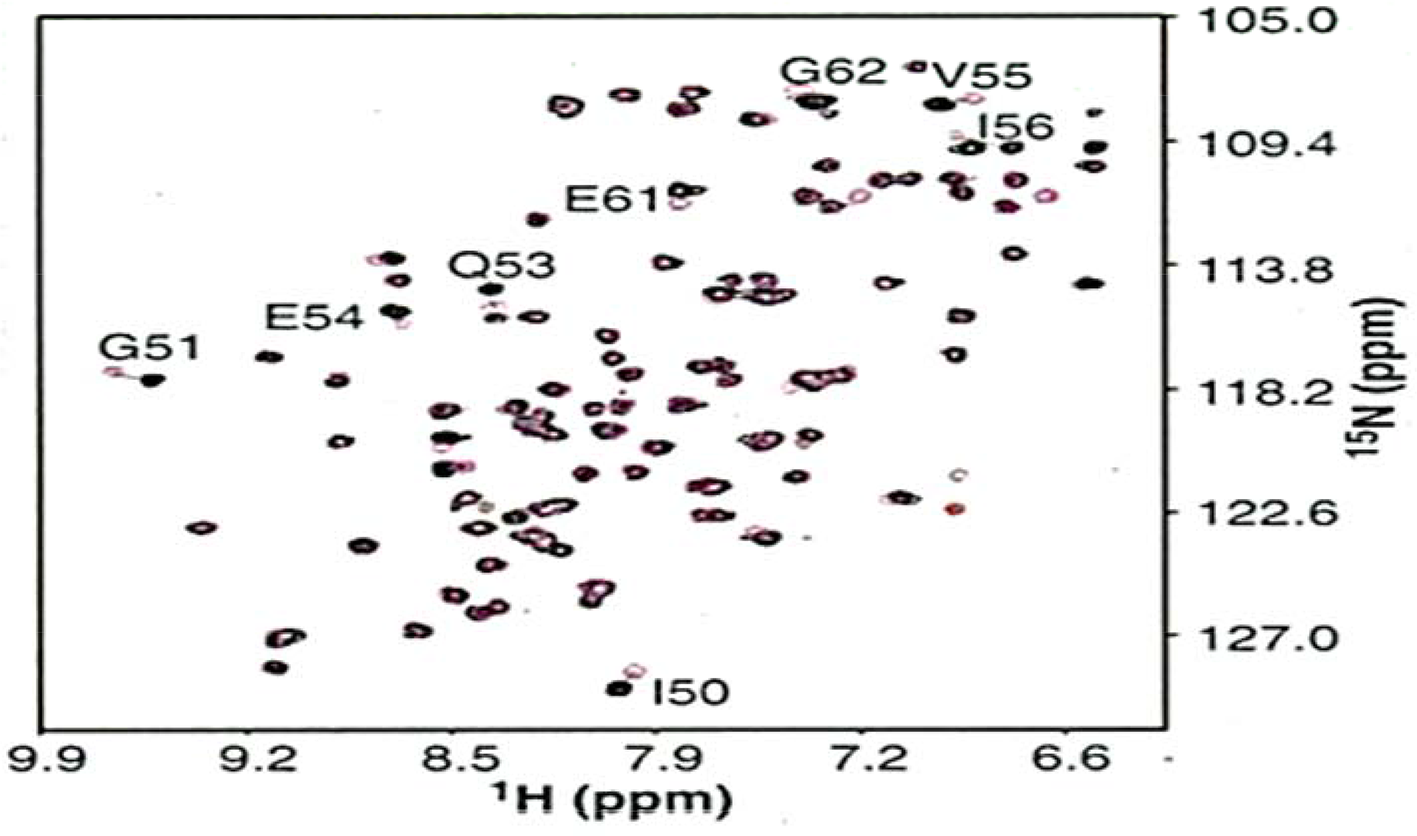
An overlay of 1H/15N-HSQC spectra for FKBP in the absence (magenta contours) and presence (black contours) of benzanilide derivative (compound 2) with saturating amounts of trimethoxyphenyl pipecolinic acid derivative (Compound 1)(2 mM). 1H/15N CSP observed for resonance signals of the residues are indicated. 74 This figure is reproduced from ref.74 with permission from the publisher.
Conclusion
Characterization of protein-ligand interface is key to rational drug discovery. Detailed structural analysis of ligand-protein interface will likely provide valuable clues for the design of specific and potent small molecule antagonists against key cellular processes associated with disease(s). NMR spectroscopy has come of age. Recent advancements in instrumentation technology in conjunction with the development of new methods has significantly increased the versatility of NMR spectroscopy as the method of choice in modern drug discovery. In addition, advent of cryoprobes has significantly decreased the data acquisition times and sample requirements. Further, with availability of the microprobe technology, multidimensional NMR data can now be acquired even under high salt concentrations. Most importantly, NMR spectroscopy is now amenable for high throughput ligand binding studies. The applications of NMR spectroscopy are fast expanding and in this context the recently emerging in-cell NMR spectroscopy offers a new avenue(s) for investigating the effects of small molecule drug candidates under ex-vivo condition.
Footnotes
Declaration of Conflicting Interests
The author(s) declared no potential conflicts of interest with respect to the research, authorship, and/or publication of this article.
Funding
The author(s) disclosed receipt of the following financial support for the research, authorship, and/or publication of this article: This work was supported by the Department of Energy (grant number DE-FG02-01ER15161), the National Institutes of Health/National Cancer Institute (NIH/NCI) (1 RO1 CA 172631) and the NIH through the COBRE program (P30 GM103450), and the Arkansas Biosciences Institute (ABI-TKSK-2016-17).