
Abstract
Background:
Gestational diabetes mellitus (GDM) is a frequent metabolic complication during pregnancy that significantly impacts both maternal and neonatal health outcomes regularly resulting in NH. Exploring the interactions between maternal characteristics, neonatal outcomes, and data collected from wearable technologies, such as continuous glucose monitoring (CGM) could potentially enable the development of predictive models and support personalized care.
Methods:
This study employed probabilistic modeling, using Bayesian networks (BNs), to analyze data from the STEADY SUGAR clinical trial (N = 118 women with GDM) with the aim of discovering interactions between maternal characteristics, CGM-derived features calculated in the 90 days preceding delivery, and neonatal outcomes, particularly NH. The final BN returns a graph and conditional probability tables between inputs and outputs, whose statistical relevance has been quantified via odds ratios (ORs).
Results:
Direct associations were identified between NH and maternal hypertension (OR: 2.13 [1.02, 4.46]), family history for diabetes (OR: 1.43 [0.57, 3.57]), and elevated maternal body mass index (BMI) (OR: 3.59 [1.42, 9.08] comparing lower vs higher BMI categories). Cesarean delivery also influenced NH risk (OR: 2.05 [0.98, 4.28]). Indirect associations involving medication regimens and delivery type were significant. Ethnic disparities emerged, notably higher hyperglycemia among Afro-American patients (OR: 2.91 [1.19, 7.11]), highlighting ethnicity-related variations in glycemic control. Notably, CGM-derived metrics were associated with multiple neonatal outcomes.
Conclusions:
Bayesian network allowed to explore the complex interactions between variables in pregnancies affected by GDM. This framework will be extended with wider data sets to provide valuable insights for clinical decision-making able to mitigate maternal and neonatal risks.
Keywords
Introduction
Gestational diabetes mellitus (GDM), defined as any degree of glucose intolerance first recognized during pregnancy, 1 represents a major public health concern. It stands as the most prevalent metabolic complication among pregnant women, impacting 15% to 25% pregnancies woldwide. 2 Gestational diabetes mellitus poses significant risks to both mother and child. For mothers, these include short-term complications, such as preeclampsia, miscarriage, and an increased likelihood of cesarean delivery, as well as long-term risks, particularly the development of type 2 diabetes (T2D). 3 For newborns, GDM is associated with adverse outcomes including macrosomia, higher rates of neonatal intensive care unit admission, and increased long-term susceptibility to obesity, hypertension (HT), and T2D.3,4
Among the neonatal complications associated with GDM, neonatal hypoglycemia (NH) stands out as a critical concern. Neonatal hypoglycemia is characterized by abnormally low blood glucose levels, defined as below 47 mg/dL, during the first hours after birth. If not detected and promptly treated, NH can be particularly dangerous, potentially resulting in severe neurological consequences, such as long-term neurodevelopmental impairment or even cerebral palsy. 5 The etiology of NH in the context of GDM is multifactorial, reflecting a complex interplay of physiological, behavioral, and demographic risk factors. These factors, ranging from maternal metabolic profiles and demographics to glycemic variability, are often analyzed in isolation or summarized into composite risk scores. 6
A critical advancement in the field of GDM care is the increasing use of continuous glucose monitoring (CGM) systems during pregnancy. 7 Continuous glucose monitoring provides high-resolution, real-time glucose data that capture dynamic patterns of maternal glycemia, including fluctuations, trends, and nocturnal variations that are not detectable through traditional self-monitoring blood glucose (SMBG) devices. Emerging evidence suggests that glucose variability and time in range, as measured by CGM, may be particularly relevant for predicting neonatal complications, such as NH. 8
Understanding how CGM-derived glucose features interact with maternal characteristics and other clinical parameters could improve risk prediction and support more individualized care. Probabilistic frameworks, such as Bayesian networks (BNs), can model these complex relationships by representing conditional dependencies between variables. 9 In recent years, BNs have indeed emerged as promising probabilistic tool for modeling complex temporal and causal relationships in healthcare. For example, Roversi et al 10 demonstrated the use of BN for simulating and stratifying the risk of developing cardio-metabolic comorbidities on an aging adult population. Furthermore, Filho et al 11 showed how BN can be used for early diagnosing GDM, while in the work of Neves et al 12 , it is showcased the use of BN to build decision support systems targeting glucose control in GDM.
Building on this approach, in this study, we used data from a recent clinical trial involving pregnant women diagnosed with early GDM (8/24 weeks of gestation) to develop a BN aimed at capturing the conditional dependencies among maternal characteristics, CGM-based glucose features, and neonatal outcomes, with a particular focus on NH. This probabilistic graphical modeling approach enabled the integration of both empirical data and expert clinical knowledge, allowing us to effectively represent and quantify the complex relationships among variables in a structured, interpretable, and clinically meaningful manner.
Methods
Data Set
We used data originating from the STEADY SUGAR clinical trial (clinicaltrial.gov id: NCT04948112), a single-center study conducted at the Woman’s Hospital, Baton Rouge, LA, USA. The study involved 120 women diagnosed with GDM between 8 and 26 weeks of gestation and aimed at investigating the effectiveness of CGM vs SMBG on glucose variability control during pregnancy and maternal/neonatal outcomes. Patients were randomized to either CGM (n = 80; unblinded Dexcom G6 CGM—Dexcom Inc, San Diego, CA, USA) 13 or the control group (n = 40; SMBG + monthly blinded Dexcom G6 CGM). Both groups received lifestyle and medication (MED) guidance based on glucose data until delivery. Two women in the control group were excluded because of inadequate delivery and neonatal data.
Beside glucose recording, collected data included patient-related information (ie, age, ethnicity, glucose control therapy information, pre-study body mass index [BMI], parity, family history for diabetes (FHFD), gestational-week diagnosis, diagnosis of HT, and presence of GDM in previous pregnancies), maternal outcomes (ie, delivery type, and preeclampsia) and neonatal outcomes (ie, gestational age [GA], large for gestational age [GA], baby sex, preterm [P], presence of shoulder dystonia [SD], APGAR at five minutes, and NH).
Data Preprocessing
Given the heterogeneous nature of both clinical records and sensor-derived data, and the possible presence of missing values, dedicated preprocessing steps were performed to ensure data quality and consistency. This was particularly important for extracting robust features to be used for BN model development.
To obtain a single representative feature set for each patient, CGM data were preprocessed using the AGATA open-source toolbox. 14 Specifically, data from the 90 days preceding delivery were extracted. Gaps in glucose measurements of up to 30 minutes were imputed via linear interpolation. From the processed CGM data, a comprehensive panel of glycemic control and variability metrics was computed. 15 These included average glucose, glucose standard deviation (STD), glucose coefficient of variation (CV), mean amplitude of glycemic excursions (MAGE), and the percentage of time spent in various glycemic ranges: level 1 hypoglycemia (blood glucose = 54-63 mg/dL), level 2 hypoglycemia (< 54 mg/dL), level 1 hyperglycemia (140-250 mg/dL), level 2 hyperglycemia (> 250 mg/dL), and the target range (63-140 mg/dL).
For the remaining clinical and demographic variables, missing values were handled using the Miss Forest algorithm, a non-parametric, random forest-based imputation technique well suited for data sets with mixed data types, which demonstrated strong performance in medical and epidemiological studies. 16
We adopted a fully discrete implementation of BN, which models all variables as categorical and relies on conditional probability tables (CPTs) to represent their dependencies. Accordingly, continuous variables were discretized prior to model development using two distinct strategies. For time spent in level 1 and level 2 hypo/hyperglycemia, we categorized data into two levels, determined by presence or absence. For the other continuous variables, consistent with common literature practices, 17 we established three levels based on terciles. In Table 1, we provide a comprehensive summary of the data set, grouping features into mother characteristics, interventions on mother, study, CGM-derived metrics, and neonatal outcomes categories. For each feature, we report the distribution across levels with the corresponding frequencies.
Data Set Summary.
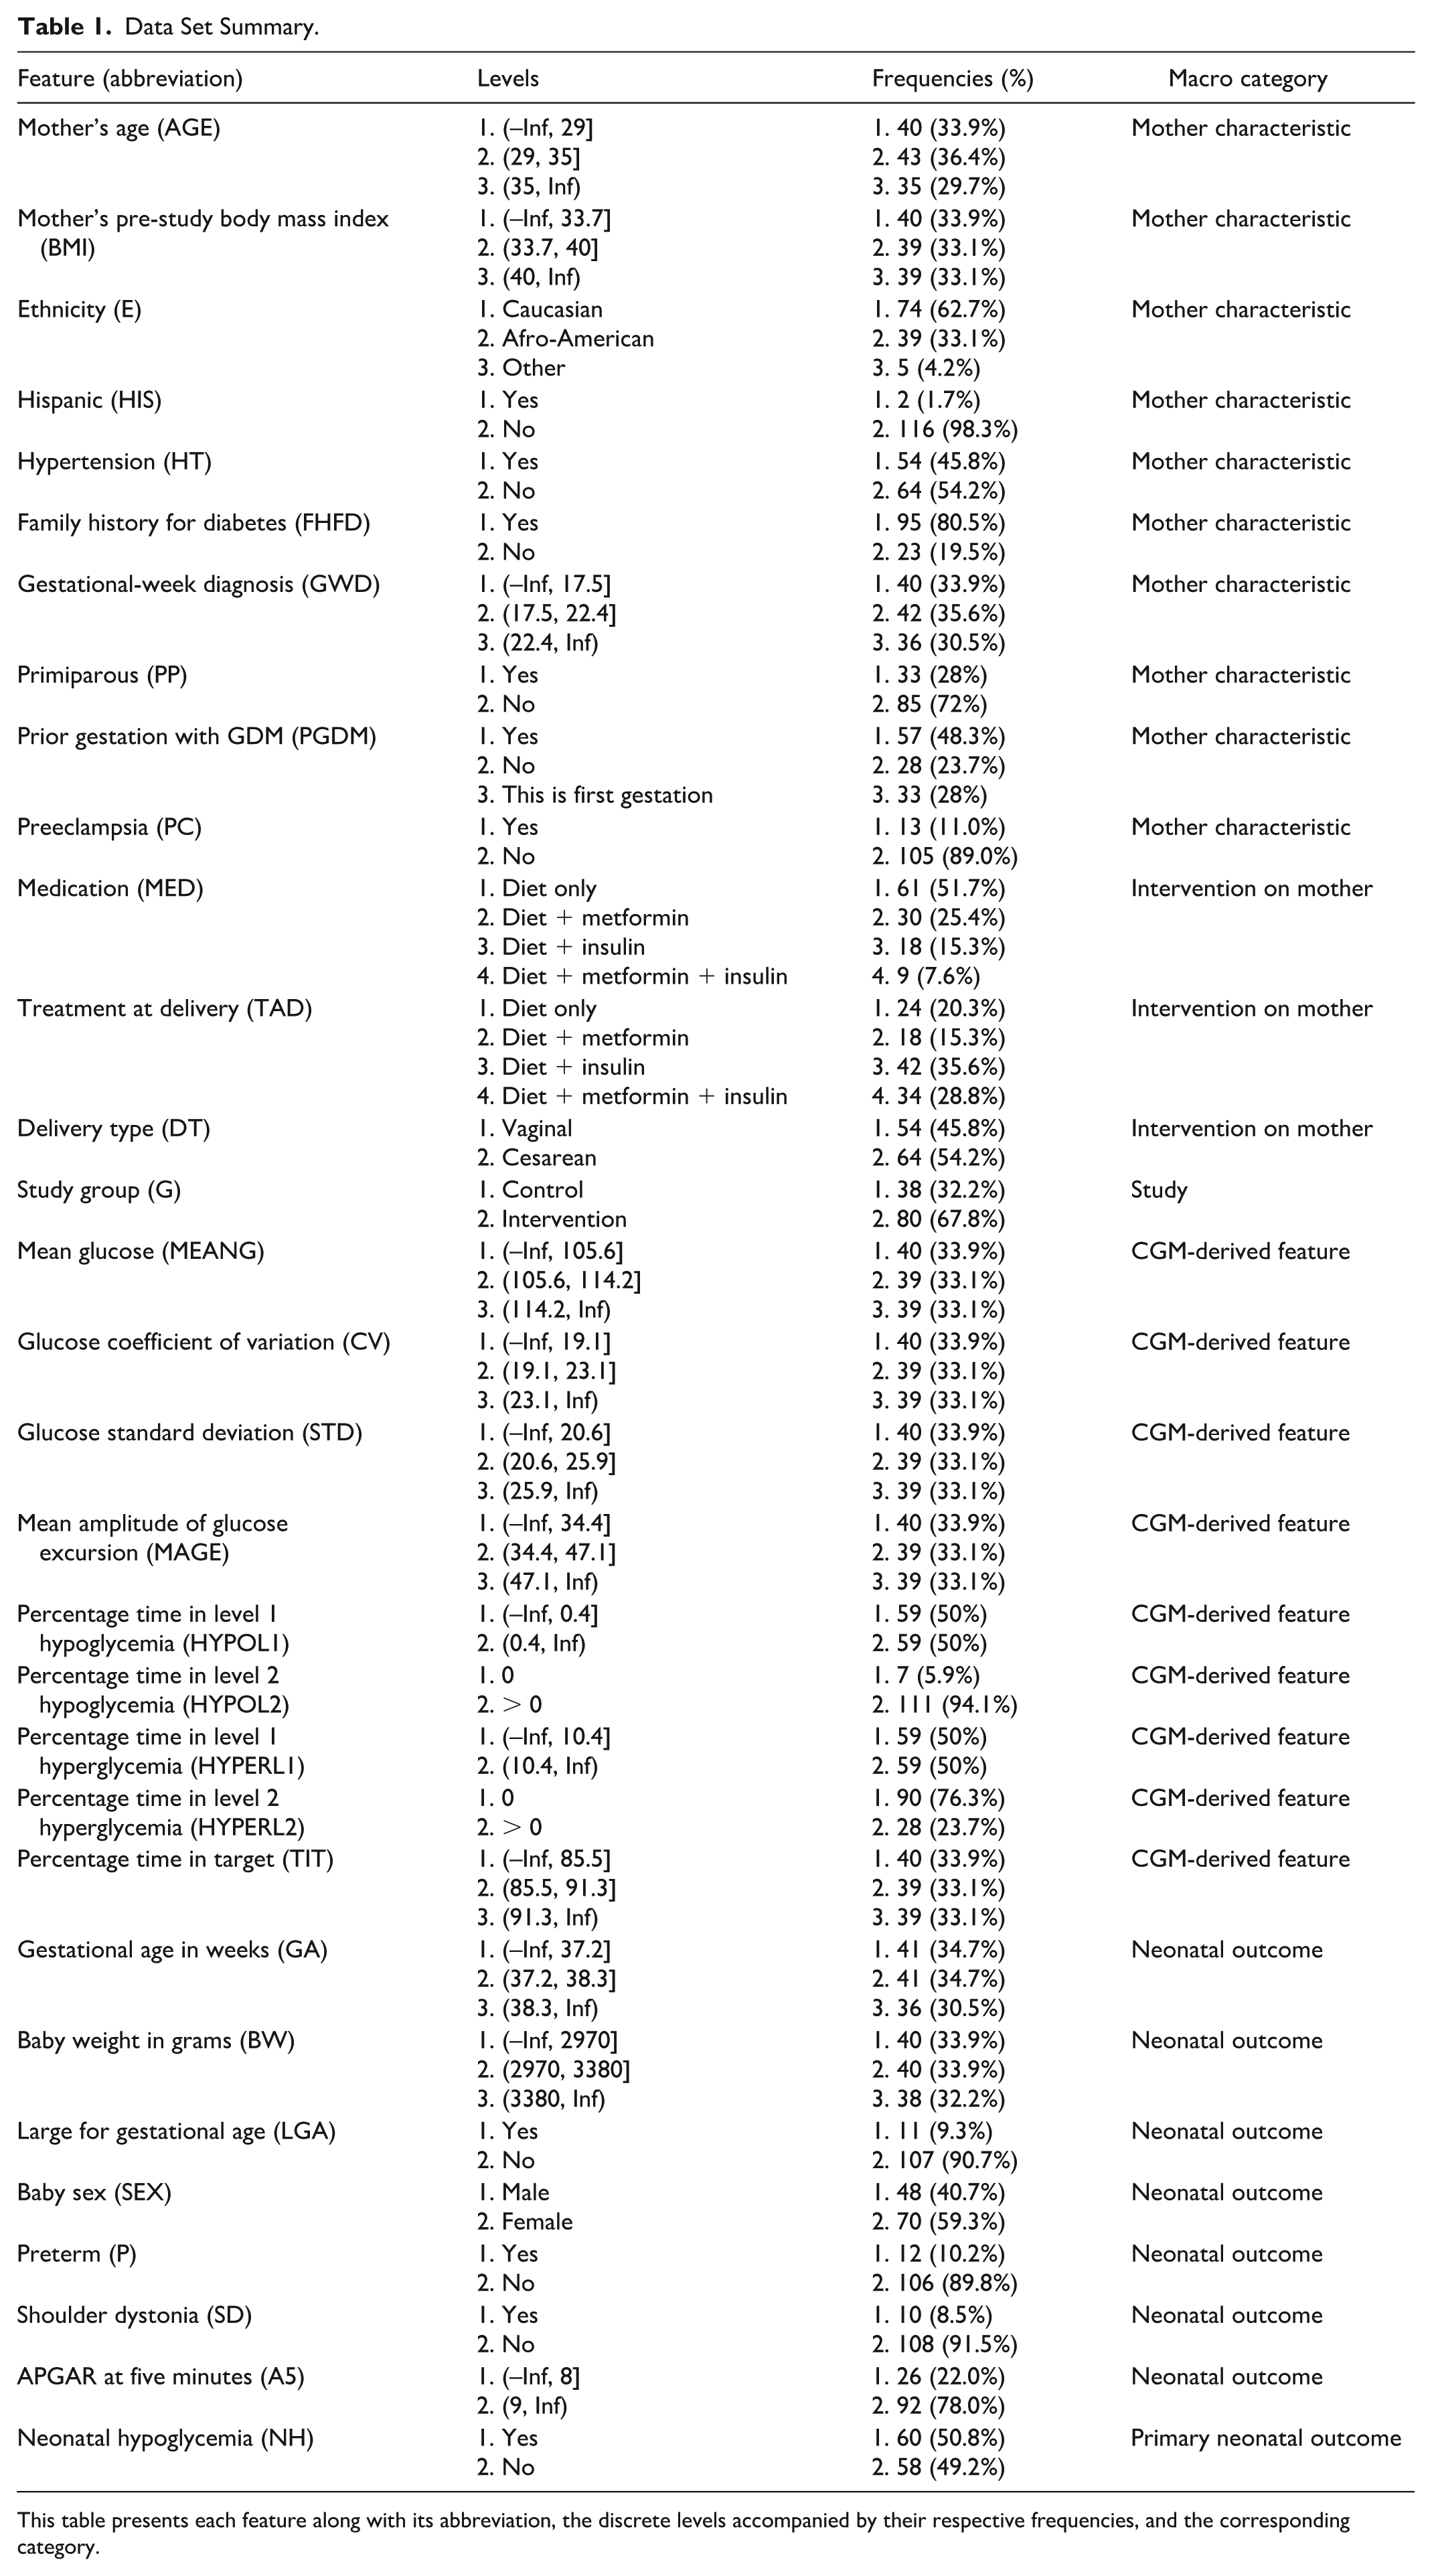
This table presents each feature along with its abbreviation, the discrete levels accompanied by their respective frequencies, and the corresponding category.
BN Learning
As anticipated, to model the relationships among the features in the data set, we employed a BN, a probabilistic graphical model that represents a set of random variables and their conditional dependencies through a directed acyclic graph (DAG). 18 In a BN, each node corresponds to a random variable, while the edges denote direct probabilistic dependencies between these variables. Bayesian networks are widely used for reasoning under uncertainty, performing inference, and making predictions in areas, such as machine learning, bioinformatics, and decision analysis. 19
The learning of the BN structure was performed in R (v 4.4.1) using the widely adopted Hill Climbing (HC) algorithm 20 implemented in the bnlearn package. 21 Details about the implemented pipeline are reported in the Supplementary Material, section 1 “Bayesian Network Learning procedure.”
Results
Qualitative and Quantitative Analysis of the Learned BN
After learning the BN, we performed a two-stage analysis aimed at interpreting and quantifying the inferred relationships.
The first phase consisted of a qualitative exploration of the BN. We examined the network topology to interpret connections among maternal characteristics, CGM-derived metrics, interventions, and neonatal outcomes, with a particular focus on NH. Specifically, we analyzed the immediate and indirect parental and child nodes of NH and other neonatal outcomes, and mapped these relationships to existing clinical knowledge and published literature.
In the second phase, to quantify the associations represented in the BN using standard epidemiological metrics, while also incorporating uncertainty estimates derived from the probabilistic structure of the model, we performed a quantitative analysis by converting the CPTs derived from the learned BN into expected contingency tables and computing, using the Wald method, 22 pairwise odds ratios (ORs) between specific variables of interest, especially parent variables with neonatal outcomes. Practical details on the calculation of the ORs are reported in the Supplementary Material, section 2 “Odd Ratio (OR) calculation procedure.”
Analysis of the Structure of the Learned BN
Figure 1 depicts the BN structure derived from the STEADY SUGAR trial data set. Each node in the network represents a variable, color-coded based on its macro category: maternal characteristics (pink), maternal interventions (violet), CGM-derived metrics (green), the study group (light blue), and neonatal outcomes (red) with the primary neonatal outcome NH, highlighted in yellow.
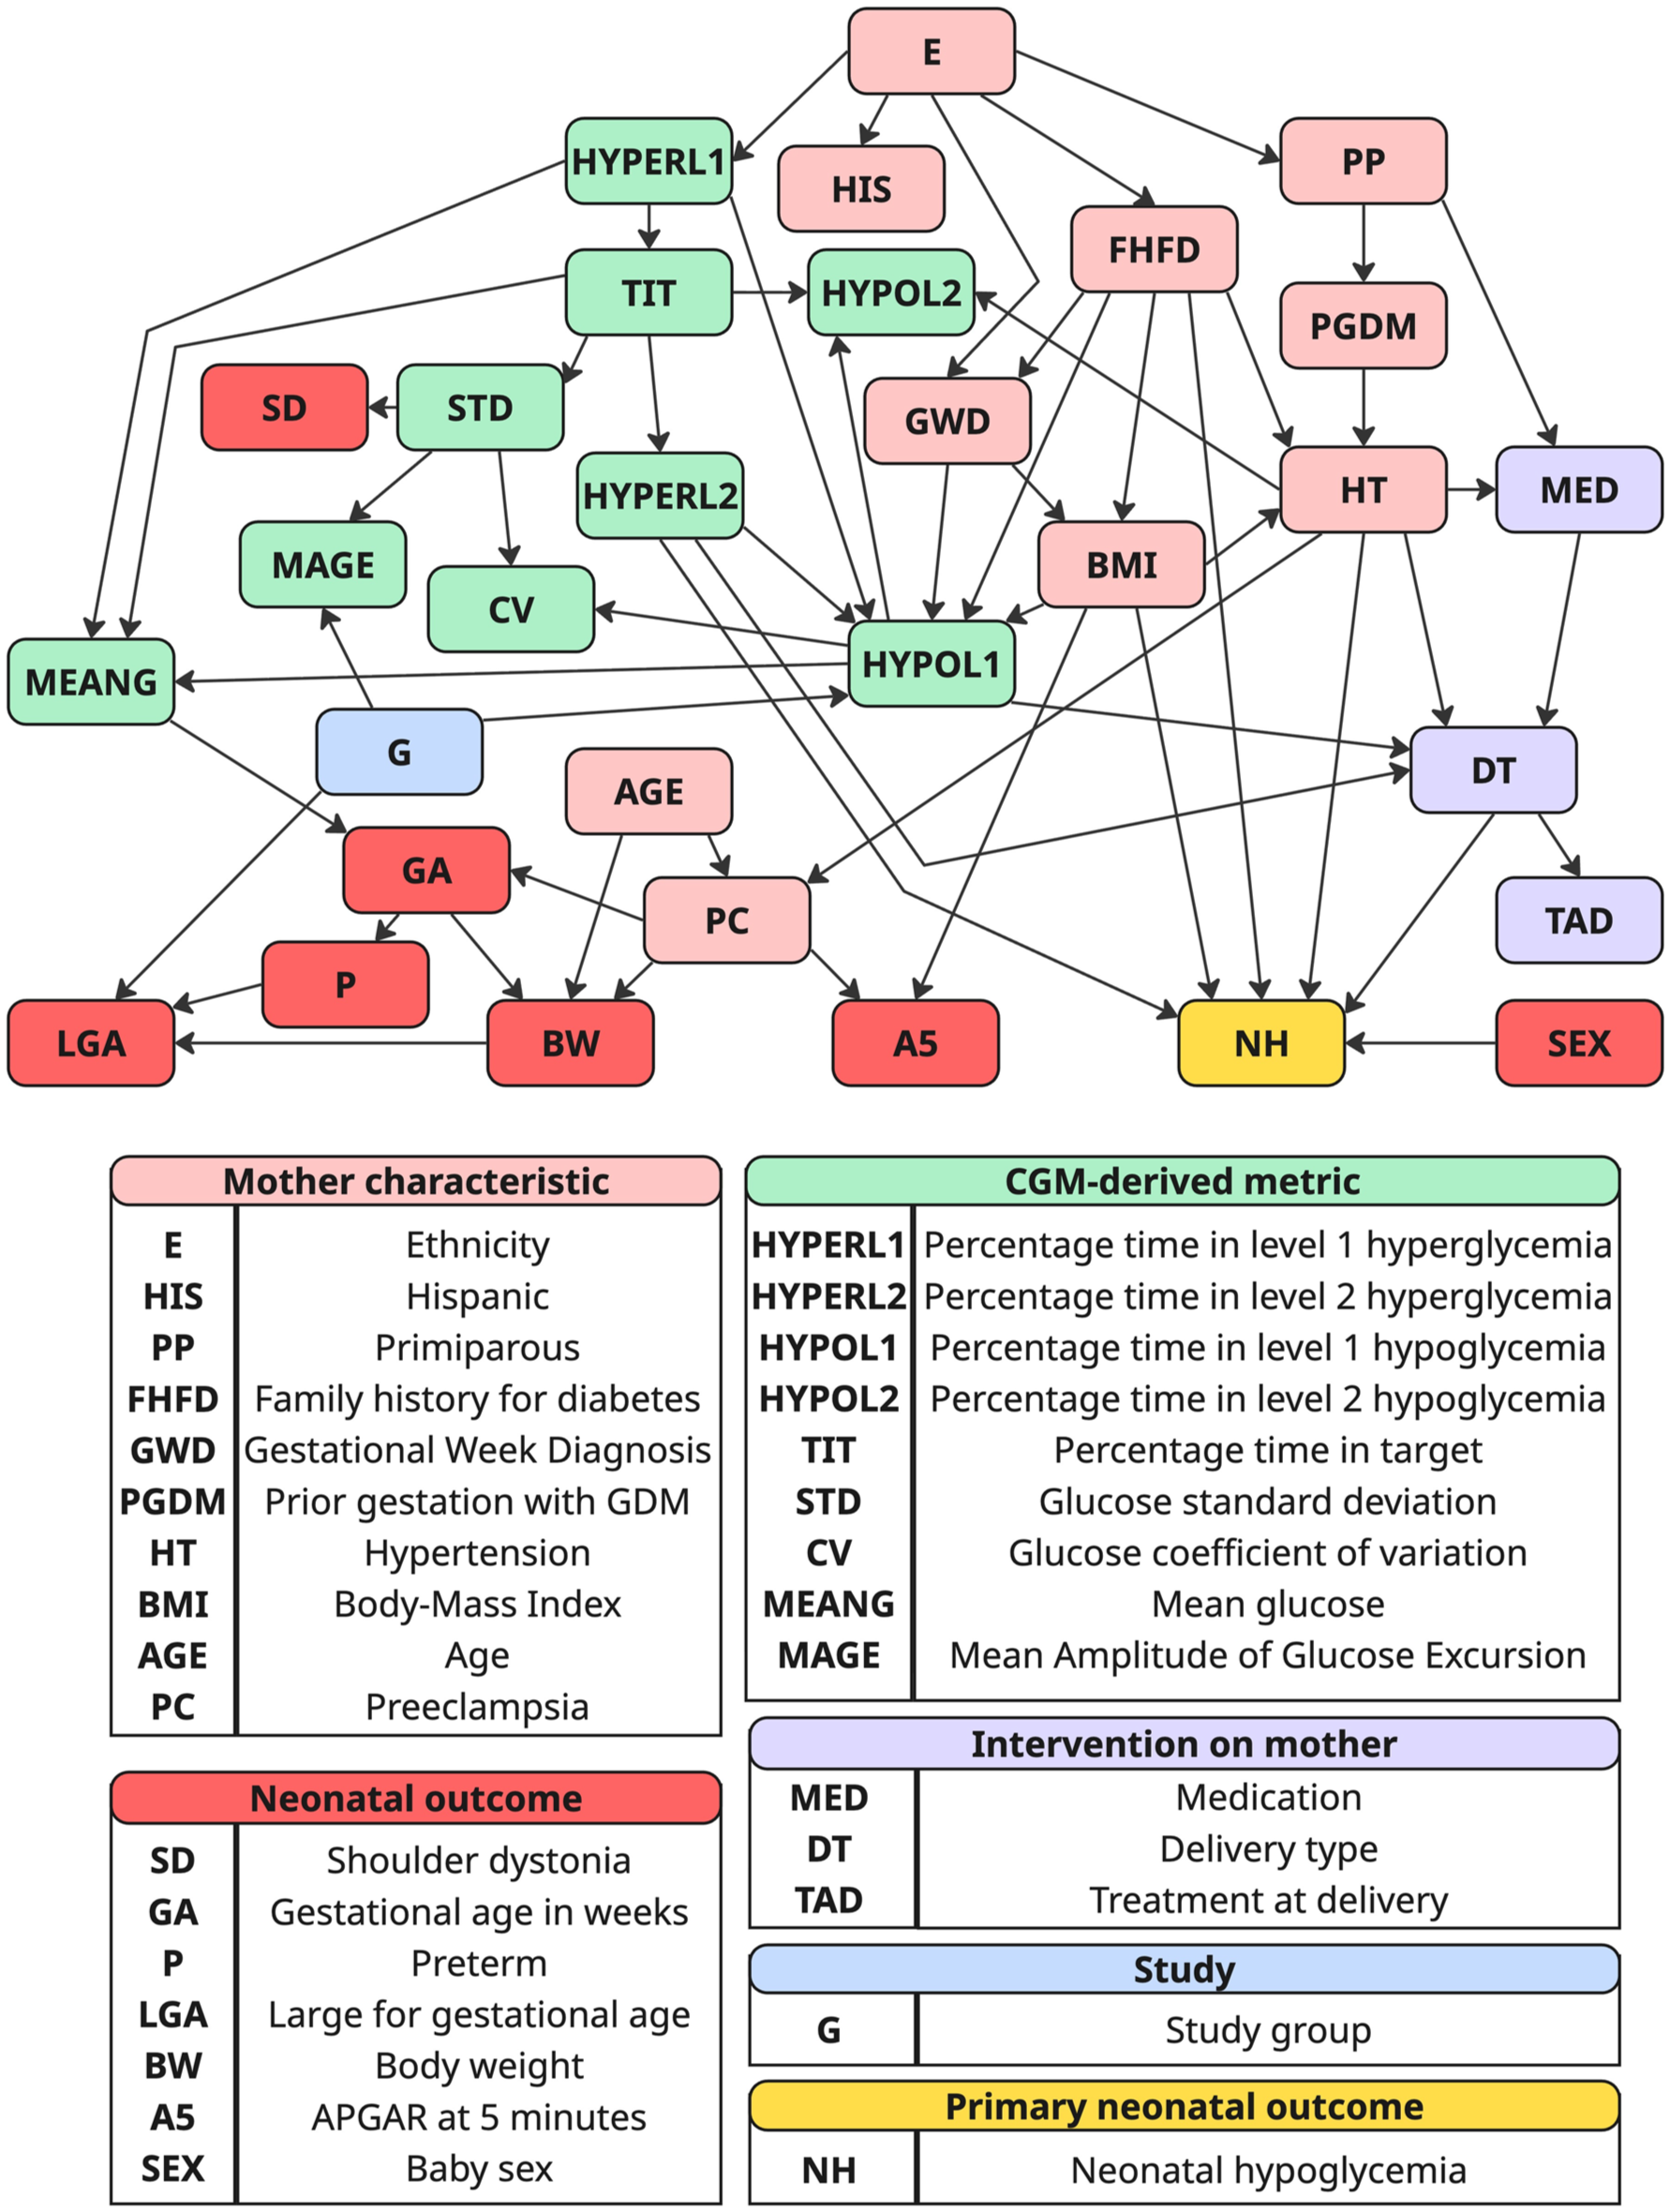
Resulting BN learned from the STEADY SUGAR trial data set (N = 118).
Direct impact on NH
The BN identified several maternal factors directly linked to NH. Hypertension showed a significant association (OR: 2.13 [1.02, 4.46]), supporting current knowledge that hypertensive disorders reflect underlying metabolic dysfunction, which can affect fetal insulin regulation and predispose to NH. Family history for diabetes also showed a direct relationship (OR: 1.43 [0.57, 3.57]), suggesting a possible genetic predisposition to altered fetal glucose metabolism. Lower BMI was linked to significantly lower NH prevalence, with OR of 3.59 (1.42, 9.08] comparing the lowest BMI level, ie, (–Inf, 33.7]) with the highest (ie, (40, Inf)). Similar OR were observed comparing “adjacent” BMI levels (ie, (–Inf, 33.7] vs (33.7, 40] and (33.7, 40] vs (40, Inf)), however, they were not significant: 1.79 (0.73, 4.43) and 2.00 (0.80, 4.99), respectively. These connections are clinically plausible since maternal metabolic conditions and genetic predisposition to diabetes are recognized risk factors for altered fetal glucose metabolism and subsequent NH.
Mode of delivery (DT), particularly cesarean section, was directly associated with NH (OR: 2.05 [0.98, 4.28]). This finding aligns with established evidence that cesarean delivery may disrupt neonatal metabolic adaptation due to lower stress-induced catecholamine surges, predisposing infants to hypoglycemia.
Among CGM-derived metrics, HYPERL2 unexpectedly showed a non-significant inverse association with NH (OR: 0.73 [0.31, 1.71]). This contrasts with existing evidence linking maternal hyperglycemia to fetal hyperinsulinism and increased NH risk. The wide confidence interval and lack of significance likely reflect sample size constraints.
Indirect impact on NH
The BN also uncovered several mediated effects not easily detectable with standard regression approaches. For example, HT and primiparous (PP) indirectly influenced NH via their effect on MED, which in turn affected DT. Women managed with diet alone were significantly less likely to receive pharmacological therapy (OR: 0.19 [0.04, 0.98]) and were less likely to undergo cesarean delivery (OR: 0.07 [0.00, 0.94]) than those managed with combined diet, metformin, and insulin. This pathway is clinically plausible: hypertensive pregnancies often require pharmacologic management, which can influence obstetric decisions and thereby affect neonatal metabolic adaptation.
E indirectly affected NH through glycemic control. Afro-American mothers showed higher odds of elevated HYPERL2 compared with Caucasian mothers (OR: 2.91 [1.19, 7.11]), suggesting potential ethnic disparities in glycemic regulation during pregnancy and highlighting the need to consider ethnicity in individualized risk assessments.
Similarly, HYPOL1 appeared to influence NH indirectly through its effect on delivery mode (OR: 1.90 [0.91, 3.96]), although this was not statistically significant. This trend may reflect that mothers experiencing more frequent hypoglycemia episodes could require closer monitoring or delivery planning, indirectly affecting neonatal outcomes.
CGM-derived metrics
As expected, all CGM-derived metrics (mean glucose—MEANG, glucose variability metrics—STD, CV, MAGE, percentage time spent in various glycemic ranges—TIT, HYPOL1, HYPOL2, HYPERL1, and HYPERL2) demonstrate interconnectedness. In addition, the study group (G) directly influences CGM-derived metrics, aligning with expectations as the intervention and control groups had access through pregnancy to different glucose-related information by study design.
Other neonatal outcomes
Beyond NH, the network revealed meaningful relationships between maternal factors, glycemic metrics, and other neonatal outcomes. Glucose variability measures (STD, CV, and MAGE) were linked to SD, suggesting that unstable maternal glycemia may impair fetal growth patterns and increase delivery complications. As expected, neonatal outcomes (large for gestational age [LGA], preterm [P], baby weight in grams [BW], and gestational age in weeks [GA]) show strong interconnections as they are naturally interrelated as fetal growth influences birth timing and size at delivery. Of note, MEANG directly impacts GA highlighting the importance of maternal glucose levels on pregnancy duration. Obtained OR, even if not significant, indicated that the lower the MEANG, the longer the GA. For example, considering MEANG levels (–Inf, 105.6] vs (114.2, Inf) and GA levels (–Inf, 37.2] vs (38.3, Inf), OR resulted 0.15 (0.04, 0.52).
AGE, PC, and HT exhibit connections to BW indicating that maternal age and hypertensive disorders typically influence fetal growth and birth weight. Interestingly, LGA is directly connected to G (OR: 2.01 [0.60, 6.76]), emphasizing how different glycemic control strategies employed in the study might have influenced fetal growth outcomes. Finally, as expected, PC and maternal BMI directly influence A5, reaffirming established clinical associations between maternal metabolic disorders, hypertensive conditions, and neonatal vitality immediately postpartum. Particularly, significant OR (0.13 [0.03, 0.59]) was obtained between BMI and A5 when considering (–Inf, 33.7] vs (40, Inf) levels indicating higher A5 for lower BMI. Consistently, obtained OR resulted 0.44 (0.13, 1.50) between PC and A5.
Discussion and Conclusion
This study presents a novel application of BNs to model and interpret the complex interdependencies between maternal characteristics, CGM-derived features, and neonatal outcomes, particularly NH, in pregnancies affected by GDM. Leveraging data from the STEADY SUGAR trial, our probabilistic modeling approach enabled both qualitative exploration and quantitative assessment of key clinical relationships.
The learned BN structure revealed several clinically plausible direct associations with NH, including maternal HT, FHFD, and elevated BMI. These findings align with current understanding of GDM pathophysiology, where maternal metabolic dysfunction and genetic predisposition contribute to fetal hyperinsulinism and impaired neonatal glucose regulation. Furthermore, the observed influence of cesarean delivery on NH reflects established clinical concerns around delivery-related stress and metabolic adaptation in neonates. Interestingly, while HYPERL2 was expected to be positively associated with NH, the model yielded a non-significant inverse relationship. This deviation from the literature likely stems from the limited sample size and the coarse discretization required to stabilize network learning.
Indirect pathways elucidated by the BN, such as those linking HT and parity through MED regimen to delivery mode, or ethnicity through CGM-derived hyperglycemia metrics to NH, highlight the strength of this approach in modeling mediated effects that are challenging to capture using traditional regression frameworks. Notably, the elevated odds of HYPERL1 among Afro-American patients underscore the importance of considering ethnic disparities in maternal glycemic control and neonatal risk assessment.
Beyond NH, the BN captured a range of dependencies among other neonatal outcomes. For instance, metrics of glycemic variability were linked to SD, while maternal glucose levels influenced gestational age, as confirmed by the significant ORs observed. In addition, maternal age, preeclampsia, and BMI were found to impact birth weight and APGAR scores at five minutes, reaffirming known clinical associations.
Despite these insights, several limitations must be acknowledged. First, the probabilistic associations derived from the BN reflect conditional dependencies rather than causal relationships. Second, the univariate nature of the OR analysis omits multivariable adjustment, potentially oversimplifying interactions among variables. Third, some relationships lacked statistical significance or yielded wide confidence intervals, which may be attributable to the modest sample size and the discretization of continuous variables.
Future work will aim to address these challenges. Particularly, wider data sets, such as those collected from the glucose level across maternity (GLAM) study 23 will be instrumental to confirm and refine our findings. Indeed, we aim to expand our methodological framework and build on the available literature 24 to run external validations and enhance the robustness and generalizability of our results. This will involve incorporating advanced statistical modeling techniques and machine learning algorithms to better capture the complex relationships within the data. Moreover, we plan to conduct longitudinal analyses to observe trends over time and identify potential causal factors affecting glucose levels during maternity. Collaborative efforts with multidisciplinary teams will be pursued to integrate clinical insights with data-driven approaches, ensuring that our models are both scientifically sound and practically applicable.
In conclusion, our findings support the utility of BNs as a data-driven yet interpretable tool for modeling complex maternal-fetal relationships in GDM. Providing both structural insights and probabilistic quantification, this approach has the potential to enhance risk stratification, inform clinical decision-making, and guide future prospective studies aimed at developing targeted interventions to improve maternal and neonatal health outcomes.
Supplemental Material
sj-docx-1-dst-10.1177_19322968251388107 – Supplemental material for Exploring Relationships Between Maternal Characteristics, Continuous Glucose Monitoring Data, and Neonatal Hypoglycemia in Gestational Diabetes Pregnancies Using Probabilistic Modeling
Supplemental material, sj-docx-1-dst-10.1177_19322968251388107 for Exploring Relationships Between Maternal Characteristics, Continuous Glucose Monitoring Data, and Neonatal Hypoglycemia in Gestational Diabetes Pregnancies Using Probabilistic Modeling by Giacomo Cappon, Marco Catanuso, Erica Tavazzi, Karen Elkind-Hirsch and Andrea Facchinetti in Journal of Diabetes Science and Technology
Footnotes
Acknowledgements
The authors wish to thank all the staff of the Woman’s Hospital of Baton Rouge Diabetes Center and Maternal Fetal Medicine Department for their unrelenting efforts in patient care and assistance with this trial. They also thank the participants without whom this study and these analyses would not have been possible.
Abbreviations
A5, APGAR at five minutes; AGE, mother’s age; BIC, Bayesian information criterion; BMI, body-mass index; BN, Bayesian network; BW, baby weight in grams; CGM, continuous glucose monitoring; CI, confidence interval; CPT, conditional probability table; CV, coefficient of variation; DAG, directed acyclic graph; DT, delivery type; E, ethnicity; FHFD, family history for diabetes; G, study group; GA, gestational age in weeks; GDM, gestational diabetes mellitus; HC, Hill Climbing; HT, hypertension; HYPERL1, percentage time in level 1 hyperglycemia; HYPERL2, percentage time in level 2 hyperglycemia; HYPOL1, percentage time in level 1 hypoglycemia; HYPOL2, percentage time in level 2 hypoglycemia; LGA, large for gestational age; MAGE, mean amplitude of glycemic excursions; MEANG, mean glucose; MED, medication; NH, neonatal hypoglycemia; OR, odds ratio; P, preterm; PC, preeclampsia; PGDM, prior gestation with GDM; PP, primiparous; PR-AUC, precision-recall area under the curve; SD, shoulder dystonia; SEX, baby sex; SMBG, self-monitoring blood glucose; STD, standard deviation; T2D, type 2 diabetes; TIT, percentage time in target.
Declaration of Conflicting Interests
The authors declared the following potential conflicts of interest with respect to the research, authorship, and/or publication of this article: GC, MC, ET, and AF have no conflict of interest to disclose. KHH reports receiving grant support from Dexcom, Inc and Novo Nordisk, serves as a consultant for Dexcom, Inc, and has served on an advisory board for Lilly and NovoNordisk.
Funding
The authors received no financial support for the research, authorship, and/or publication of this article.
Supplemental Material
Supplemental material for this article is available online.
References
Supplementary Material
Please find the following supplemental material available below.
For Open Access articles published under a Creative Commons License, all supplemental material carries the same license as the article it is associated with.
For non-Open Access articles published, all supplemental material carries a non-exclusive license, and permission requests for re-use of supplemental material or any part of supplemental material shall be sent directly to the copyright owner as specified in the copyright notice associated with the article.