
Abstract
Background:
Hybrid closed-loop (HCL) therapy helps reaching efficacy and safety glucose targets (ESGT+) in persons with type 1 diabetes (PwT1D). We analyzed here the glycemia risk index (GRI) in PwT1D at HCL initiation (M0) and at 12 months (M12) and determined whether M0GRI value and/or M0GRI zone (A-B-C-D-E) could identify people reaching M12ESGT+.
Methods:
This was a retrospective study. Consecutive PwT1D who started HCL in a CIRDIA center were included after written consent. Glucose parameters were manually extracted from platforms at M0 and M12. ESGT+ meant reaching time in range (TIR) > 70% and glucose management indicator < 7% and time below range (TBR)<70 < 4% and TBR<54< 1%. Glycemia risk index was calculated and receiver-operating characteristic (ROC) analyses were performed to study the relation between M0GRI and M12ESGT+/M12ESGT–.
Results:
M12 data were available for 128 PwT1D. M0GRI predicted M12ESGT mostly for low and high M0GRI values. An M0GRI < 41 had a 90% specificity, a 36% sensitivity, and a 74% positive predictive value for M12ESGT+. Sensitivity increased to 80% but specificity dropped to 56% for M0GRI < 61 and M0GRI ≥ 61 had a 78% negative predictive value. All PwT1D with M0GRI 0 to 20 (zone A) reached M12ESGT+. Then, the percentage of M12ESGT+ people dropped about 25% per M0GRI zone (A-B-C-D) and to 11% for zone E.
Conclusions:
M0GRI was significantly associated with M12ESGT status but mostly when in zones A-B or D-E. Hybrid closed-loop training should focus on PwT1D with M0GRI ≥ 41 (90% of M12ESGT– persons), but reaching M12ESGT+ is possible with M0GRI in zones C-D-E (64% of M12ESGT+ persons) and even D-E (20% of M12ESGT+ persons).
Introduction
The glycemia risk index (GRI) is a new glucose parameter providing information on the hypoglycemia and hyperglycemia risk for insulin-treated people using continuous glucose monitoring (CGM). The GRI gives more weight to hypoglycemia and to extreme glucose values, either < 54 or > 250 mg/dL. Glycemia risk index can be expressed either as a single number ranging from 0 (= minimal risk) to 100 (= maximal risk) or as a dot on a GRI grid displaying both the hypoglycemia and hyperglycemia components of the GRI. 1 The GRI grid was originally divided into five zones stratifying the hypo/hyperglycemia risk from the lowest (zone A: 0-20) to the highest (zone E: 81-100).
It was shown that GRI can detect hypoglycemia/hyperglycemia risk much better than usual glucose parameters, such as glycated hemoglobin (HbA1c): Oriot et al 2 observed among 216 persons with type 1 diabetes (PwT1D) and a mean HbA1c level at 6.6 ± 0.3%, that 39% had actually a GRI ≥ 41 and were classified in high-risk GRI zones C, D, or E. Besides, in 2019, an international consensus 3 defined ambulatory glucose profile (AGP) targets in PwT1D, including time in range (TIR) (70-180 mg/dL) > 70%, glucose management indicator (GMI) <7%, time below range (TBR) < 70 mg/dL (TBR<70) < 4% and TBR<54 (< 54 mg/dL) < 1%. We have previously looked at combined efficacy and safety glucose targets (ESGT = TIR>70% and GMI <7% and TBR<70 <4% and TBR<54 <1%) before and after hybrid closed-loop (HCL) initiation and we have shown 4 that a GRI threshold <26 has a high specificity (92%) and a very good negative predictive value (93%) to identify PwT1D reaching ESGT (ESGT+), suggesting that if the GRI value was automatically calculated on CGM platforms, a GRI value at or above 26 could easily target PwT1D who need further assistance to reach ESGT.
Nevertheless, there is no published data on the accuracy of the baseline GRI to predict full success (ESGT+) one year after initiation of an HCL system. In this study, we aimed to determine whether the GRI value at HCL initiation could help predicting who, among PwT1D, is going to reach ESGT+ one year later.
Methods
This was a rolling retrospective study conducted in the CIRDIA (“Inter-Regional Center for Automatized Insulin in Diabetes”), a multisite (n = 7 at the time of the study) out-of-hospital HCL initiation center. The CIRDIA setting was previously described 4 : it involves highly trained diabetologists, mostly in private practice, who had completed a university degree on HCL systems, and the structure is based on the French-speaking Diabetes Society (SFD) recommendations. 5 Dedicated CIRDIA education material was given to each patient.
Consecutive non-pregnant adult PwT1D who had a first HCL initiation in a CIRDIA site between May 1, 2023 and March 31, 2024 were included after they had signed an informed consent. No ethic committee approval was necessary, as it was a retrospective study on an ongoing basis. AGP metrics for the 14 previous days were manually extracted from HCL platforms at HCL initiation (M0) and 12 ± 1 months later (M12), and we calculated for both timepoints (M0 and M12), the percentage of PwT1D reaching TIR > 70%, GMI < 7%, TBR<70 < 4%, TBR<54 < 1% and the combined criteria (ESGT+). The GRI value was calculated using an online electronic calculator 6 for each patient at M0 and M12, and GRI grids were edited with a GRI zone allocation for each participant at both timepoints.
No difference was made between HCL systems, noting that at the time of the study, only three systems were available and reimbursed in France: Medtronic 780G with G4 sensors (“780G”), Control-IQ with Tandem TSlimX2 pump and Dexcom G6 sensors (“CIQ”), CamAPS with Ypsopump (Ypsomed) and Dexcom G6 sensors (“CamAPS”).
Statistical analyses were performed using GraphPad Prism 10, GraphPad Software, LLC. Results are expressed as mean ± standard deviation (SD) or numbers (percentages). Results across time periods were compared using Mann-Whitney (unpaired data) or Wilcoxon tests (paired data). Spearman’s correlation coefficient (rs (95% confidence interval [CI]) was determined to correlate the GRI value at M0 (M0GRI) to the GRI value at M12 (M12GRI). Receiver–operating characteristic (ROC) analyses were used to determine the sensitivity, the specificity, and the area under the curve (AUC) of M0 GRI values to predict the percentage (95% CI) of participants reaching ESGT+ at M12 (M12ESGT+). A P-value < .05 was considered as significant.
Results
Between May 1, 2023 and March 31, 2024, 145 PwT1D had HCL initiation in a CIRDIA center. Twelve-month (M12) data were available for 128 PwT1D noting that 56% of the participants were included in one single center and 80% in three of the seven CIRDIA centers. Because of French regulations, all the participants had to be on insulin pump therapy for at least six months (9.2 ± 5.5 years) at the time of HCL initiation and all of them were using CGM. Twelve patients (9.4%) had been using a low glucose suspend system for more than three months at M0. The distribution of HCL systems was: 780G (77.3%), CIQ (13.3%), and CamAPS (9.4%).
At M12, the mean TIR significantly improved compared with M0 (from 52.9 ± 16.0% to 72.7 ± 11.6%; P < .0001), the TBR<70 decreased (from 3.0 ± 3.1% to 2.0 ± 1.8%; P = .001) while the TBR<54 did not change significantly (from 0.4 ± 0.8% to 0.3 ± 0.7%). Overall, 56 participants (44%) reached ESGT+ criteria at M12 (vs eight participants = 6% at M0). The mean GRI value dropped from 56.4 ± 21.0 at M0 to 30.1 ± 14.1 at M12 (P < .0001) with a decrease in both the hypoglycemic component (from 2.5 ± 2.6 to 1.7 ± 1.6; P = 0.02) and the hyperglycemic component (from 30.7 ± 14.7 to 15.7 ± 8.7; P < .0001). Noteworthily, between M0 and M12, the GRI hyperglycemic component improved in 91% of the participants, whereas the GRI hypoglycemic component improved only in 49% of the patients. Table 1 shows the characteristics of participants at HCL initiation (M0) for the entire population and according to whether or not they reached ESGT criteria at M12 (M12ESGT+ or M12ESGT–).
Characteristics of the Population at Hybrid Closed-Loop Initiation (M0) According to Efficacy and Safety Glucose Targets (ESGT) Status at 12 Months (M12).
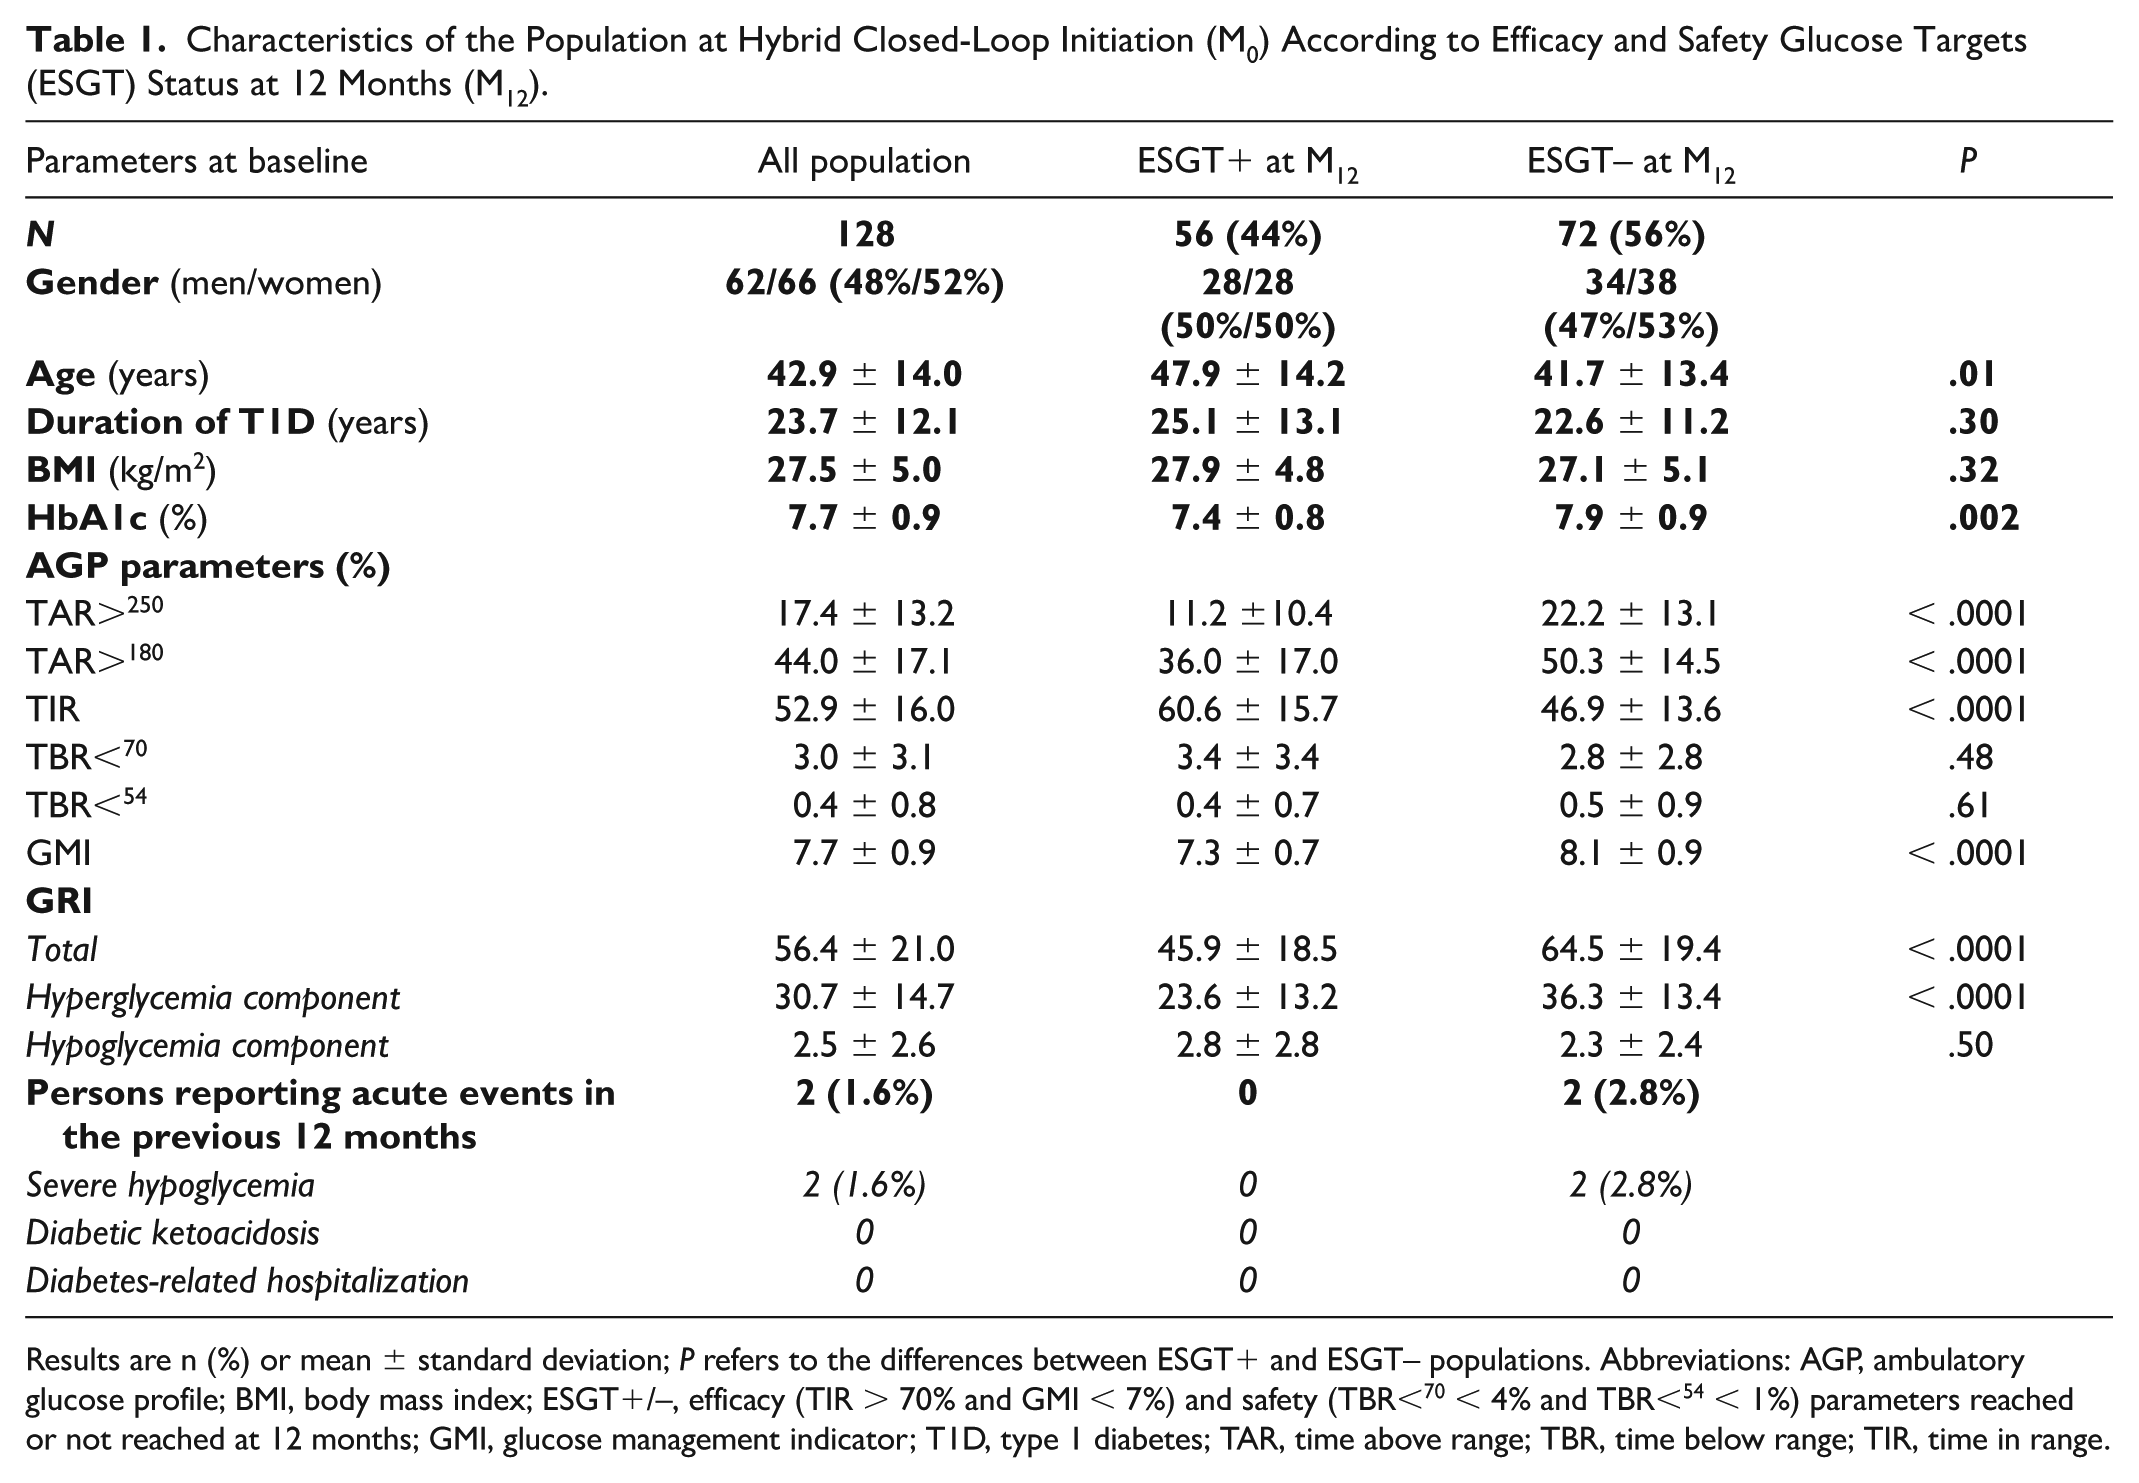
Results are n (%) or mean ± standard deviation; P refers to the differences between ESGT+ and ESGT– populations. Abbreviations: AGP, ambulatory glucose profile; BMI, body mass index; ESGT+/–, efficacy (TIR > 70% and GMI < 7%) and safety (TBR<70 < 4% and TBR<54 < 1%) parameters reached or not reached at 12 months; GMI, glucose management indicator; T1D, type 1 diabetes; TAR, time above range; TBR, time below range; TIR, time in range.
M12ESGT+ patients were older and had a lower baseline HbA1c level, a lower GMI and a higher TIR at M0 than M12ESGT– patients. However, the times in hypoglycemia (TBR<70 and TBR<54) were similar in both groups, just like the M0GRI hypoglycemia component: M12ESGT+ participants had a lower M0GRI value mainly due to a lower hyperglycemia component. Figure 1 shows the individual distribution of the GRI level (Figure 1a) and of its hypoglycemia (Figure 1b) and hyperglycemia components (Figure 1c).
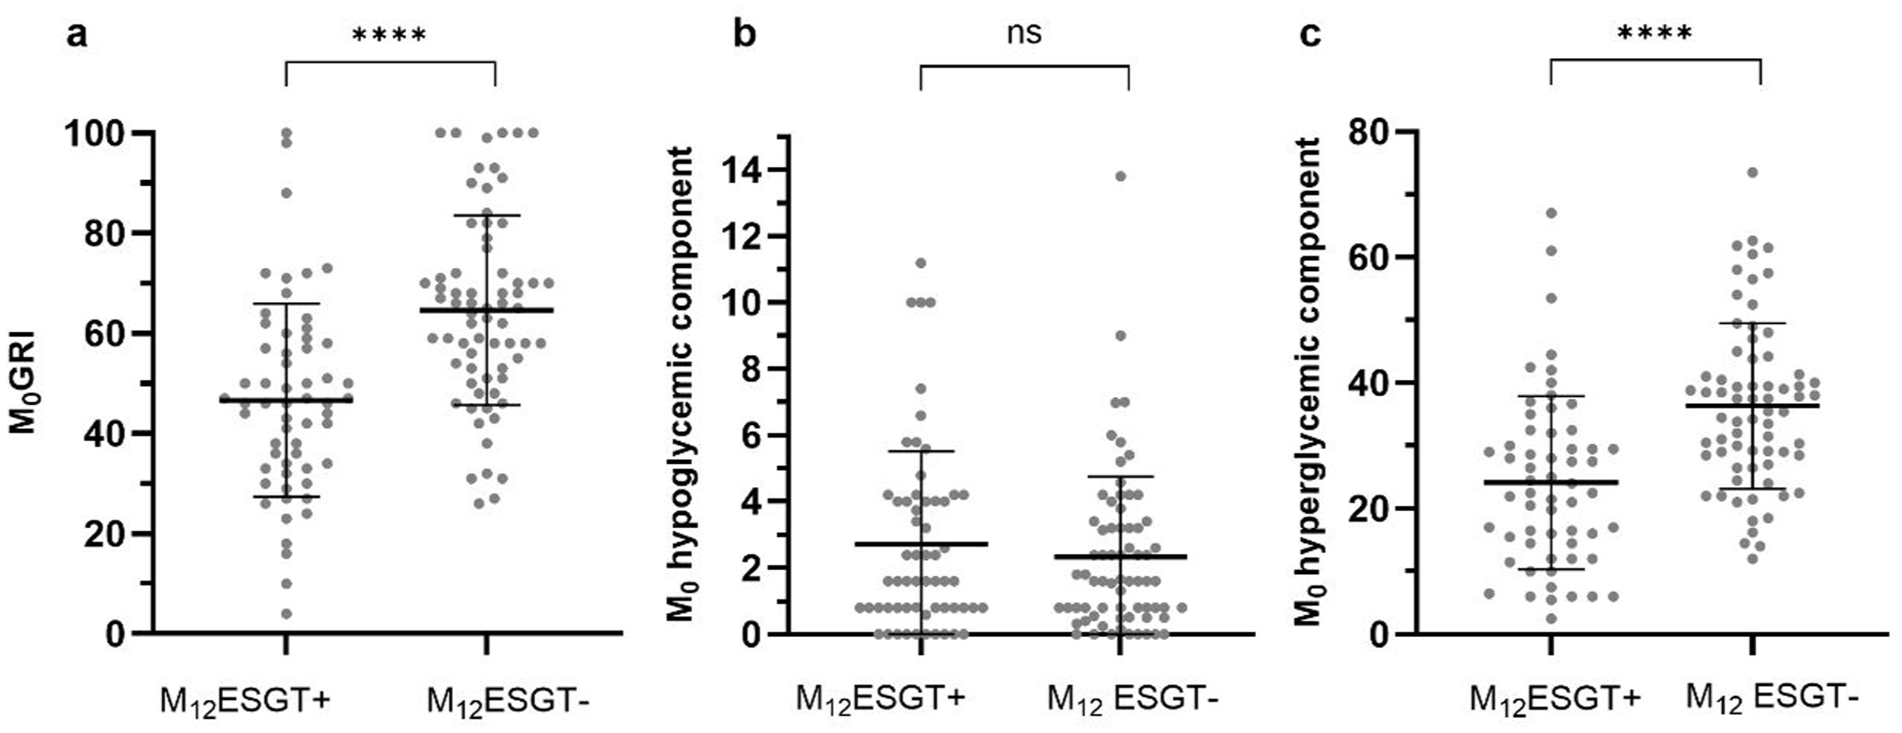
Individual distribution of GRI level (a), GRI hypoglycemia component (b), GRI hyperglycemia (c) component in M12ESGT+/M12ESGT– participants.
The total insulin dose significantly increased between M0 and M12 in the total population and in both the ESGT+ population and the ESGT– population as the bolus dose increased, whereas the basal dose did not change significantly (Supplementary Table 1). However, there was no difference in the total, basal or bolus daily dose between ESGT+ and ESGT– participants neither at M0 nor at M12. Furthermore, there was no difference in the number of daily manual boluses or in the time spent on HCL between ESGT+ and ESGT– patients at M12.
We tested the correlation between M0GRI and M12GRI (Figure 2a). The Spearman correlation coefficient rs was 0.57 (0.44-0.68), P < .0001, with rs2 = 0.32 meaning that M12GRI was correlated with M0GRI but that only 32% of the variance in M12GRI could be explained by the variation in M0GRI. Figure 2b shows the ROC analysis of M0GRI to predict M12ESGT+. No difference was observed between the AUC of M0GRI (0.7579) and the AUC of M0TIR (0.7423), M0GMI (0.7679), or M0TAR>180 (0.7340).
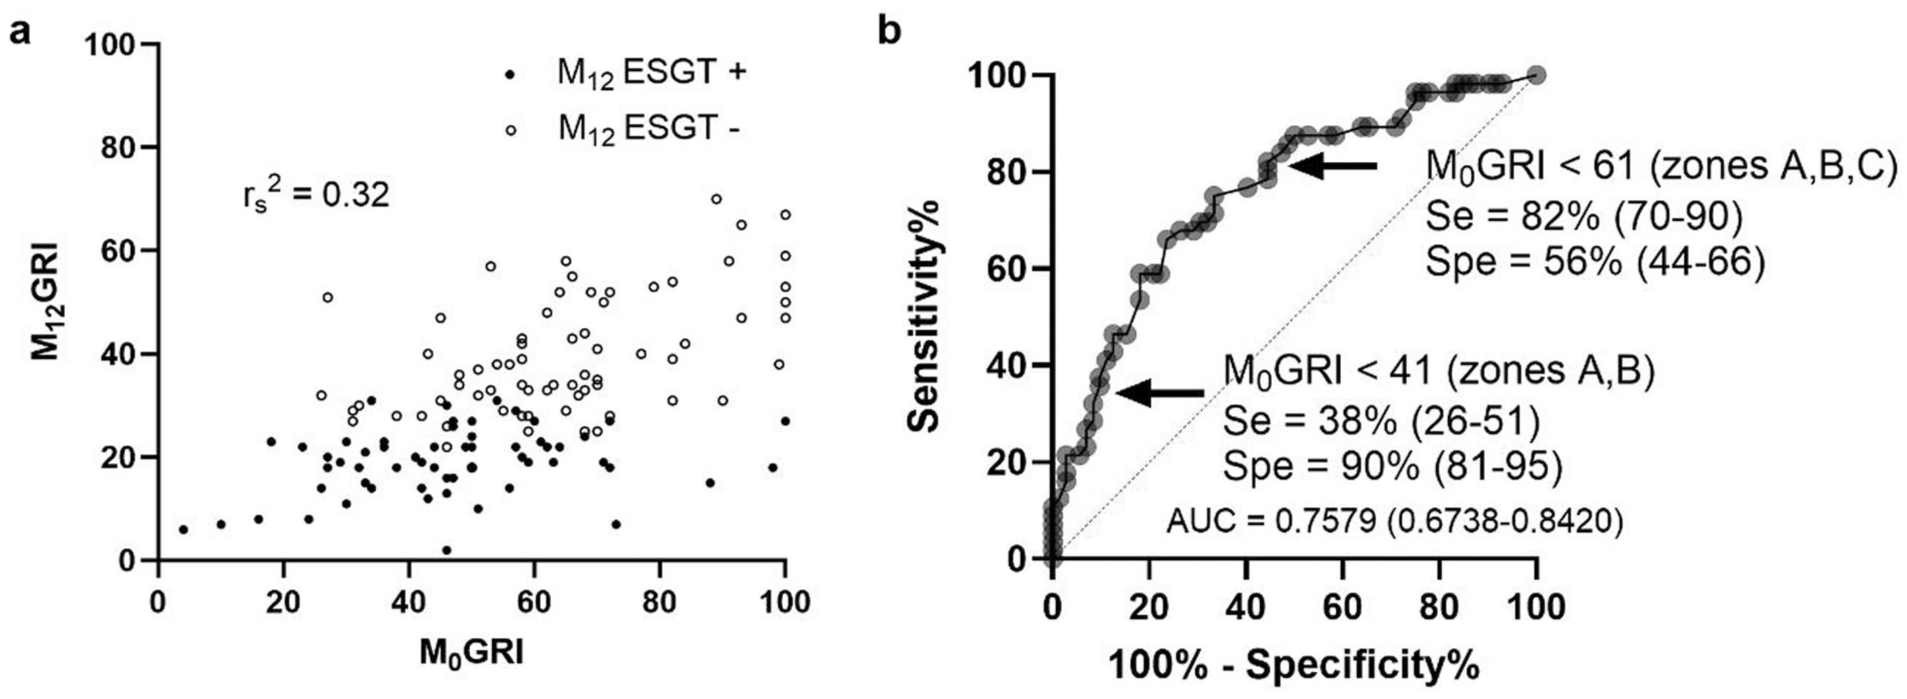
M0GRI and M12GRI correlation (a) and ROC curve of M0GRI for reaching efficacy and safety glucose targets (ESGT+) at 12 months (M12) (b).
We also looked at the delta-GRI (M12GRI-M0GRI) and at the delta-TIR (M12TIR-M0TIR) that were tightly correlated (Supplementary Figure 1) (P < .0001) but there was no difference in the delta-GRI or in the delta-TIR according to the M12ESGT status (Supplementary Table 2).
Then, we assessed the performance of M0GRI zones to predict M12ESGT (Table 2). We found that an M0GRI < 41 (GRI zones A+B) had a high specificity to identify people who reached M12ESGT+ since 90% (65 of 72) of M12ESGT– patients had an M0GRI value ≥ 41, but a low sensitivity since only 36% (20 of 56) of M12ESGT+ participants had an M0GRI < 41.
Number of Participants Reaching Efficacy and Safety Glucose Targets (ESGT) at 12 Months (M12) According to the Baseline Glycemia Risk Index (GRI) Zone at Closed-Loop Initiation (M0) and M0GRI Zone According to the M12 ESGT Status.
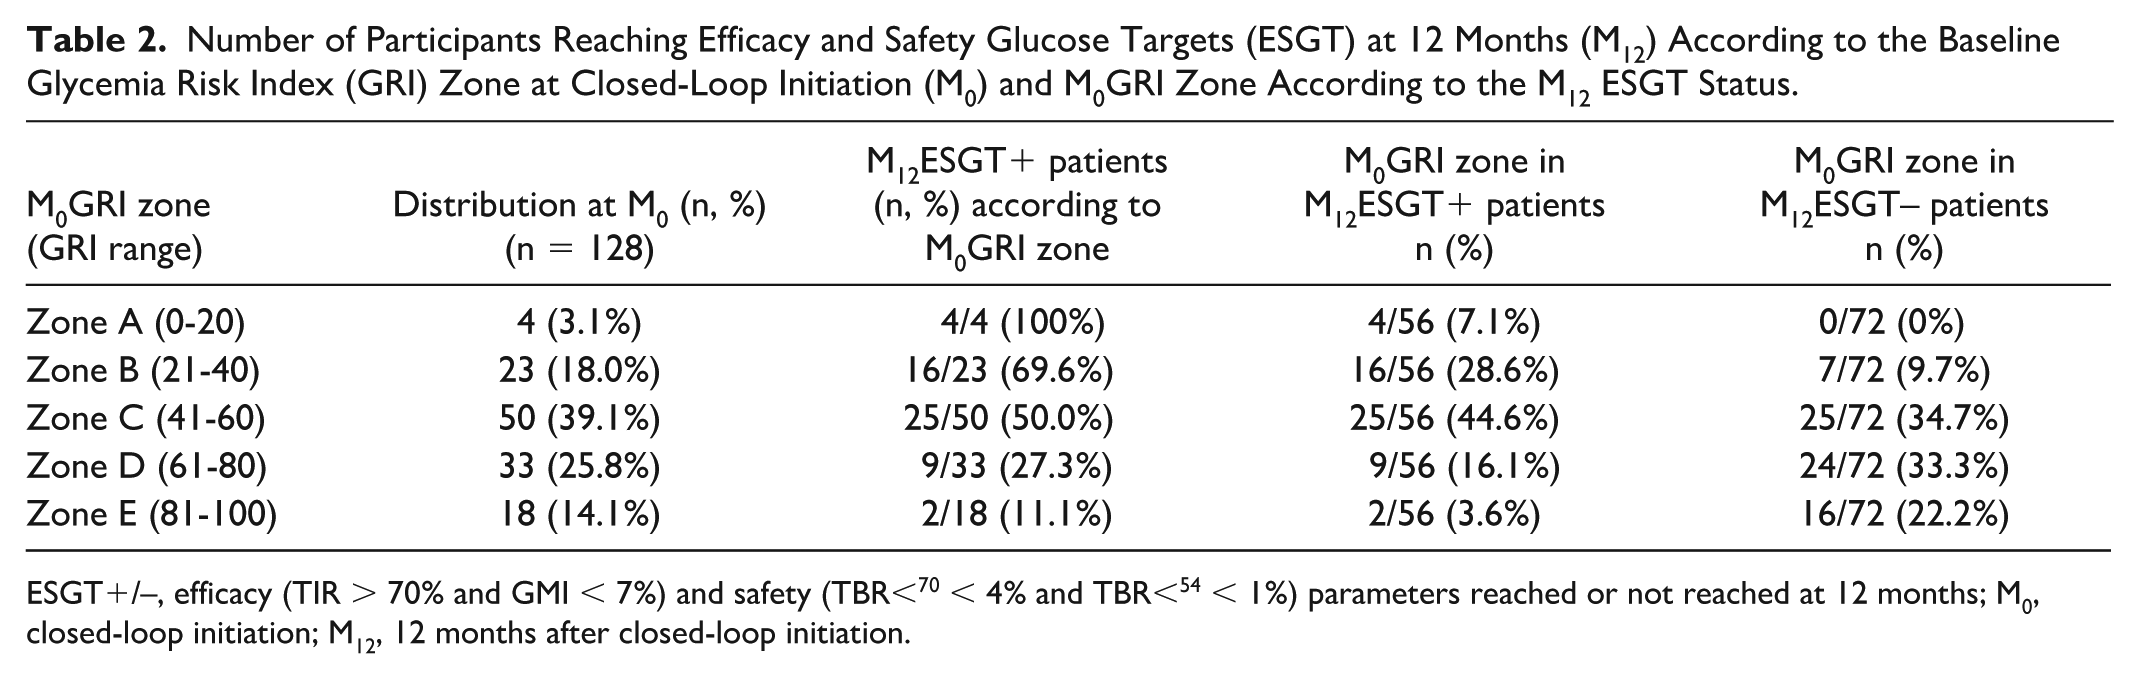
ESGT+/–, efficacy (TIR > 70% and GMI < 7%) and safety (TBR<70 < 4% and TBR<54 < 1%) parameters reached or not reached at 12 months; M0, closed-loop initiation; M12, 12 months after closed-loop initiation.
However, when we considered the three lower GRI zones (A+B+C, M0GRI < 61), the sensitivity improved to 80% (45 of 56) but the specificity dropped to 56% (40 of 72). Figure 3 represents the M0GRI grids according to the M12ESGT status with the distribution of patients in each zone indicated in percentage.
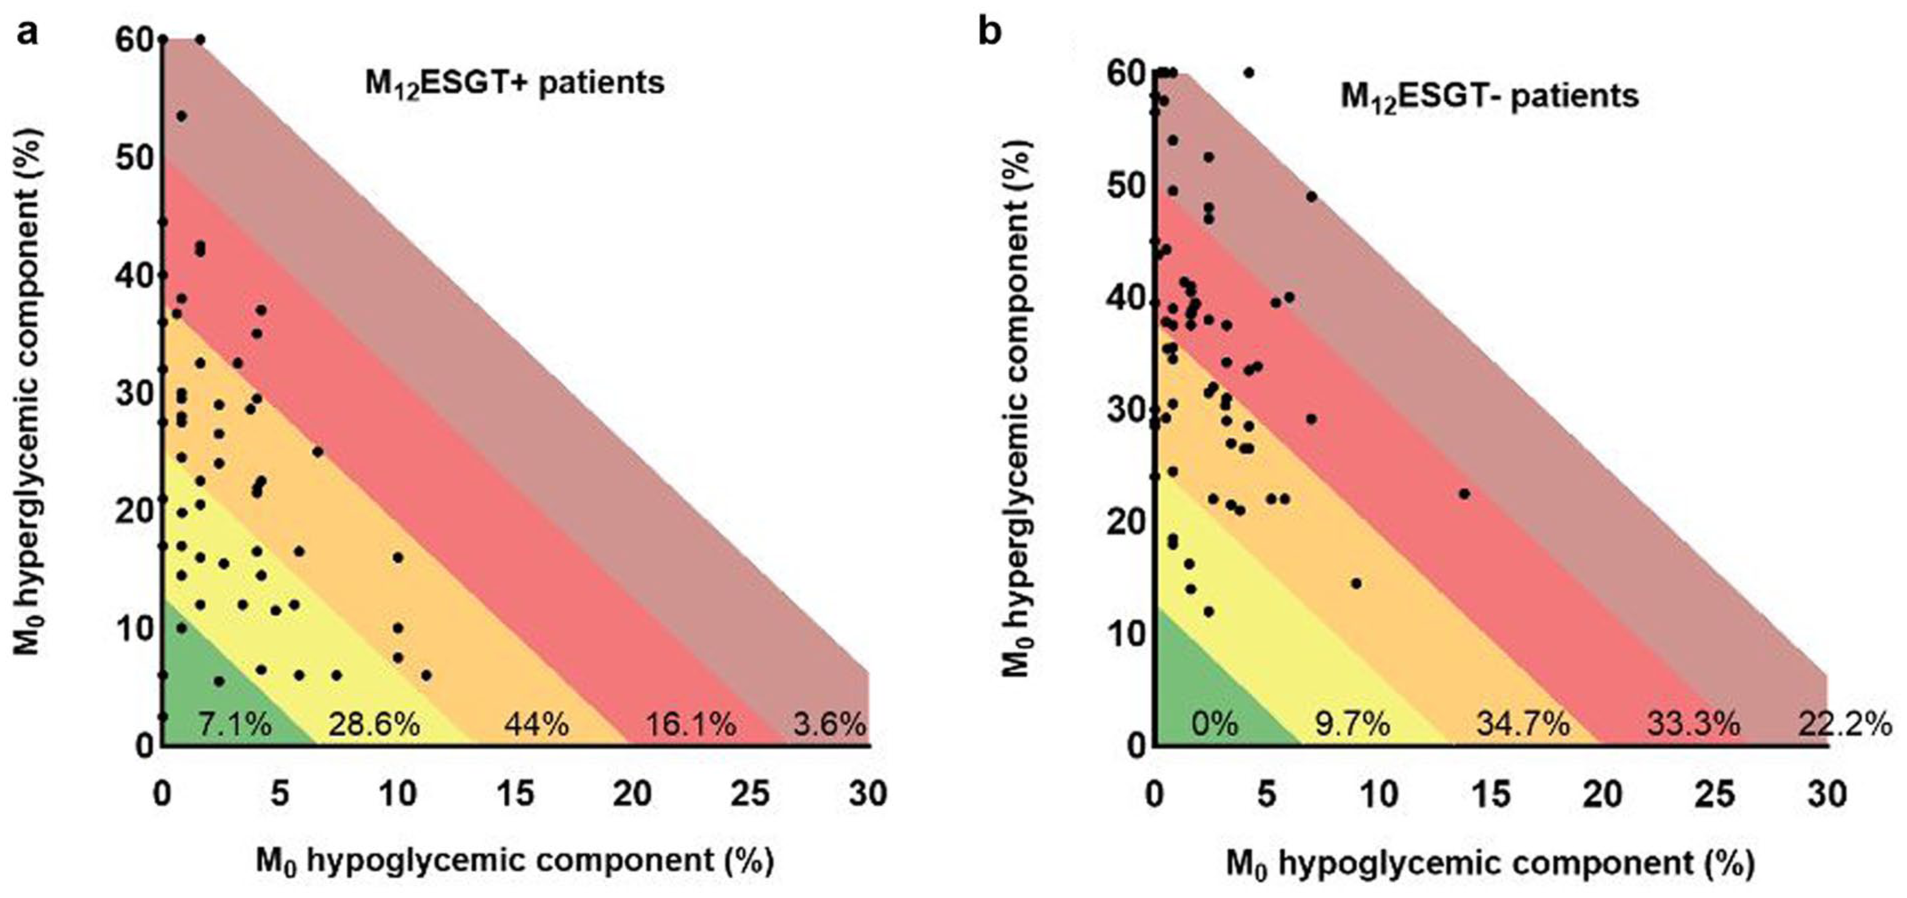
M0GRI grids in patients reaching (ESGT+) or not reaching (ESGT–) efficacy and safety glucose targets at M12.
When we considered patients in zones A and B (GRI < 41) at M0 (n = 27, 21.1%), 20 of 27 (74%) reached ESGT+ at M12 (= positive predictive value). Conversely, for patients in zones D and E (GRI ≥ 61) at M0 (n = 51, 40%), 40 of 51 (78%) did not reach M12ESGT (= negative predictive value). However, when we selected patients in GRI zone C with M0GRI between 41 and 60 (39.1% of the whole population), 50% of them reached M12ESGT+. No difference could be found between ESGT+ and ESGT– patients in zone C at M0 (hypoglycemia or hyperglycemia component, TIR, GMI).
Discussion
The goal of this study was to determine whether baseline GRI could predict full success in reaching AGP efficacy and safety targets (TIR > 70% + GMI < 7% + TBR<70 < 4% + TBR<54 < 1%) one year after HCL initiation. We found that M0GRI was significantly associated with M12ESGT status but mostly for patients with baseline low GRI (zones A and B) or high GRI (zones D and E).
Our population had baseline characteristics that were comparable with the population using sensor unintegrated insulin pump therapy (n = 504) in the real-world study by Nørgaard et al 7 who reported a mean TIR at 54.9% (vs 52.9% in our study) and a GRI at 55 (vs 56.4 in our study). And 1-year after HCL initiation, the AGP parameters in our population were very similar to the results reported by Choudhary et al 8 in 101 629 users of the 780G system for 12 months: in this very large population, the mean TIR was 72.3% (vs 72.7% in our study) and 47.7% participants reached ESGT+ (vs 44% in our study with the same definition of ESGT+). The GRI value was not calculated in Choudhary’s study, but other studies in adults reported GRI levels on HCL therapy at 28.2, 9 28.6, 10 or 31, 7 that were very similar to our results (30.1 at M12).
The GRI was initially created to report both the hypoglycemia and the hyperglycemia risks with one number. 1 The GRI formula was derived from the ranking of 225 CGM tracings by 330 highly experienced clinicians. Their analysis revealed that clinicians gave importance to both hyperglycemia and hypoglycemia and that GRI correlated better with clinicians’ opinions than did TIR, TBR or combined TIR and TBR, meaning that using GRI is preferable to using TIR especially in patients at high risk of hypoglycemia as the TIR is very weakly correlated with hypoglycemia. 11
Nevertheless, we found that M0GRI was not better than M0TIR to identify the PwT1D who reached ESGT+ at M12. Furthermore, we did not observe any difference neither in the delta-GRI (M12-M0 GRI) nor in the delta-TIR (M12-M0 TIR) between the M12ESGT+ and the M12ESGT– participants. In our study, at baseline, all patients had been for more than six months under pump therapy and CGM, with a rather low hypoglycemic component (2.5 ± 2.6) that still improved after HCL (to 1.7 ± 1.6). The TBR<70 and TBR<54 targets were reached by, respectively, 83% and 84% of the participants at M12 (data not shown) and the time in hypoglycemia was not the main reason why most of the participants did not reach ESGT+ at M12. As a matter of fact, in our study, the GRI hypoglycemia component was not different at baseline between M12ESGT+ and M12ESGT– participants. This may explain why we could not find a superiority of M0GRI compared with M0TIR to predict full success in reaching ESGT+ one year after HCL initiation.
In addition to baseline GRI, other factors do play a role in the prediction of M12ESGT+. We should probably consider the performance and/or the settings of the HCL system, the insulin formulation, 12 the time spent using the system, the number of meal boluses, 13 the reinforcement of education by a highly trained team, 5 the decrease in diabetes distress even if it remains present when using an HCL system. 14 However, in our population, no difference was observed between M12ESGT+ and M12ESGT– participants regarding insulin dose, time spent on HCL or the number of manual daily boluses. Furthermore, the potential lower accuracy of CGM systems in hypoglycemia ranges is one of the limiting factors for using GRI in clinical practice. 15
Our study has some limitations as for most of the participants, the glucose sensor was not the same at M0 and M12. This could have been a problem as performances of sensors were shown to differ. 16 Nevertheless, difference could have been present both in over- or under estimation of glucose values and it was a real-life study. Furthermore, it could be argued that our GRI calculation was based on only 14-day AGP measurements; however, this was shown to be the ideal sampling duration for GRI estimation. 17 We also analyzed therapeutic success at three months (M3) and six months (M6) after HCL initiation and observed that the M12 ESGT status was already present in 87% of the participants at M3 and in 89% of the participants at M6 (data not shown). This suggests that M12 ESGT status evaluated on a 14-day AGP measurement is a reliable timepoint to assess therapeutic success even if longer-term studies would be very informative. Finally, we cannot exclude differences in patients’ training between centers, but all the patients received the same dedicated education material, and this was a real-life study.
Conclusions
Our study is the first real-life study reporting the predictive value of baseline GRI to identify PwT1D reaching the combined ESGT one year after HCL initiation. The rate of people reaching M12ESGT+ was 100% in GRI zone A and dropped about 25% per GRI zone increment from zone A to D and then to 11% in zone E. If training should focus on PwT1D in GRI zones C-D-E because they represent 90% of those who did not reach M12ESGT+, motivation should remain intact because reaching M12ESGT+ is possible even when M0GRI is in zones C-D-E (64% of those who reached M12ESGT+) and even in GRI zones D-E (20% of those who reached M12ESGT+).
However, M0GRI value was not superior to other AGP parameters, such as TIR or GMI, to predict full success in reaching ESGT+ after one year, mainly because TBR<70 and TBR<54 were already low at baseline in our population. Further studies on larger populations will be required to confirm these data but, in the meantime, it would be advisable for platform editors to program the display of GRI value and GRI zone, as it would allow an easy follow-up of improvement.
Supplemental Material
sj-docx-1-dst-10.1177_19322968251380291 – Supplemental material for Use of the Glycemia Risk Index at Hybrid Closed-Loop Initiation to Predict Combined International Glucose Targets at 12 Months: Results From the CIRDIA Study Group
Supplemental material, sj-docx-1-dst-10.1177_19322968251380291 for Use of the Glycemia Risk Index at Hybrid Closed-Loop Initiation to Predict Combined International Glucose Targets at 12 Months: Results From the CIRDIA Study Group by Sylvie Picard, Joëlle Dupont, Fabienne Amiot-Chapoutot, Blandine Courbebaisse, Estelle Personeni, Emmanuelle Lecornet-Sokol, François Mougel, Clara Bouché, Françoise Giroud, Sandrine Lablanche and Sophie Borot in Journal of Diabetes Science and Technology
Footnotes
Abbreviations
AGP, ambulatory glucose profile; AUC, area under the curve; CGM, continuous glucose monitoring; CI, confidence interval; CIRDIA, inter-regional center for automatized insulin in diabetes; ESGT, efficacy and safety glucose targets; GMI, glucose management indicator; GRI, glycemia risk index; HbA1c, glycated hemoglobin; HCL, hybrid closed loop; M0, month 0 = baseline; M12, month 12; PwT1D, persons with type 1 diabetes; ROC, receiver operating characteristic; SFD, French-speaking Diabetes Society; TAR, time above range; TBR, time below range; TIR, time in range.
Declaration of Conflicting Interests
The authors declared the following potential conflicts of interest with respect to the research, authorship, and/or publication of this article: None directly related to this paper. Outside of this work, SP has received consulting and/or speaking fees from Abbott, Air Liquide, Asdia, Dexcom, Insulet, Isis Diabete, Lilly, Medtronic, Novo-Nordisk, Orkyn, Roche Diabetes Care, Sanofi, VitalAire; BC has received consulting and/or speaking fees from Abbott, ASDIA, Dexcom, Dinno Santé, Glooko, Lilly, NHC, Novo-Nordisk, Orkyn, Sanofi, VitalAire; JD has received speaking fees from Novo-Nordisk; ELS has received consulting and/or speaking fees from Abbott, Dexcom, Insulet, Lifescan, Lilly, Novo-Nordisk, Sanofi; EP has received speaking fees from Astra Zeneca and Lilly; FM has received speaking fees from Lilly, CB has received consulting and speaking fees from Dexcom and Lilly; SL has received consulting and/or speaking fees from Abbott, Insulet, Medtronic and Dexcom; and SB has received consulting and/or speaking fees from Dexcom, Insulet, Lilly, Medtrum. FAC and FG have no competing interest.
Funding
The authors disclosed receipt of the following financial support for the research, authorship, and/or publication of this article: Outside of this work, the CIRDIA has been supported by a research grant from the Clement-Drevon Foundation, Dijon, France, a research grant from Santelys, Loos, France and by donations from the French Diabetic Association (Burgundy-Franche Comte and AFD21-25-70), the French Mutualite 39 and the CIRDIA received an award from the FENAREDIAM.
Supplemental Material
Supplemental material for this article is available online.