
Abstract
Background:
Progression from prediabetes to type 2 diabetes (T2D) can be delayed with early detection and intervention. Current detection methods, relying on costly blood glucose tests, limit widespread screening. Machine learning models offer the potential for non–laboratory-based tools. However, existing prediabetes detection models lack validation in their intended target populations. Thus, this study aimed to develop and validate a non–laboratory-based machine learning tool for prediabetes detection in a specific target population.
Methods:
Based on 501 adults from a prediabetes screening project, a decision tree model was developed. Twelve potential non–laboratory-based features were extracted. The target variable was categorized into prediabetes (hemoglobin A1c [HbA1c] ≥39 mmol/mol and <48 mmol/mol) and normoglycemia (HbA1c <39 mmol/mol). The data set was divided into 70% for training and 30% for validation, and forward feature selection was used to identify the most relevant features.
Results:
Out of 501 participants, 88 were identified with prediabetes. The mean age and body mass index (BMI) were approximately 50 years and 27 in both the training and validation sets. Forward selection identified age and waist circumference as the most important features to include in the model. The model achieved an area under the receiver operating characteristic curve (ROC AUC) of 0.8297 and 0.7961 on the training and validation sets.
Conclusion:
A machine learning screening tool using age and waist circumference was developed with promising results. Its simplicity, by only requiring two non-laboratory features, allows for easy implementation. However, to verify the model’s generalizability and external validity, it needs to be evaluated using additional data.
Keywords
Introduction
Progression from prediabetes to type 2 diabetes (T2D) and subsequent complications can be delayed or prevented through the detection of people with prediabetes followed by a preventative intervention.1-4 Both the US Preventive Task Force and the American Diabetes Association (ADA) highlight the importance of early screening and detection of prediabetes to alter the development into T2D and complications.5,6 Despite this, prediabetes is a highly under-detected condition. 7 Only around 11% to 19% of people meeting the criteria for prediabetes are aware of their condition,8,9 highlighting a significant gap in prediabetes detection.
The detection of people with prediabetes currently requires a blood glucose test, using either fasting plasma glucose, an oral glucose tolerance test, or hemoglobin A1c (HbA1c). 5 However, as people with prediabetes often remain asymptomatic, 10 these invasive and costly procedures present barriers to widespread screening.11-13 Thus, an increasing interest in developing alternative screening tools that can detect a proportion of the population for whom blood glucose tests are necessary has emerged.
The use of machine learning-based models for prediabetes screening has gained attention due to their ability to recognize patterns across factors that are useful in disease detection. 14 Specifically, there has been interest in developing models based on non-laboratory and easily assessable features, as these reduce the need and resources for laboratory testing.15,16 This approach makes it possible to screen a larger group of asymptomatic people and to enable screening in areas without access to laboratory equipment.12,17,18 The majority of the developed non–laboratory-based machine learning models aimed to detect both undiagnosed T2D and prediabetes without specifically assessing the models’ ability to detect prediabetes alone, 14 ,18-39 leaving the performance of prediabetes detection unknown. Among studies aimed at detecting both undiagnosed T2D and prediabetes, and evaluating the models’ ability to detect prediabetes alone, the models’ performance in prediabetes detection was found to be inferior compared to undiagnosed T2D.40,41 These findings underline the necessity for a model specifically tailored to prediabetes detection, as the features in the combined detection models appear to prioritize the detection of undiagnosed T2D rather than prediabetes. In addition, a recent systematic review and meta-analysis by Liu et al evaluated the performance of different non–laboratory-based models developed to detect undiagnosed T2D in their ability to detect prediabetes. This review found that the models performed insufficiently when applied to the prediabetes population, as indicated by an area under the receiver operating characteristic curve (ROC AUC) ranging from 0.64 to 0.74. Consequently, it was concluded that these models are unsuitable for prediabetes detection. 42
To the best of the authors’ knowledge, only a limited number of studies have investigated non–laboratory-based machine learning models specifically developed for prediabetes detection. 13 ,43-47 These studies based their model development on registry data from wider community screenings, eg, the National Health and Nutrition Examination Survey (NHANES), the Korean National Health and Nutrition Examination Survey (KNHANES), or the Indonesian National Basic Health Survey (INBHS). 13 ,43-47 However, these models were not validated in the populations where they were intended to be implemented, which may compromise their performance when implemented in practice. Machine learning models for prediabetes detection tend to perform better when validated in the same population for which they were developed.15,42,48 This highlights the importance of developing and validating a screening tool using a data set sampled from the specific target population where it will be applied in clinical practice.15,42 Therefore, this study aimed to develop and validate a machine learning-based screening tool that relied on non-laboratory and easily accessible data collected in a target population for the detection of people with prediabetes.
Methods
Data Source and Feature Extraction
The data used to develop the machine learning model originated from a project between Steno Diabetes Center North Denmark and three municipalities in the northern region of Denmark. The project’s aim was to perform health screenings for adults (≥ 18 years) within community settings to identify undiagnosed prediabetes and T2D and direct participants to existing municipal interventions. Screenings were conducted in companies across the municipalities by recruiting companies that mainly hired individuals with lower education levels, as this is recognized as a risk factor for prediabetes and T2D.49,50 Moreover, one municipality held a health check day at its health center, mainly targeting elderly and unemployed residents. The screening took place between August 2022 and April 2024. All eligible participants provided written informed consent. According to Danish legislation, ethical approval was not necessary for the study.
At the screening, demographic data were collected from the participants (Supplemental Material 1). The demographic data included gender, age, height, weight, ethnicity (both mother and father), body fat percentage, waist circumference (measured midway between the lower rib and the upper part of the hip socket with a measuring tape), blood pressure (both systolic and diastolic), educational level, known hypertension, taking blood pressure medication, smoking status, and family history of diabetes (limited to parents or siblings). Education level, known hypertension, blood pressure medication, smoking status, and family history of diabetes were self-reported by the participants. All the demographic data were considered as potential features, except for ethnicity, which was excluded for being a near-constant feature with low predictive value because most of the screened participants had a mother and father of Danish ethnicity (93.01% and 92.22%, respectively). The detection target of the model was the presence of prediabetes, defined as an HbA1c between 39 and 47 mmol/mol, following ADA’s definition of prediabetes. 5 The data set comprised information from 501 participants, all of whom had a measured HbA1c level from the screening visit and did not have previously diagnosed or screening-detected T2D. A point-of-care testing device (Affinion 2, Abbott) was used to measure HbA1c.
Preprocessing of Data
All handling and analysis of data were performed in Python version 3.11.5. Initially, the prediction target (HbA1c), originally represented as continuous data, was encoded into a binary feature. Participants with an HbA1c ≥ 39 mmol/mol but < 48 mmol/mol were classified as having prediabetes, while those with an HbA1c < 39 mmol/mol were classified as normoglycemic. All with a previously diagnosed or screening-detected T2D were excluded before data preprocessing. All nominal categorical features were binary encoded, while ordinal coding was done on ordinal categorical features (Table 1). The body mass index (BMI) was calculated based on each participant’s height and weight. Subsequently, height and weight were removed from the data set, leaving 12 potential extracted features for model development (Table 1). Missing data were imputed using single imputations by chained equation, as none of the features had a considerable amount of missing data (<4%). Finally, the data set was divided into training (70%) and validation (30%) sets, stratified by the target variable to maintain the original proportion of classes.
Overview of Extracted Features, Their Data Type, and Levels of the Coded Features for Model Development.
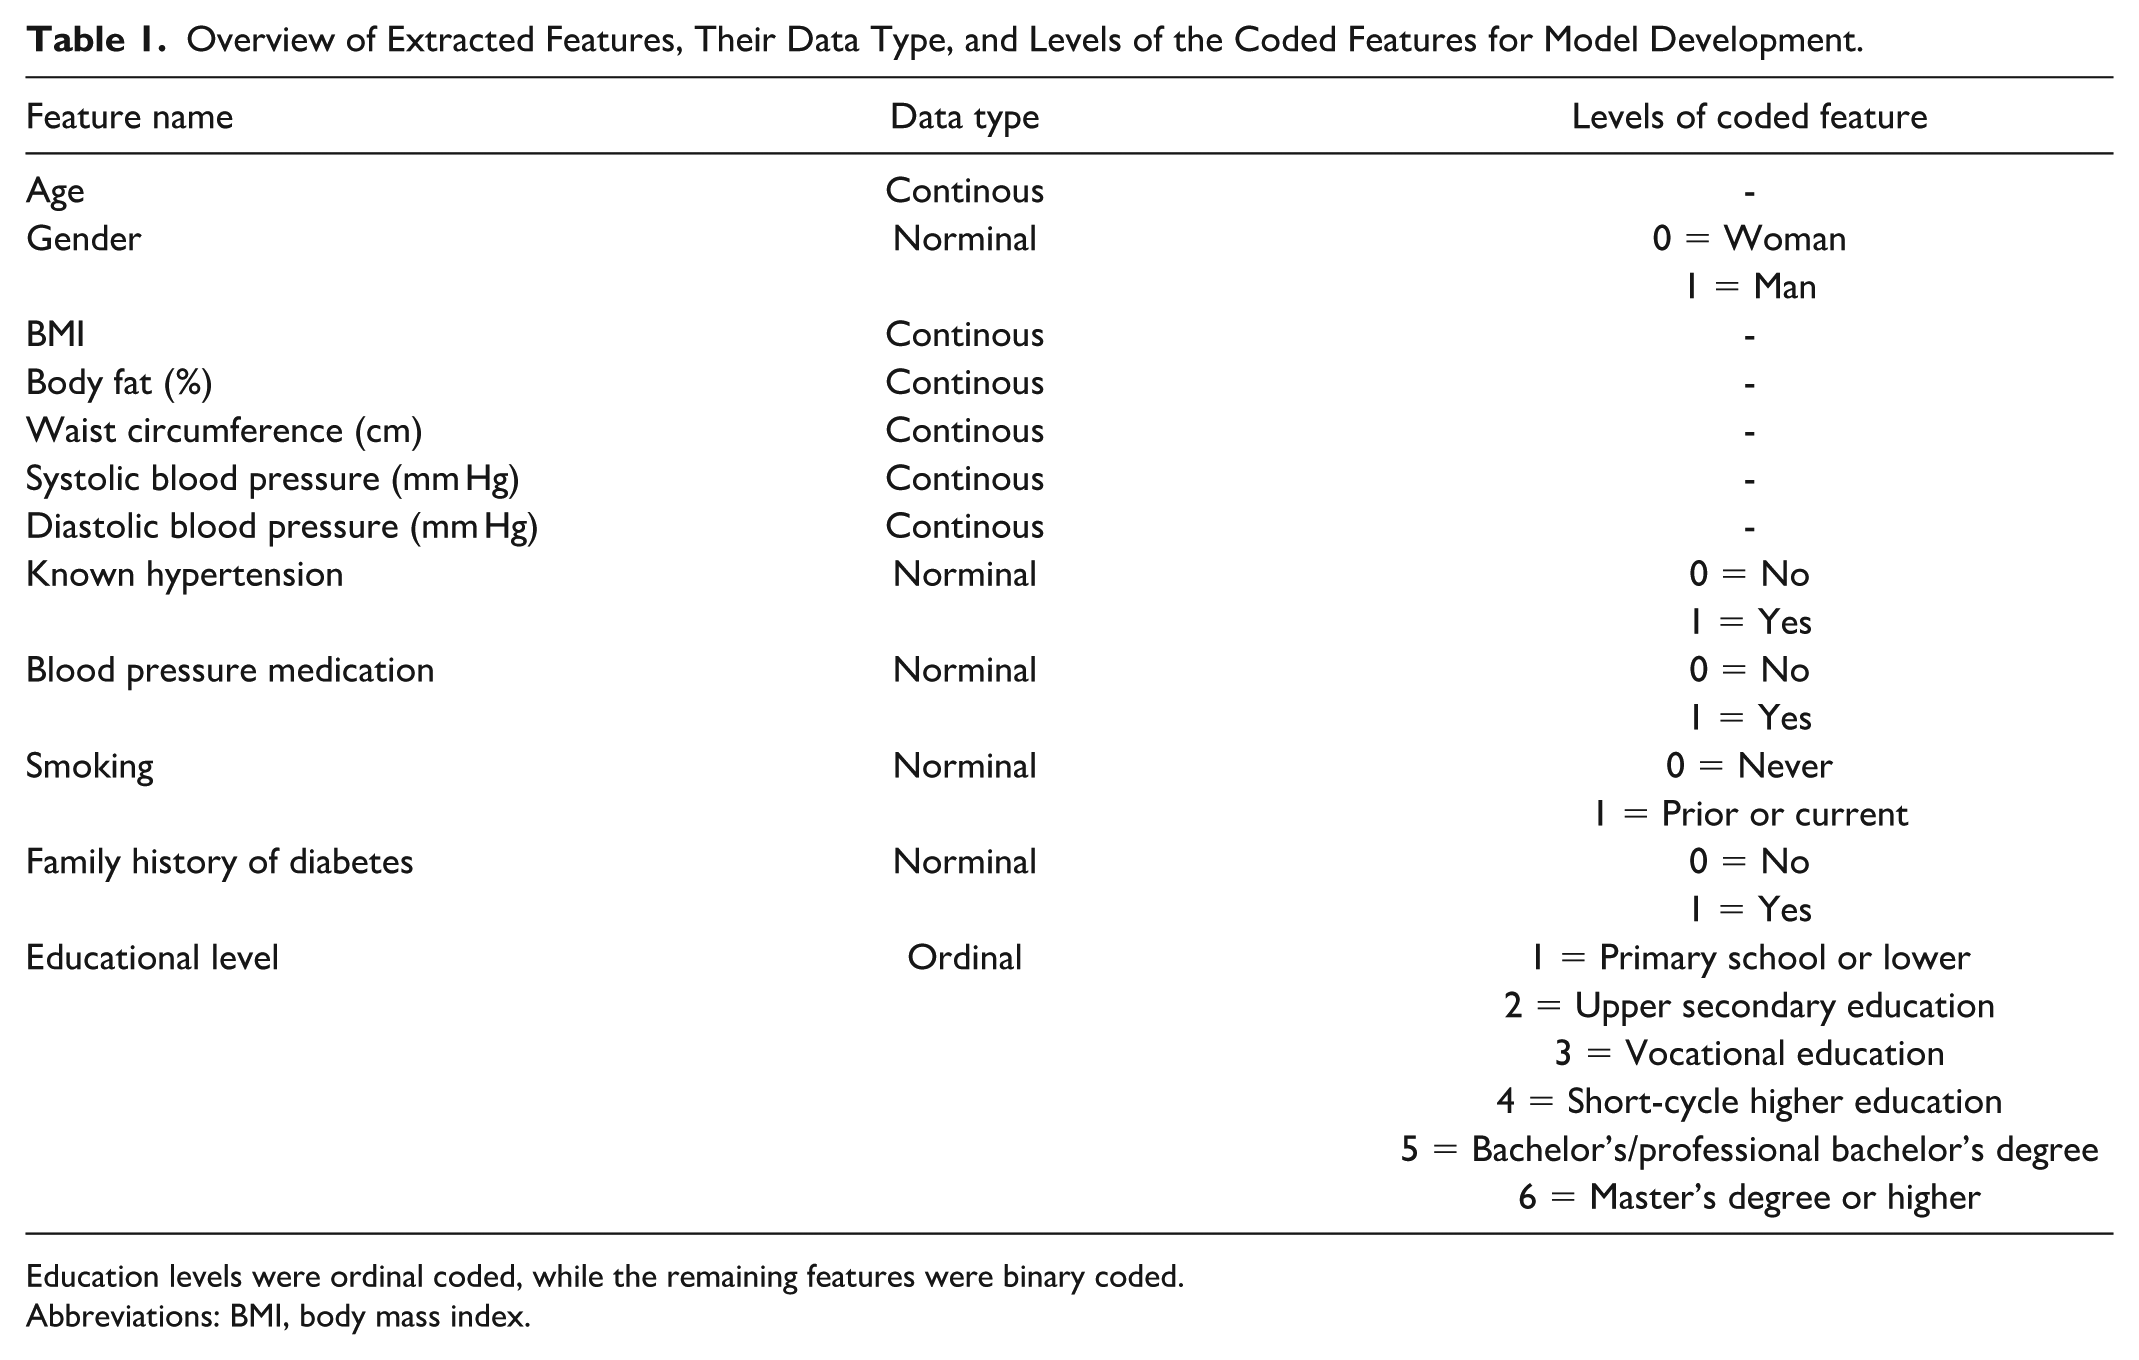
Education levels were ordinal coded, while the remaining features were binary coded.
Abbreviations: BMI, body mass index.
Feature Selection
Before the model training, a feature selection process was conducted to identify the most informative features. This involved employing a sequential forward feature selection technique within a five-fold cross-validation framework, using a decision tree and ROC AUC as performance criteria. To avoid overfitting during the feature selection, initial hyperparameters were set. The minimum sample leaf was set to 30, and the maximum depth was set to three. Furthermore, the class weight was adjusted to account for an expected imbalanced data set, due to the prevalence of prediabetes. A feature was included in the model if its addition resulted in an increase of ≥1% in the ROC AUC. Following the feature selection, a grid search was performed on the hyperparameters (the minimum sample leaf and maximum depth) using a five-fold cross-validation to identify the most optimal combination. The range of the minimum sample leaf was 2 to 10, while the range of max depth was 10 to 60.
Model Training and Validation
The selected features from the feature selection process, along with the hyperparameters identified through the grid search, were used to train a decision tree model. The class weight was once again adjusted to account for an expected imbalanced data set. A decision tree was chosen due to its explainability of how the features contribute to the detection. An explainability model was prioritized, as this is important for health care professionals and patients when using machine learning models in decision-making in clinical practice.51-53 The model was validated on the validation set using ROC AUC. In addition, the model’s performance was assessed using confusion matrices, accuracy, sensitivity, specificity, positive predictive value, negative predictive value, and a calibration plot. The optimal threshold was determined based on Youden’s Index to identify the threshold that maximized the sum of sensitivity and specificity. Furthermore, an analysis of false positive and false negative predictions was conducted to assess whether the misclassified participants’ HbA1c levels were close or far from the prediabetes threshold, providing useful insight into the potential clinical consequences of the prediction errors.
Comparative Analysis
Given the potential for improved performance offered by more complex, non-explainable models, a random forest model was included as a comparator to the decision tree model. The comparative analysis aimed to investigate the trade-off between model explainability and model performance. The data preprocessing procedures were identical for both models, and the same training and validation sets were used. The model was trained using all available features, due to the nature of the algorithm, and with hyperparameters aligned to those specified for the decision tree to ensure comparability, aside from the number of estimators, which was set to 100 to reflect the ensemble nature of the model. The model performance was evaluated using ROC AUC.
Results
Among the 501 participants, 88 were identified with prediabetes. The training set included a total of 350 participants (289 with normoglycemia and 61 with prediabetes). The validation set included a total of 151 participants (124 with normoglycemia and 27 with prediabetes). Table 2 shows the baseline characteristics of the participants in the training and validation set. In both data sets, the mean age of the participants was approximately 50 years, the mean BMI was approximately 27, and the mean waist circumference was 96 cm. Visual inspection of the baseline data showed an overall fair division of data into training and validation sets. However, there were some numerical differences regarding males, former/current smokers, family history of diabetes, and educational level.
Baseline Characteristics of the Training and Validation Set.
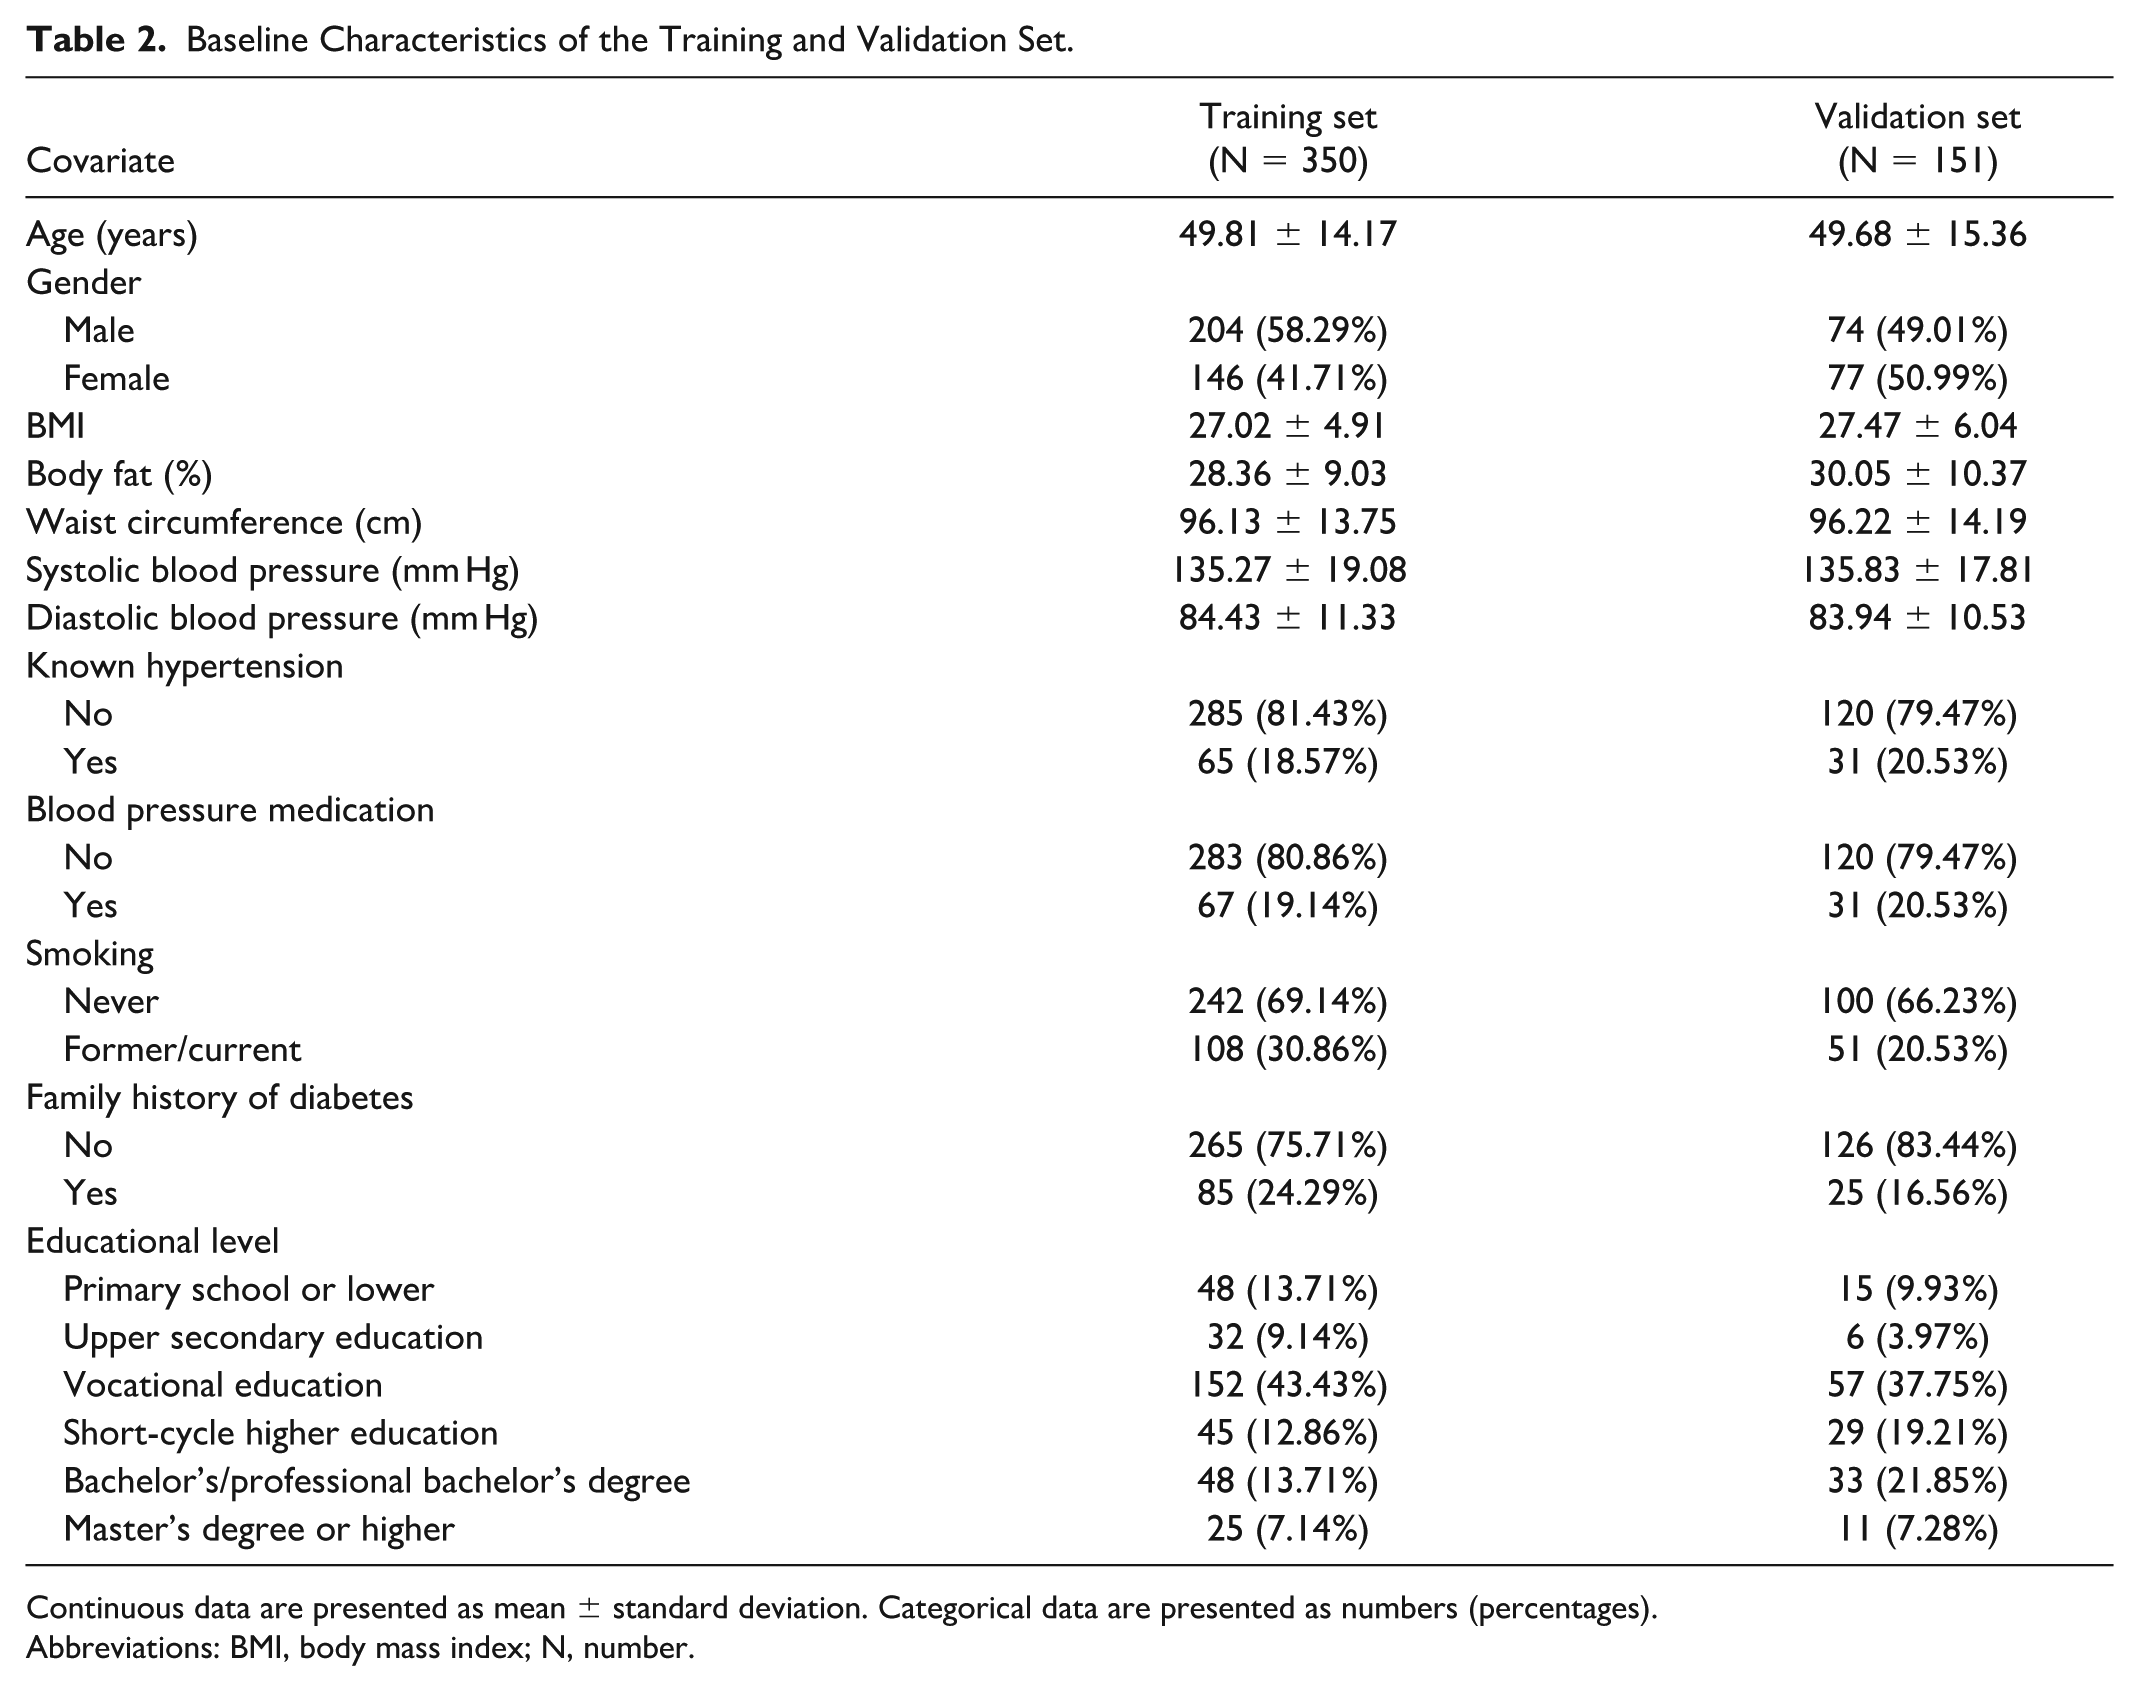
Continuous data are presented as mean ± standard deviation. Categorical data are presented as numbers (percentages).
Abbreviations: BMI, body mass index; N, number.
Two out of the 12 potential features were selected based on the forward feature selection (Figure 1). The feature correlation matrix is presented in Supplemental Material 2. The two selected features were age and waist circumference. The grid search revealed that the best hyperparameter combination was a minimum sample leaf of 30 and a maximum depth of four. However, the best hyperparameter combination only showed a minor improvement in terms of ROC AUC (0.7728 vs 0.7818). The resulting decision tree is displayed in Figure 2. Starting at the top of the tree, answering the questions with “yes” or “no” at each node (gray boxes) leads to an end node classified as either normoglycemia or prediabetes (green and blue boxes). The probability of having prediabetes is shown in the end nodes. Based on the decision tree, the risk of having prediabetes is determined primarily based on age, with a split threshold of 49.5 years; three out of four end nodes on the right side (age >49.5 years) classify a person as having prediabetes, while all three end nodes on the left side (age ≤49.5 years) classify a person as normoglycemic.
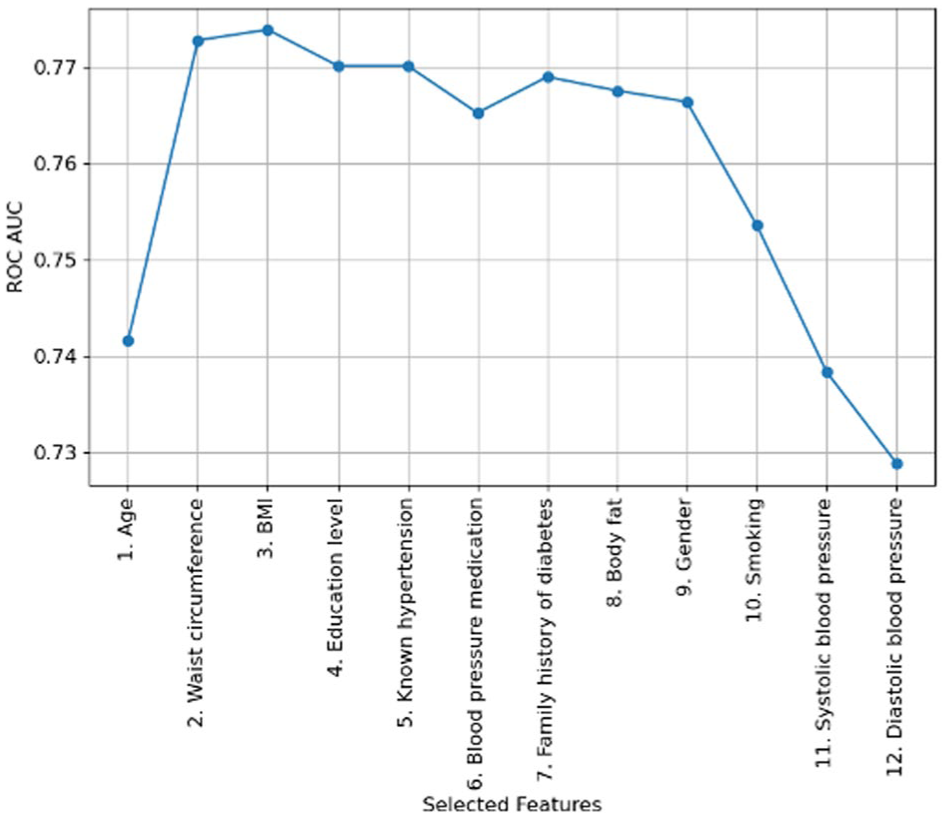
Forward feature selection process, illustrating the increase in ROC AUC for each added feature.
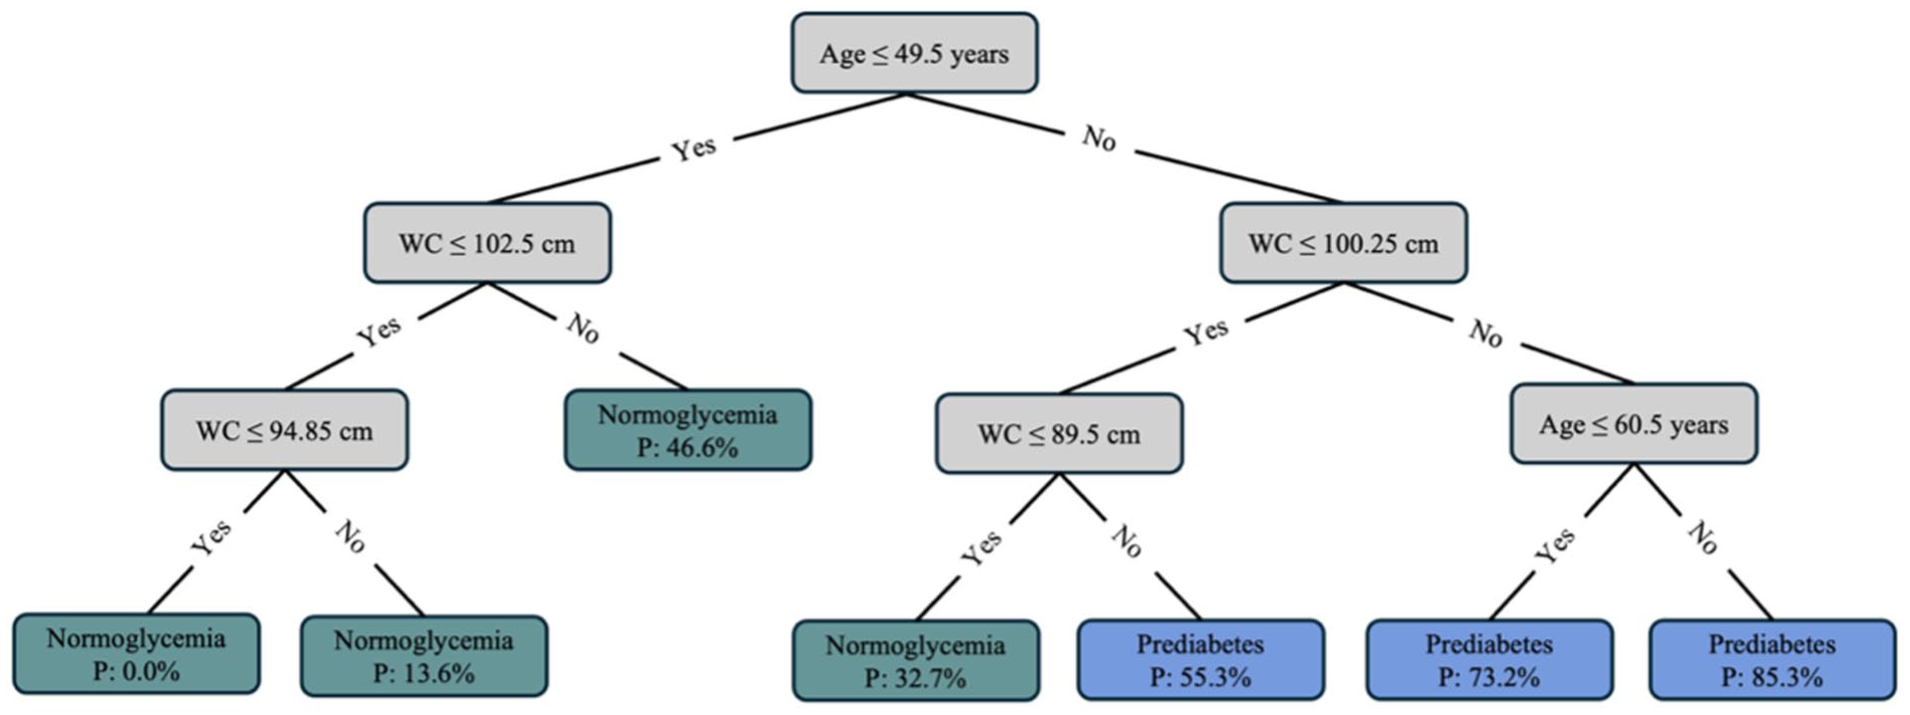
Decision tree for detecting prediabetes based on age and waist circumference. Starting at the top, the gray boxes contain the questions that lead a person to an end node, indicated by the green and blue boxes. Green boxes classify a person with normoglycemia, while blue boxes classify a person with prediabetes.
The decision tree model achieved an ROC AUC of 0.8297 on the training set and 0.7961 on the validation set (Figure 3). In comparison, the random forest model achieved an ROC AUC of 0.8785 on the training set and 0.7999 on the validation set, indicating only a slight improvement in ROC AUC. The calibration plot for the validation set indicated that the decision tree model tended to overestimate predicted probabilities (Supplemental Material 3).
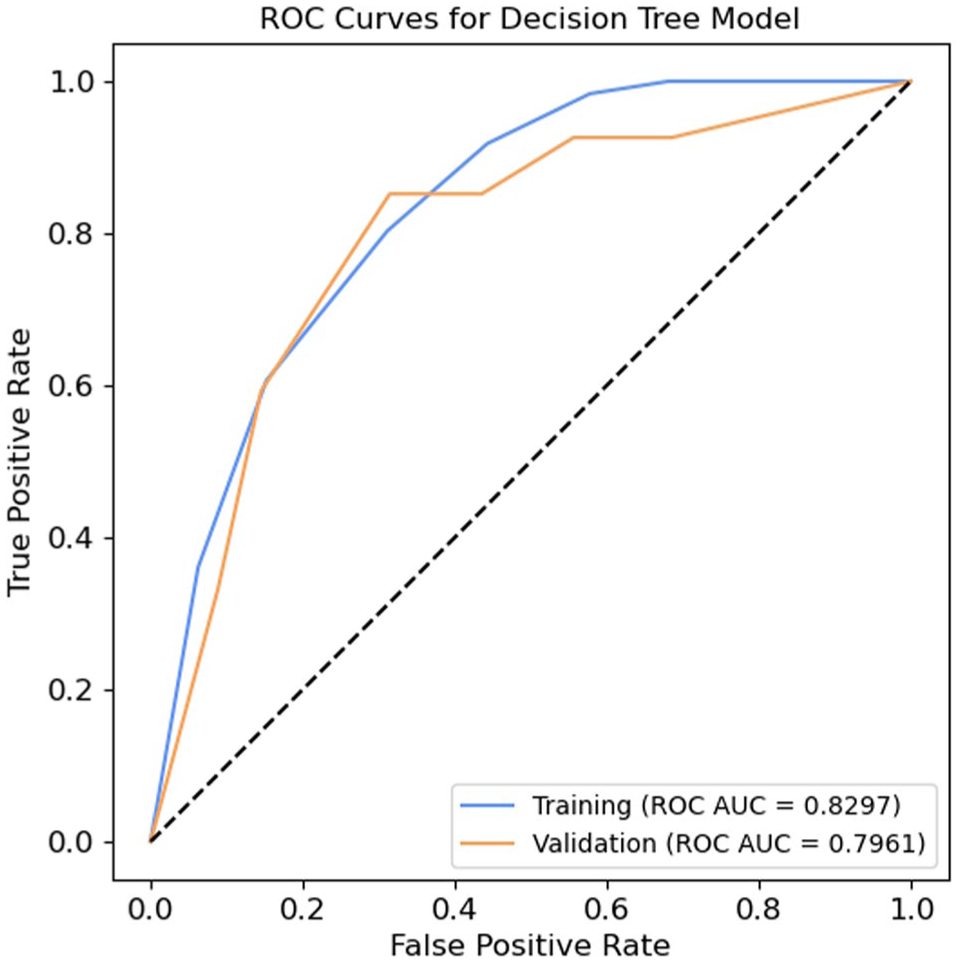
Receiver operating characteristic curves for the decision tree model, based on the training and validation sets.
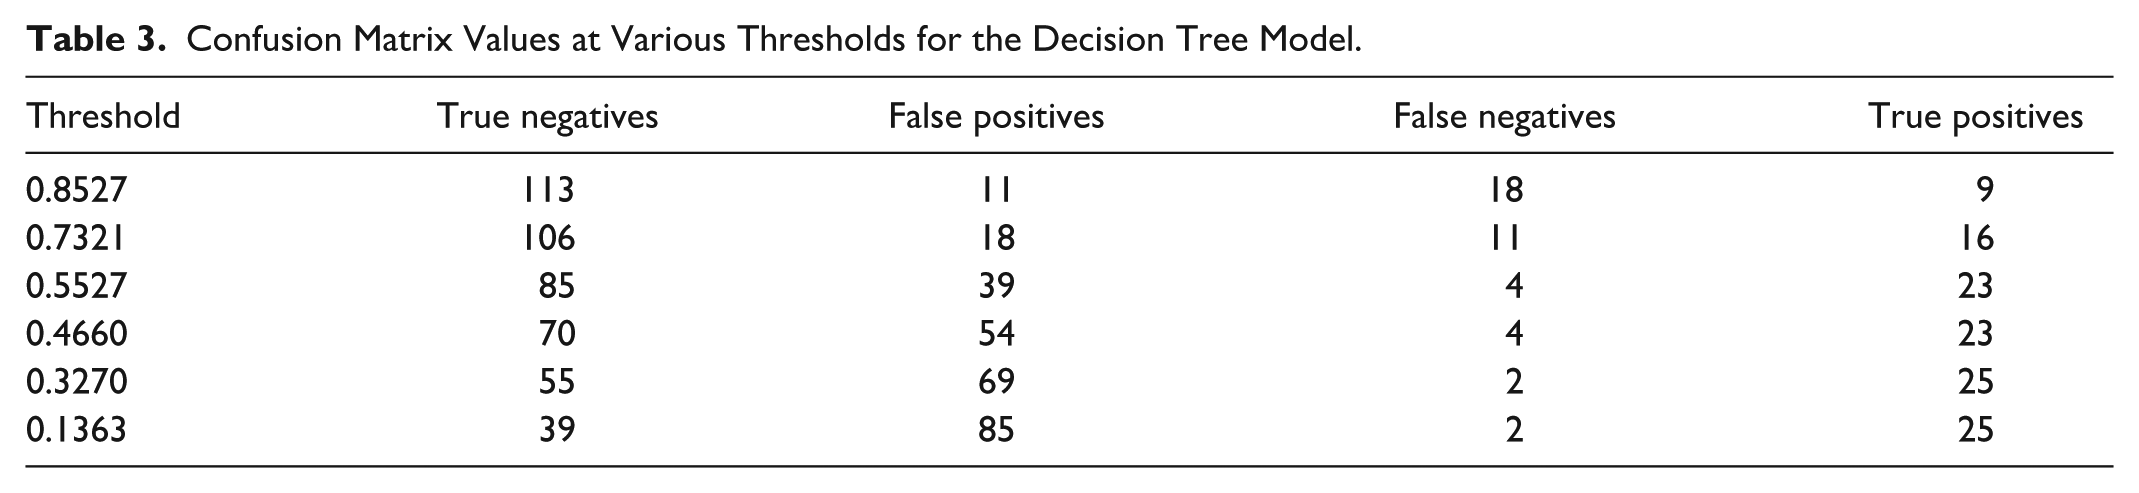
Using the optimal threshold of 0.5527 on the validation set (Supplemental Material 4), the decision tree model demonstrated a sensitivity of 0.8519, a specificity of 0.6855, a positive predictive value of 0.3710, a negative predictive value of 0.9551, and an accuracy of 0.7152 (Supplemental Material 5). Table 3 shows the derived confusion matrix values at various thresholds. Figures 4 and 5 illustrate the distribution of HbA1c levels for false positive and false negative predictions at the optimal threshold. The distribution at the remaining thresholds can be found in Supplemental Material 6. In total, 43 (28.48%) prediction errors occurred, comprising four false negative predictions (9.30%) and 39 false positive predictions (90.7%). Three of the four participants with false negative predictions had an HbA1c level of 39 mmol/mol, while the last had an HbA1c level of 40 mmol/mol. Among the participants with a false positive prediction, approximately 40% had an HbA1c level near the prediabetes definition threshold at either 37 or 38 mmol/mol, while the remaining 60% had an HbA1c between 30 and 36 mmol/mol.
Confusion Matrix Values at Various Thresholds for the Decision Tree Model.
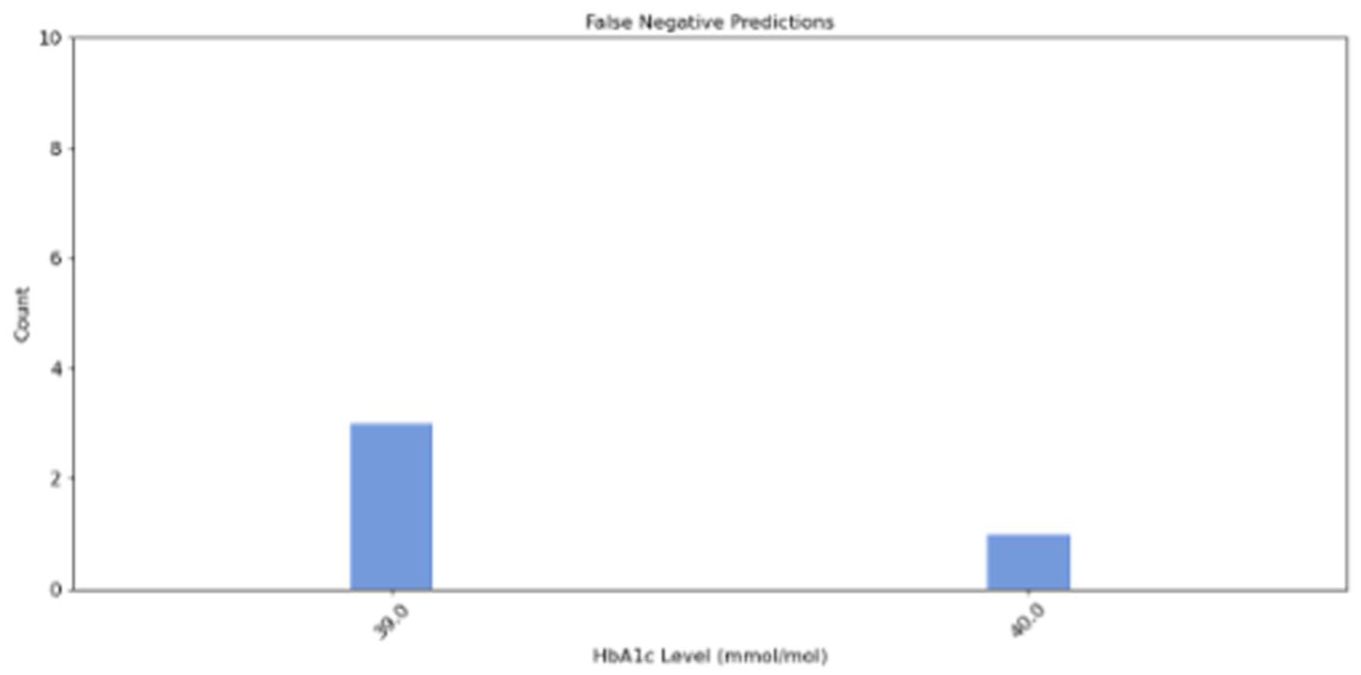
Distribution of HbA1c levels among participants with false negative predictions from the decision tree model.
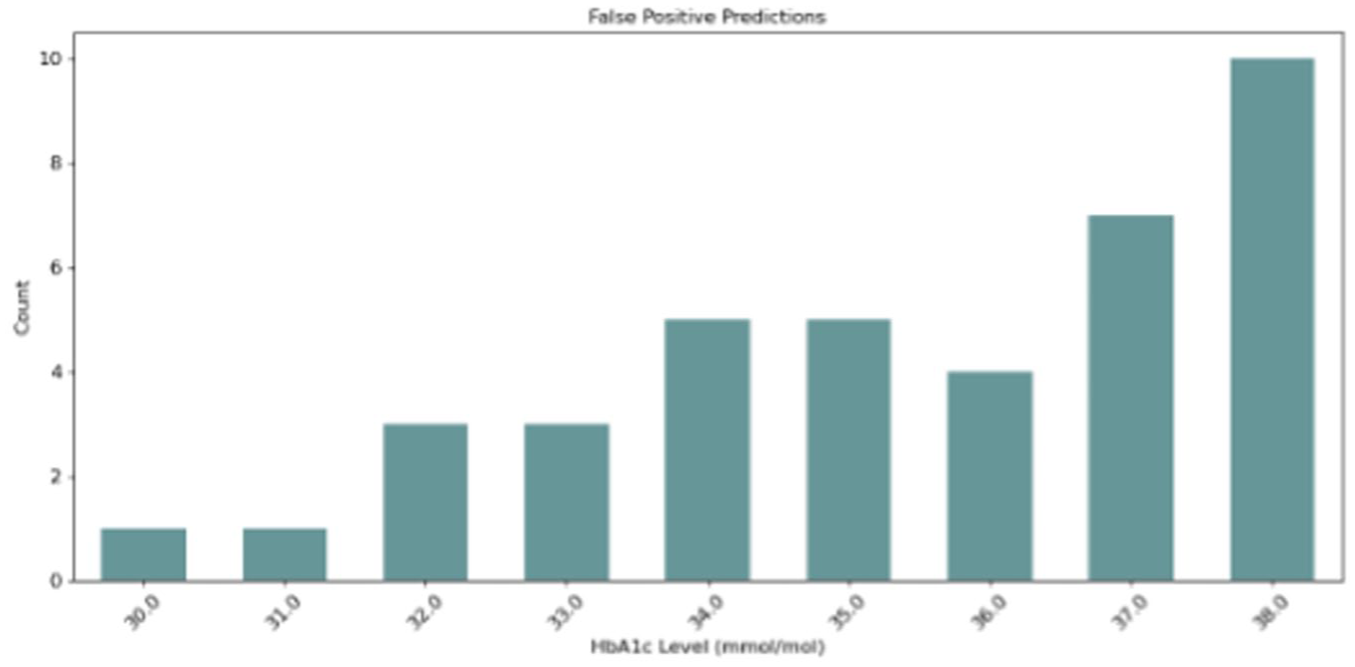
Distribution of HbA1c levels among participants with false positive predictions from the decision tree model.
Discussion
This study demonstrated that it is possible to detect prediabetes in a target population with a machine learning-based screening tool that relies on non-laboratory and easily accessible features with acceptable performance.
To the best of the author’s knowledge, no previous studies within the field of non–laboratory-based screening tools specifically for prediabetes detection have based their model development on data sampled from a target population. However, previous studies have developed and validated non–laboratory-based machine learning models specifically developed for prediabetes detection using registry data. These models have achieved an ROC AUC ranging from 0.31 to 0.80. 13 ,43-47 In comparison, the ROC AUC of 0.7961 achieved in the present study with the decision tree model showed superior or equal performance in prediabetes detection. Thus, the decision tree model demonstrated acceptable performance, highlighting the potential of an explainable machine learning-based screening tool for prediabetes detection in a target population.
The comparator analysis based on the random forest model achieved an ROC AUC of 0.7999, showing only a minor performance improvement compared to the decision tree model’s ROC AUC of 0.7961. However, this minor improvement does not outweigh the advantages of explainability offered by the decision tree model. Given the comparable performance of the decision tree and its ability to provide interpretable and transparent decision-making, it appears more suitable for clinical practice, where explainability is essential for building clinical trust and facilitating implementation.51-53
The decision tree model exhibited a high amount of false positive predictions (90.7% of all prediction errors). This may present a limitation of the model in clinical practice, as it leads to unnecessary referral for blood glucose testing of people with normoglycemia, thus consuming laboratory resources and potentially causing anxiety among this group. However, reducing the number of false positive predictions inevitably results in more false negative predictions. 54 Since false positive predictions only result in a confirmatory blood glucose test, prioritizing detecting as many people as possible with prediabetes may be preferable.13,43 Notably, a considerable amount (40%) of the false positive cases were close to the prediabetes threshold (≥39 mmol/mol). Although these are misclassified, they may represent a borderline risk group of prediabetes and T2D. 55 At the same time, all cases classified as false negatives were close to the prediabetes threshold, with an HbA1c at either 39 mmol/mol or 40 mmol/mol. These prediction errors may represent less severe misclassifications, as they present a group with a lower risk of T2D compared to cases with HbA1c levels that are closer to the threshold for T2D.56-58 While the model has room for improvement, this suggests a reasonable balance between the false positive and false negative predictions made by the current model and highlights the importance of analyzing the prediction errors to decide on the trade-off between false positive and false negative predictions in future developed models within the research area.
The model developed in this study included age and waist circumference as features. Consistent with the current study, age was included in the models of previous studies. 13 ,43-47 Given that age is a known risk factor for prediabetes,59-61 the inclusion of this feature in the models was understandable. Similarly, in the studies by Abbas et al, 13 Choi et al, 44 and Wang et al, 46 waist circumference was also included in the developed models, consistent with the current study. In other similar studies, waist circumference was not available as a feature. However, these studies included other features related to body composition, such as BMI and waist-to-height ratio.43,45,47 The BMI, waist circumference, and waist-to-height ratio can all be used as indicators of overweight and obesity,62,63 meaning that each model included a feature related to overweight or obesity, which is a known risk factor for prediabetes.64,65 In contrast to this study, the previous studies included between four and 11 features in the final models. This may be due to methodological differences related to model type or procedures for feature selection, where the inclusion of features, eg, relied on statistically significant bivariate analyses45,46 or involved including all features without any selection. 47 However, the inclusion of only two features in the current model, without compromising performance, enhances the practicality of the screening tool for use in clinical practice, as it requires minimal data collection and processing. In addition, collecting age and waist circumference does not require any special equipment and can be easily performed by trained personnel, even in areas without access to health care providers. This makes the screening tool attractive for use in low-resource settings, where it could be deployed as a paper-based tool and integrated into existing outreach programs, such as community health screening initiatives or chronic disease prevention programs.
Although the model is not intended for self-administration by individuals at risk of prediabetes, it is essential to note that, if it were to be considered for such use, variability in waist circumference measurements may pose a concern. Previous studies have identified discrepancies between measurements taken by trained personnel and those obtained through self-measurement by individuals,66-68 which could potentially affect the model’s performance by producing false positive or false negative results. Given the strong correlation between waist circumference and BMI reported in this study, BMI may be considered a potential alternative to waist circumference for self-administration as self-reported BMI has been associated with lower variability than self-measured waist circumference. 69 However, using BMI instead of waist circumference resulted in a slightly reduced validation ROC AUC of 0.7924 in the current study.
The definition of prediabetes defined solely on HbA1c in the current study presents a limitation for the model’s ability to detect the broader prediabetes population in clinical practice, as it excludes those solely defined by impaired fasting glucose (IFG) or impaired glucose tolerance (IGT). Previous studies have shown that only around 10% of people with prediabetes fulfill all three criteria used to define prediabetes (HbA1c, IFG, and IGT).70,71 The overlap between HbA1c-defined and IFG-defined prediabetes has been found to be between 10.36% and 17.53%, while the overlap between HbA1c-defined and IGT-defined prediabetes has been found to be between 4.14% and 6.07%.70,71 Thus, solely using HbA1c to detect people with prediabetes leaves a considerable proportion of people with prediabetes defined by one of the other criteria undetected. In addition, some of the characteristics of prediabetes defined by the three criteria have been found to differ. For instance, the risk of having IFG was found to increase with male gender, while the risk of IGT increased with female gender, and no association of gender was found for HbA1c.70,71 Furthermore, older age was associated with a higher risk of having both HbA1c-defined and IGT-defined prediabetes,70,71 while unemployment was associated with IGT-defined prediabetes. 71 This complicates the generalizability of the model for detecting IFG-defined or IGT-defined prediabetes, as the features used for detecting HbA1c-defined prediabetes may deviate from the features that should be used for detecting IFG-defined and IGT-defined prediabetes. Another limitation of the current study is the size and origin of the data. The data were sampled in a relatively limited geographic area of Denmark. This limitation may restrict the generalizability to the wider prediabetes population and other ethnicities.
Conclusion
In conclusion, it was possible to develop a machine learning-based screening tool for prediabetes with acceptable performance for a target population. The tool is easy to implement in clinical practice. It can be used on paper and requires only the collection of age and waist circumference, both of which are easily measurable without laboratory tests. Implementing the tool in clinical practice could improve screening and potentially increase the detection of prediabetes. Nonetheless, the model requires further refinement before implementation. Investigating its ability to detect IFG- and IGT-defined prediabetes, incorporating additional data, and performing external validation in another target population will be essential to confirm the model’s generalizability and applicability for prediabetes detection.
Supplemental Material
sj-docx-1-dst-10.1177_19322968251376380 – Supplemental material for Developing a Simple Non–Laboratory-Based Machine Learning Tool for Prediabetes Screening in a Target Population: A Proof-of-Concept Study
Supplemental material, sj-docx-1-dst-10.1177_19322968251376380 for Developing a Simple Non–Laboratory-Based Machine Learning Tool for Prediabetes Screening in a Target Population: A Proof-of-Concept Study by Tanja Fredensborg Holm, Thomas Kronborg, Morten Hasselstrøm Jensen and Stine Hangaard in Journal of Diabetes Science and Technology
Footnotes
Acknowledgements
The authors would like to express their gratitude to the municipalities involved for collecting the data and to Steno Diabetes Center North Denmark for providing the data used in the study.
Abbreviations
ADA, American Diabetes Association; BMI, body mass index; CDC, Centers for Disease Control and Prevention; FINDRISC, Finnish Diabetes Risk Score; HbA1c, hemoglobin A1c; IFG, impaired fasting glucose; IGT, impaired glucose tolerance; INBHS, Indonesian National Basic Health Survey; KNHANES, Korean National Health and Nutrition Examination Survey; NHANES, National Health and Nutrition Examination Survey; ROC AUC, area under the receiver operating characteristics curve; T2D, type 2 diabetes.
Declaration of Conflicting Interests
The authors declared the following potential conflicts of interest with respect to the research, authorship, and/or publication of this article: MHJ is full-time employed and owns shares in Novo Nordisk A/S. No conflicts of interest were declared by the remaining authors.
Funding
The authors received no financial support for the research, authorship, and/or publication of this article.
Supplemental Material
Supplemental material for this article is available online.
References
Supplementary Material
Please find the following supplemental material available below.
For Open Access articles published under a Creative Commons License, all supplemental material carries the same license as the article it is associated with.
For non-Open Access articles published, all supplemental material carries a non-exclusive license, and permission requests for re-use of supplemental material or any part of supplemental material shall be sent directly to the copyright owner as specified in the copyright notice associated with the article.