
Abstract
Background:
An impaired β-cell function is a key contributor to the pathophysiology of diabetes mellitus that can be estimated by the biomarker C-peptide. Measurement of C-peptide can therefore be used for prediction, diagnosis, and subclassification of diabetes. Furthermore, C-peptide assists in the prediction of therapeutic response and guiding therapeutic decisions. To support diabetes classification, the American Diabetes Association (ADA) and the European Association for the Study of Diabetes (EASD) have recently introduced serum C-peptide cut-off values in their guidelines: <0.2 nmol/L C-peptide levels suggest the presence of type 1 DM while C-peptide levels >0.6 nmol/L indicate type 2 DM. However, analytical aspects limit the clinical utility of these defined cut-off values since standardization of C-peptide measurements has not been achieved. Results from different assay manufacturers still show significant variability.
Results:
This discrepancy can have significant consequences, as reliance on C-peptide testing for diabetes classification and therapeutic decisions has steadily increased in recent years. Although there have been growing calls to standardize C-peptide testing and a process for standardization has been established, standardization has unfortunately yet to be implemented in practice.
Conclusion:
It therefore seems appropriate for health care providers to advocate for standardized C-peptide measurements, which is more or less in the hands of the manufacturer of the C-peptide assays, to improve diagnostic accuracy and patient safety.
Introduction
Besides clinical presentation, the diagnosis and management of diabetes mellitus (DM) are essentially based on laboratory measures of hyperglycemia, such as plasma glucose and HbA1c.1,2 However, due to the complex nature of diabetes pathogenesis, relying solely on these biomarkers does not allow for a clear distinction between the different forms and presentations of DM, potentially leading to misdiagnosis and inappropriate therapy. 3 Recent American Diabetes Association (ADA) and European Association for the Study of Diabetes (EASD) guidelines have begun to recommend the use of C-peptide testing to more accurately distinguish between type 1, type 2, and monogenic forms of diabetes, particularly in cases where the diagnosis is uncertain.1,4,5 A diagnostic flowchart has been proposed that incorporates two C-peptide cut-off values—0.2 nmol/L and 0.6 nmol/L—along with patient age, clinical features, and islet autoantibody testing. The proposed diagnostic thresholds are limited to a white European adult population. There is less knowledge for non-European/different ethnic populations. A previous publication indicates that even the populations of people with diabetes in China and India are different in β-cell function and insulin resistance, respectively. 6
Increasing evidence demonstrates the role of C-peptide as a valuable metric for the subclassification of type 2 diabetes. Considering its heterogeneous nature, C-peptide has the potential to enable more personalized diagnostic and treatment approaches.7-9
In clinical laboratories, C-peptide measurement is typically performed using immunoassays. Although each assay is factory-calibrated using its own proprietary scheme, they share a common feature: calibration with synthetic, purified C-peptide material. Currently, two versions of this material are available, both provided by the World Health Organization (WHO). However, concerns remain about discrepancies among different measurements, as true standardization of the C-peptide assay has never been achieved.9,10 Therefore, there is an urgent need for global standardization of C-peptide measurements. This can be driven by regulatory bodies; however, it has to be implemented by the manufacturer of the C-peptide assays.
Background
As mentioned previously, the clinical presentation of a person with diabetes does not always allow a proper classification of DM. Therefore, considering the disease’s pathogenesis may help to classify the patient’s type of diabetes and therefore lead to adequate therapy. Different pathophysiological mechanisms can lead to chronically elevated glucose levels. These include:
A reduced or absent ability of the β-cell to secrete insulin, as seen in persons with type 1 diabetes mellitus (T1DM) or cases caused by genetic defects, such as maturity-onset diabetes of the young (MODY).10,11
Decreased insulin action due to insulin resistance, often accompanied by a progressive decline in insulin secretion over time, 8 or
A less well-defined form of diabetes is known as latent autoimmune diabetes in adults (LADA).10,12
Therefore, in addition to the clinical presentation of individuals with diabetes, assessing β-cell responsiveness in relation to their nutritional and metabolic status may support more accurate characterization and subsequently facilitate the optimization of diabetes treatment. 13
Estimation of β-Cell Function
Insulin and C-peptide are produced in the pancreatic β-cells by proteolytic cleavage of preformed proinsulin. Upon stimulation, insulin and C-peptide are secreted into the bloodstream in a 1:1 molar ratio. Therefore, both physiological peptides are the only measures reflecting the β-cell capacity and function. Other laboratory parameters like HbA1c, acute blood glucose levels or continuous glucose monitor (CGM) data are indirect indicators of β-cell capacity and function. Since insulin is the biologically active hormone earlier studies measured blood insulin levels for metabolic studies. However, previous studies have indicated that the determination of insulin has several disadvantages. Since insulin is rapidly cleared by the liver, only a variable percentage (typically 50% or less) reaches the peripheral circulation from which blood samples are taken. 8 In contrast, C-peptide is cleared in the kidney at a lower and more constant rate resulting in peripheral concentrations that are more than five times higher than those of insulin. 8 Furthermore, insulin values cannot be reliably interpreted in insulin-treated patients, as commonly used assays detect both endogenous and exogenous insulin to varying extents. Therefore, most recent studies have adopted C-peptide as a surrogate marker of β-cell function.14-16
For unequivocal determination of β-cell function and β-cell capacity, the release of C-peptide is determined under-stimulated and non-stimulated conditions. While fasting C-peptide levels indicate basal status, stimulation tests may detect the residual beta-cell capacity for insulin secretion. The glucagon stimulation test (GST), mixed-meal tolerance test (MMTT), and oral glucose tolerance test (oGTT) are widely used in both clinical practice and research to evaluate β-cell functional capacity under-stimulated conditions. 17 The GST is based on the action of glucagon (1 mg i.v.), which rapidly stimulates the secretion of insulin and C-peptide. Determination of the C-peptide value after 6 minutes reflects β-cell function and capacity, as glucagon-induced stimulation is independent of glucose and other metabolically active hormones. 17 Although this test is invasive and may cause nausea, the GST is considered superior to glucose-induced stimulation, particularly because it is more reproducible and more sensitive. Since the MMTT also shows high specificity and excellent sensitivity, both tests are recommended for the assessment of β-cell function. 18
Clinical Utility of C-Peptide Determination
Until recently, C-peptide measurement was viewed primarily as a research tool with limited relevance in clinical practice. However, numerous reports indicate the potential utility of C-peptide in various clinical situations. These include:
Prognosis:
Prediction of DM onset. 19
Detection of β-cell dysfunction prior to the manifestation of type 1 diabetes.20,21
Monitoring the preservation of C-peptide secretion in subjects at high risk of developing type 1 diabetes. 22
Diagnosis and classification:
Therapeutic utility:
Prediction of vascular complications:
Examples of Decision-Making in the Therapy of Diabetes
While many studies do not report details regarding C-peptide measurement, a review by Jones and Hattersley summarizes findings from clinical studies on the diagnostic and therapeutic utility of C-peptide, including proposed cut-off values. 23 For example, the authors conclude that in insulin-treated individuals with diabetes, a fasting C-peptide value of <0.25 nmol/L or a stimulated C-peptide level of <0.6 nmol/L suggests marked insulin deficiency and is indicative of type 1 diabetes. Although numerous studies propose cut-off values, there is considerable variation in their optimal thresholds and predictive power. These discrepancies may reflect differences in patient populations, stimulation methods, or C-peptide assay techniques. In addition, a previous report proposed the use of the C-peptide/glucose ratio (CGR; pmol/mg/dL) to guide treatment decisions in people with diabetes. 8 Based on data from a well-characterized diabetic cohort (n = 330), the authors recommend the following CGR-based approach:
CGR <2: insulin therapy is required.
2 ≤CGR <5: Basal insulin combined with antihyperglycemic agents is recommended.
CGR ≥5: Insulin therapy is not necessary.
Furthermore, for patients with CGR ≥2 and elevated cardiovascular risk, SGLT2 inhibitors or GLP-1 receptor agonists are the preferred treatment option. The authors conclude that these therapeutic recommendations rely on the accurate and precise determination of the CGR and are only valid if the C-peptide results are comparable between clinical chemistry laboratories.
In summary, these reports demonstrate the multiple utilities of C-peptide in the clinical setting including prognosis, diagnosis and classification, therapeutic management, and the prediction of vascular complications in prediabetic individuals and individuals with diabetes. Ultimately, these applications need to be validated through prospective clinical trials.
C-Peptide as a Marker of β-Cell Dysfunction in Clinical Trials
Studies have shown that stimulated C-peptide gradually decreases before the clinical diagnosis of type 1 diabetes.20,36 The TrialNet study examined the longitudinal changes of C-peptide and metabolic parameters from preclinical stages through and beyond clinical diagnosis. 37 C-peptide decline becomes significant approximately six months before diagnosis and continues to decline for about a year after diagnosis. In these studies, stimulated C-peptide values were typically expressed as the area under the curve (AUC), measured over a 2-hour period. The preference for AUC response over time, rather than single time-point measurements, is due to its ability to capture the total C-peptide response. Previous studies have demonstrated that AUC provides more consistent results than fasting C-peptide, establishing the MMTT AUC as the gold standard for assessing beta-cell function. 38 For data analysis, C-peptide data is typically log-transformed due to its skewed distribution and lack of normality, which can complicate the interpretability of C-peptide concentrations. At the same time, epidemiologists continue to develop more advanced models. For example, the recently proposed Quantitative Response (QR) model incorporates not only C-peptide but also additional confounding factors, aiming to more accurately reflect beta-cell secretion. 39 These approaches are methodologically distinct from earlier studies, such as the landmark DCCT study, which considered only fasting or single-point stimulated C-peptide concentrations (at 90 minutes). 40 All these changes in C-peptide metrics are aimed at better capturing the pathophysiological changes in type 1 diabetes progression.
C-peptide is increasingly recognized as a prognostic marker, especially with recent advancements in disease-modifying therapies for type 1 diabetes. Thus, a meta-analysis of 21 immunotherapy trials provides strong evidence supporting C-peptide levels as a reliable surrogate endpoint. 41 In all studies, β-cell function was assessed using the meal-stimulated AUC of C-peptide, involving a total of 1315 adults (≥18 years) and 1396 children (<18 years) with type 1 diabetes. This expanded participant pool increases the statistical power of the analysis, offering more definitive evidence compared to previous studies. The improvements in HbA1c are directly proportional to the extent of C-peptide preservation. A 55% preservation of C-peptide is associated with a 0.64% reduction in HbA1c, while maintaining 76% of initial C-peptide levels enables nearly all participants to achieve optimal glycemic targets. A recent study compiling results from large clinical trials, including DCCT, Epidemiology of Diabetes Interventions and Complications (EDIC), Scottish Diabetes Research Network Type 1 Bioresource (SDRNT1BIO), and Collaborative Islet Transplant Registry (CITR), supports the use of C-peptide as a measurable endpoint alongside widely accepted outcomes such as reductions in HbA1c and microvascular complications for disease-modifying therapies. 29 C-peptide may offer advantages in modern trials over other endpoints, as hypoglycemia is less of a concern with CGM in place, HbA1c levels often remain below 7% during the first year of stage 3 type 1 diabetes, and microvascular complications take a long time to develop. 42
The Food and Drug Administration (FDA) approval process for new immunotherapies is time-consuming, and without clear benefits, progress can be stalled. As a result, teplizumab, the first successful agent for individuals in stage 2 of type 1 diabetes, has only recently advanced to stage 2 of the regulatory process. 43 This development can be seen not only as a golden opportunity for beta-cell preservation therapies but also as a pivotal moment for the broader adoption of C-peptide as a surrogate outcome in other studies. 44 It took time for C-peptide to gain acceptance as a surrogate marker in beta-cell preservation trials for assessing treatment efficacy and disease progression. However, epidemiological studies often prioritize a broader perspective over technical nuances, leading trial designs to overlook or insufficiently address the details of measurement procedures, such as C-peptide quantification. There is variability in assay selection, eligibility criteria based on C-peptide thresholds, and methodologies for endpoint determination. These inconsistencies in measurements, combined with some ambiguity in findings, may create challenges in interpretation for clinicians—particularly for practicing physicians who rely on a clear translation of trial results before definitive guidelines are established. As evidence of C-peptide utility continues to accumulate, further steps toward standardizing trial methodologies are expected, enhancing cross-study comparability and benefiting all stakeholders.
Why has C-peptide not yet been widely recognized as a biomarker comparable to HbA1c? In addition to the long adoption period that HbA1c has undergone, a key reason for its widespread acceptance is that it was clearly shown from the beginning to have clinical benefits. The DCCT study demonstrated that once HbA1c exceeded 6.5%, the likelihood of developing retinopathy in the following years increased rapidly. 45 This strong correlation between HbA1c and clinical outcomes and subsequent standardization of HbA1c has established HbA1c as an important endpoint in trials. In contrast, the longitudinal association of C-peptide with complications reflects a more gradual progression compared to HbA1c. As a result, interpreting models that incorporate C-peptide in clinical trials is more complex and requires a nuanced approach.
Limited Information on the C-Peptide Assay Used and the Validity of Obtained Values
A systematic review including 515 publications found that C-peptide measurements were mentioned only in 32%, 54%, and 14% of type 1, type 2, and other specific diabetes types, respectively. 46 Only half of the studies specified the assay used, and few provided technical or analytical specifications of the C-peptide test. Data on measurement and variation of the C-peptide assay were mentioned only in 2% and 11% of the publications, respectively. In 22% of the reports, the C-peptide concentration was not even documented. A major problem of all these studies is the lack of C-peptide concentration, which may serve as a cut-off value, and essentially no information on the C-peptide assays used is provided. Therefore, it remains unclear if the different C-peptide values obtained for the various trials are due to different cohorts or due to the different assays used or both.
Reference Intervals
Clinical chemistry laboratories are required to establish reference intervals for their methods, generally defined as the central 95% of laboratory values from a healthy population. A comparison of C-peptide reference intervals from multiple open sources reveals substantial inter-laboratory differences in C-peptide ranges (Table 1). The lower limit of the reference interval ranges from 0.165 to 0.364 nmol/L, while the upper limit varies even more widely, ranging from 0.596 to 1.5 nmol/L for fasting C-peptide. Since some essential information is missing—such as sample material, the analytical method (assays used), and the cohort used to establish the reference ranges—it is difficult to determine whether the variability is due to biological or analytical factors, or both. Indeed, in this example, each laboratory could establish its own reference intervals tailored to the local population. However, the situation is not significantly better even for manufacturer-determined intervals. For instance, the ADVIA Centaur XPT and Immulite 2000 Xpi assays show a twofold difference at the high end—1.27 nmol/L vs. 2.35 nmol/L—which is surprising, given that both assays come from the same company and are calibrated using the same WHO reference material. 47
Examples of Fasting C-Peptide Reference Ranges (nmol/L) From Several Clinical Laboratories, According to Their Website.
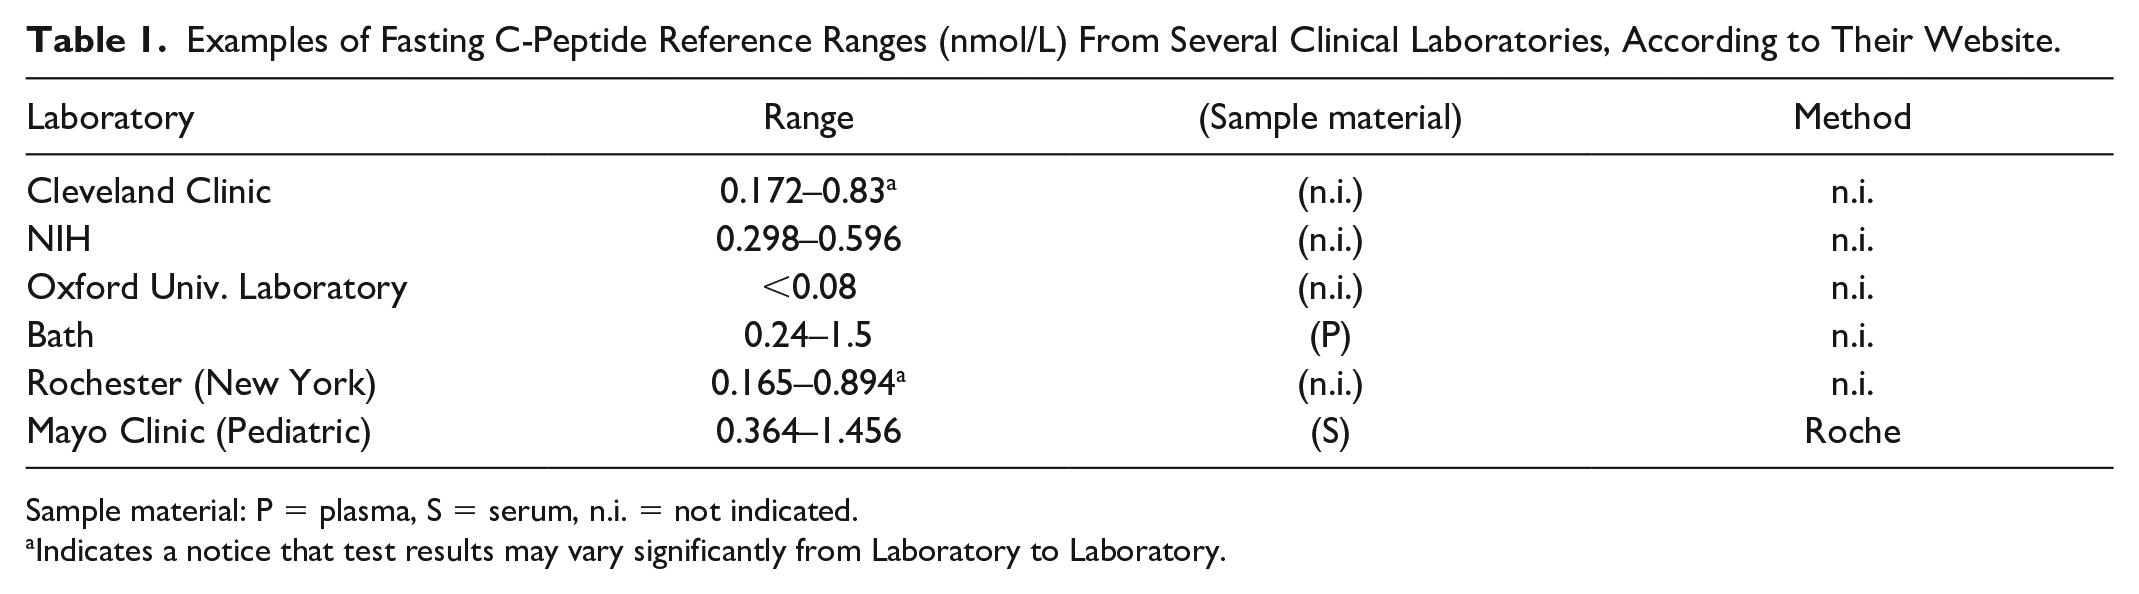
Sample material: P = plasma, S = serum, n.i. = not indicated.
Indicates a notice that test results may vary significantly from Laboratory to Laboratory.
Studies on C-peptide reference intervals are essential to support the broader adoption of C-peptide testing in clinical laboratories. Unfortunately, only a limited number of studies have established reference intervals for C-peptide. One such study focused on a Danish urban population, including 590 participants without diabetes. 48 The authors established two reference intervals for participants without prediabetes, based on WHO and ADA criteria, respectively: 0.376 to 1.479 nmol/L and 0.372 to 1.299 nmol/L. For all participants without diabetes, the interval was reported as 0.379 to 1.631 nmol/L. Fasting C-peptide levels were measured with the Cobas e411 analyzer (Roche Diagnostics). The authors acknowledge that the classification of individuals as without diabetes was based solely on fasting glucose and HbA1c levels, without a review of their medical records. Another study, conducted on the Korean population, included 1532 healthy, non-pregnant participants after excluding those with diseases based on their medical history. 49 For participants with HbA1c <5.7% (the ADA criterion for prediabetes), the reference interval was 0.6 to 2.46 ng/mL (0.199-0.814 nmol/L) for fasting C-peptide and 2.2 to 10.39 ng/mL (0.728-3.440 nmol/L) for oGTT at 120 minutes, as measured by the Atellica IM from Siemens Healthcare Diagnostics.
In theory, a standardized assay can provide universal reference intervals if the reference population is well-defined and representative. This allows a reference interval, once established by the manufacturer, to be more easily adopted by different laboratories. Since conducting validation studies to determine reference intervals can be costly, requiring the enrollment of 120 participants, it is advantageous to utilize manufacturer-provided or published reference intervals instead of deriving new ones. 50 While laboratory verification may still be necessary, a smaller sample size of just 20 participants is sufficient. 51
When reporting reference intervals, it is essential to incorporate both pre-analytical and analytical variables. These include the sample type (plasma or serum), sample handling conditions, the analytical method used, whether fasting or stimulated C-peptide measurements were taken, and the source of the reference values if derived from existing literature. 52 In addition, factors such as body mass index (BMI), age, or kidney function can affect C-peptide values (https://cpeptide.org/assets/cpeptide2016.pdf). Another critical aspect, often not thoroughly described during reporting or establishing reference ranges, is the selection criteria for the reference population. The definition of a “representative” healthy population can vary. Therefore, it is crucial to rigorously describe the process for establishing reference intervals, as this will aid in drafting guidelines on C-peptide and its broader applications.
C-Peptide Assay Discrepancies
In 2001, an ADA workshop recommended global standardization of C-peptide assays. 19 Later, the National Institutes of Health (NIH) and Centers for Disease Control and Prevention (CDC) supported this initiative, which continues to be coordinated by the University of Missouri. 18 This initiative was motivated by discrepancies observed in C-peptide measurements across different laboratories participating in clinical trials. The committee’s first study involved inter-assay and inter-laboratory comparisons across 15 laboratories in seven countries. 53 Ten methods, including radioimmunoassays and immunoassays, were compared using 14 heparin plasma samples. At least six methods were calibrated by the manufacturers using the WHO material 84/510. Two recalibration strategies were explored: one based on WHO material and another on four serum-based calibrators. The WHO material was serially diluted by each laboratory to prepare calibrators. In contrast, serum-based calibrators were assigned values using the same immunoassay, and these values were subsequently used for recalibration. The application of serum-based calibrators significantly improved inter-assay and inter-laboratory agreement, whereas calibration using WHO-based calibrators did not reduce discrepancies. Before recalibration, the standard deviations (SD) for inter-laboratory and inter-method variations ranged from 0.090 to 0.225 (95% confidence interval [CI]). After recalibration with serum samples, the range narrowed to 0.0 to 0.061 (95% CI) and no longer overlapped with the original range. This study was the first to demonstrate the importance of matrix-appropriate calibrators for the proper harmonization of C-peptide assays.
When the Liquid Chromatography-Mass Spectrometry (LC-MS) method for C-peptide became available to the standardization committee, another comparative study was conducted to examine how LC-MS could reduce discrepancies. 9 This study involved 15 laboratories across five countries and assessed nine different C-peptide assays. Eight serum samples were selected as calibrators, with values assigned by the LC-MS method. An additional 32 serum samples were then analyzed by each assay, both before and after recalibration using the eight calibrators. Prior to recalibration, statistically significant differences between laboratories were observed, with least-squares means ranging from 1.55 to 1.95, and all methods consistently overestimated C-peptide values compared to LC-MS. After recalibration, these differences were no longer statistically significant, and the range narrowed to 0.93 to 1.02. These results indicated that mass spectrometry-assigned values for serum samples significantly reduced discrepancies among methods. The reference method was later established at the University of Missouri, registered in the Joint Committee for Traceability in Laboratory Medicine (JCTLM), and calibrated against the National Metrology Institute of Japan (NMIJ) certified reference material (CRM) C-peptide material to establish a metrological traceability chain. 9 A more recent study from the group examined the effect of recalibration using the LC-MS reference method on 13 of the most frequently used C-peptide assays. 54 In this study, all measurements and recalibration procedures were conducted by the manufacturers themselves, following their standard protocols. The study was designed by initially sending a set of 20 serum samples to each manufacturer. Subsequently, another set of 20 serum samples was sent, accompanied by LC-MS-assigned values for the first set. Each manufacturer was instructed to recalibrate their assays based on the first set and provide both non-recalibrated and recalibrated values for the second set to assess the effect of standardization. Before recalibration, an overestimation compared to the reference method was evident across all assays, indicating a consistent systematic bias in all methods. Despite most of the assays (11 out of 13) being originally calibrated against the same 84/510 WHO C-peptide CRM, discrepancies among the assays were evident. After recalibration, 6 of 13 assays achieved full equivalence with the reference method assessed by the Passing-Bablok analysis. The remaining seven methods demonstrated partial agreement, either in terms of slope or intercept. Recalibration using the reference method reduced the systematic bias of each method relative to the reference method and decreased the disagreement among individual sample results across commercial methods. Another finding is that the situation does not seem to have changed regarding discrepancies in current assay results when compared to data from an older study. 55 This is somewhat disappointing, as we had expected some technological progress over more than a decade. Overall, the situation can be explained by the continued application of non-commutable C-peptide reference material by manufacturers.
Several other groups have independently examined C-peptide discrepancies. A survey conducted by sending five pooled serum samples to 94 clinical laboratories in China demonstrated significant discrepancies among C-peptide methods. 56 Laboratories in the study operated different measurement systems, represented by various manufacturer platforms and platform series. For example, the Roche Cobas system was represented by the e601, e602, e801, and E411 series. While the coefficient of variation (CV) within individual measurement systems was below 7%, the CV for inter-laboratory and inter-measurement system comparisons was 16.4% and 24.5%, respectively. After recalibration of three samples using two samples with the highest and lowest C-peptide values (calculated as the mean across all laboratories), the inter-measurement CV decreased from 31.6%, 22.1%, and 20.2% to 10.4%, 2.1%, and 4.6%, respectively. This study highlights that, in the absence of a reference method, harmonizing assays using pooled samples can reduce discrepancies. However, the accuracy of the results may still be questionable, as calibrators were assigned based on mean immunoassay values.
A recent study compared five commonly used platforms for C-peptide quantification in Germany. 47 Although all C-peptide assays were traceable to the same WHO 84/510 standard, the obtained C-peptide values varied significantly, with the largest difference reaching 36% between the two assay systems. Notably, a discrepancy was observed even between platforms from the same manufacturer; the Siemens Immulite 2000 XP and Siemens ADVIA Centaur XPT differed by 24.4%.
The effect of an error of 30% in C-peptide determination is illustrated by the following considerations: a difference of 30% between different assays would lead to a range of 140 to 260 pmol/L for the suggested cut-off of 200 pmol/L and 420 to 780 pmol/L for the suggested cut-off of 600 pmol/L, respectively. Thus, a patient with a true C-peptide of 200 pmol/L who obtains a C-peptide result of 160 pmol/L, this result will be interpreted as low, while a result of 240 pmol/L measured in another laboratory will be interpreted as not decreased, ie, “normal.” Thus, based on these C-peptide values, a diabetologist would start an insulin treatment when the patient has obtained a result of 160 pmol/L, while the same patient would not receive an insulin treatment when a C-peptide value of 240 pmol/L was determined. The corresponding considerations are also valid for the upper C-peptide cut-off.
All studies have been revealing a persistent issue of discrepancies among C-peptide assays over the last two decades. It seems evident that the situation will not improve on its own. Meanwhile, numerous clinical trials on type 1 diabetes, where C-peptide is used to monitor disease progression or treatment response, are ongoing.
Standardization can be achieved by incorporating a proper calibration scheme into manufacturers’ assay workflows. One way to accomplish this is by using calibrators based on serum samples, known as secondary reference materials, with values assigned by a reference method. This reference scheme is essential to ensuring assay comparability and achieving accurate C-peptide values.
Current Status of C-Peptide Standardization
There is sometimes a misconception that standardization is achieved once comparison studies are performed and the reference method is registered with the JCTLM. However, published studies highlighting discrepancies and the development of a reference method represent only the initial stage of the standardization process. The ultimate goal is the global recalibration of assays by each manufacturer. After this recalibration is implemented, clinical laboratories conducting these tests are advised to regularly participate in accuracy-based external quality surveys. For C-peptide testing, this should involve serum samples assigned by LC-MS reference methods. This practice helps monitor assay changes that may occur between different method generations or even between lots. Ideally, a certification system—such as the National Glycohemoglobin Standardization Program (NGSP) for HbA1c or the CDC program for lipids—could be introduced, enabling manufacturers to demonstrate alignment with the reference system to their customers. This would enhance transparency and ensure consistent assay performance.
From our experience, the most challenging part of the program is finding a laboratory that can support a long-term reference method and collaborate on method comparisons and value assignments. This difficulty is likely due to the limited funding available for such activities, as they are not well supported by traditional funding sources, which tend to prioritize more exploratory and high-profile research. Even when a reference method is registered in the JCTLM, it does not necessarily mean that the method is still active. Often, once method development studies are completed and published, the method is not maintained or updated. This is especially true for LC-MS methods, which are highly sensitive to changes and may face challenges in long-term support. As a result, these types of programs are typically coordinated by large institutions with substantial federal funding. A notable example is the CDC, which supports several programs focused on lipids, hormones, and apolipoproteins.57,58 Therefore, academic labs are an unusual setting for this type of activity. The University of Missouri Diagnostic Diabetes Laboratory is one of the few exceptions. Implementing the C-peptide program was possible due to the lab’s extensive experience with HbA1c standardization and continuous support from the National Institute of Diabetes and Digestive and Kidney Diseases (NIDDK)/NIH.
Currently, everything is in place for C-peptide: a reference method, an established primary reference material, a secondary calibrator set, and a complete traceability chain. In addition, we have industry collaboration for method comparison and regular feedback regarding their methods. However, a critical piece is still missing—companies remain reluctant to recalibrate their methods, creating a dead end for these efforts. Two key factors could drive manufacturers to take action: regulatory requirements and business initiatives, both influenced by demands from health care providers.
The criteria for assay approval depend on the local regulatory body, whether it is the FDA, European Notified Bodies, or other country-specific agencies. In Europe, regulators require traceability due to the 1998 European Union (EU) Directive which states that “The traceability of values assigned to calibrators and/or control materials must be assured through available reference measurement procedures and/or available reference materials of a higher order.” However, a significant challenge remains: despite traceability having already been established—with all C-peptide assays traceable to WHO reference materials (WHO 84/510 and WHO 13/146)—discrepancies persist. These reference materials do not mimic patient samples, and each immunoassay measures them differently compared to the serum matrix, resulting in non-commutability.
Manufacturers are often reluctant to modify or recalibrate their assays, due to the associated costs. In addition, if the changes are significant, they may be required to undergo additional regulatory approval. Thus, standardization efforts remain stalled in limbo. Clinical trials and C-peptide measurements present a classic chicken-and-egg dilemma: without accurate measurements, drawing definitive conclusions from clinical trials and meta-analyses—which are essential for establishing guidelines—becomes unattainable. Conversely, without established guidelines, there is little regulatory pressure to improve measurement accuracy and consistency. Another complication is that the translation of clinical trial findings into guidelines is a lengthy and costly process, further delaying progress.
Another concern is the widely used diagnostic threshold for C-peptide levels in type 1 diabetes, set at 0.2 nmol/L. This threshold was established based on data from the DCCT. However, its relevance today is uncertain. The original DCCT measurements were conducted using a radioimmunoassay with the M-1230 anti-C-peptide antibody from Nova Industri. 40 Since this method is no longer available, it is unclear how these historical measurements compare to results obtained using modern analytical techniques.
Aside from the discussed analytical variations, a main problem arises when cut-off values are derived from clinical trials and advocated for clinical care. In clinical trials well-defined cohorts are studied. Not unexpected, the different clinical trials reported different cut-off values. For example, insulin resistance cut-off values vary from 1.55 (in a study from Thailand; n = 738; age: ≥35 years, normal BMI, and fasting glucose) to ≥3.8 (in a study from France, n = 1153, age: 35-64 years, population-based sample). 59 Since cut-off values may depend on gender, age, ethnicity, metabolic stage, and so on, the reported cut-off values should be used with cause in the daily clinical practice.
Conclusion: Need for C-Peptide Standardization
C-peptide is an emerging biomarker for assessing β-cell function and is increasingly used in the classification, diagnosis, and management of diabetes. However, the slow progress in the standardization of its measurement limits its clinical utility. Assay discrepancies hinder the application of diagnostic cut-offs and compromise therapeutic decisions and clinical trial outcomes. Although reference methods and materials, as well as a traceability scheme, are now available, widespread implementation remains stalled. Action is needed, as standardized C-peptide measurement is essential for advancing both diabetes care and research.
Footnotes
Abbreviations
DM, diabetes mellitus; ADA, American diabetes association; EASD, European association for the study of diabetes; WHO, world health organization; MODY, maturity-onset diabetes of the young; LADA, latent autoimmune diabetes in adults; CGM, continuous glucose monitor; GST, glucagon stimulation test; MMTT, mixed-meal tolerance test; oGTT, oral glucose tolerance test; CGR, C-peptide/glucose ratio; AUC, area under the curve; EDIC, epidemiology of diabetes interventions and complications; SDRNT1BIO, scottish diabetes research network type 1 bioresource; CITR, collaborative islet transplant Registry; FDA, food and drug administration; NIH, national institutes of health; CDC, centers for disease control and prevention; LC-MS, liquid chromatography-mass spectrometry; NMIJ, national metrology institute of Japan; CRM, certified reference material; NGSP, national glycohemoglobin standardization program; NIDDK, national institute of diabetes and digestive and kidney diseases; JCTLM, joint committee for traceability in laboratory medicine.
Declaration of Conflicting Interests
The author(s) declared no potential conflicts of interest with respect to the research, authorship, and/or publication of this article.
Funding
The author(s) received no financial support for the research, authorship, and/or publication of this article.