
Abstract
Background:
Glycemic variability in diabetes secondary to pancreatic diseases (pancreatic diabetes) remains unclear. We compared glycemic control and variability in patients with pancreatic diabetes and a matched group of individuals with type 2 diabetes using continuous glucose monitoring (CGM).
Methods:
We included 30 patients with chronic pancreatitis and insulin-treated secondary diabetes and 30 individuals with insulin-treated type 2 diabetes (matched on HbA1c, age, and sex). Participants wore a blinded CGM for 20±2 days. Glycemic variability was assessed using coefficient of variation (CV), standard deviation (SD), mean amplitude of glycemic excursions (MAGE), and continuous overall net glycemic action (CONGA) at 1 and 2-hour intervals. Glycemic control was evaluated based on time spent in predefined glucose ranges: >250 mg/dL, 181 to 250 mg/dL, 70 to 180 mg/dL (target range), 54 to 69 mg/dL, and <54 mg/dL. CGM parameters were compared between groups.
Results:
All CGM-derived measures of glycemic variability (CV, SD, MAGE, CONGA1, and CONGA2) were significantly higher in patients with chronic pancreatitis and diabetes compared to individuals with type 2 diabetes (P < 0.01). Patients with chronic pancreatitis spent more time with glucose >250 mg/dL (8.8% vs 3.1%, P = 0.008), less time in the target range (70-180 mg/dL; 56.7% vs 68.5%, P = 0.044), and more time at 54-69 mg/dL (0.2% vs 0.0%, P = 0.041). Their glycemia risk index for hyperglycemia was also higher (25.5 vs 16.5, P = 0.033).
Conclusion:
Patients with pancreatic diabetes have higher glycemic variability than individuals with type 2 diabetes despite comparable levels of HbA1c.
Introduction
Pancreatic diabetes is a form of secondary diabetes that arises due to pancreatic diseases, primarily acute and chronic pancreatitis.1-3 As the incidence of pancreatic diseases rises, pancreatic diabetes has become the second most common form of diabetes in adults, surpassed only by type 2 diabetes.2,4
The pathophysiology of diabetes in chronic pancreatitis is complex, involving the destruction of pancreatic islet cells, leading to insulin deficiency and impaired glucagon secretion.5,6 Maldigestion and malnutrition because of exocrine insufficiency leads to diminished secretion of gut-derived incretin hormones, potentially reducing insulin secretion. 7 In addition, some patients exhibit type 2 diabetes-like risk factors, adding another layer of complexity.8-10 This complex pathophysiology distinguishes diabetes in chronic pancreatitis from other diabetes subtypes and is often described as “brittle diabetes,” characterized by significant glucose fluctuations and heightened hypoglycemia risk. 5 ,11-13 This characterization mainly relies on epidemiological studies reporting excess hypoglycemia risk in patients with pancreatic diabetes compared to other diabetes subtypes.
While there is strong epidemiological evidence on decreased glycemic control and heightened hypoglycemia risk in pancreatic diabetes, research on glycemic variability in this context remains limited.11,14 Few studies have specifically examined glycemic variability using continuous glucose monitoring (CGM) with inconsistent findings, likely due to differences in study populations and methodologies.15-17 Some have focused on heterogeneous populations, including patients with various underlying pancreatic diseases and unclear diagnostic criteria. 15 Others have not considered the impact of insulin therapy, a key factor influencing glycemic variability. 16 Moreover, previous research has not consistently accounted for differences in baseline glycemic control when comparing pancreatic diabetes to other diabetes subtypes. This leaves it unclear whether the observed differences in glycemic variability are characteristics of pancreatic diabetes or simply a reflection of different glycemic control, i.e., in baseline hemoglobin A1c (HbA1c) levels.15-17
To address these limitations, we aimed to evaluate glycemic variability and control, as determined by CGM, in a well-defined group of patients with chronic pancreatitis and insulin-treated diabetes, compared to individuals with insulin-treated type 2 diabetes matched on HbA1c, age, and sex. We hypothesized that patients with chronic pancreatitis and insulin-treated diabetes would exhibit higher glycemic variability and impaired glycemic control compared to individuals with type 2 diabetes.
Methods
Study Design
This was a prospective observational cohort study carried out between September 2022 and February 2024 at the Center for Pancreatic Diseases, Department of Gastroenterology and Hepatology, Aalborg University Hospital, Denmark. The North Denmark Region Committee on Health Research Ethics approved the protocol (N-20210064), and the study adhered to the Declaration of Helsinki and Good Clinical Practice. Written informed consent was obtained before enrollment. For comparison, data from The Diabetes teleMonitoring of patients in insulin Therapy (DiaMonT) trial (NCT04981808), an open-label randomized controlled trial investigating the effect of telemonitoring on glycemic control in individuals with type 2 diabetes, were used. The DiaMonT trial was conducted at Steno Diabetes Center North Denmark and Steno Diabetes Center Zealand from August 2021 to November 2023. 18
Participants
Individuals aged 18 years or older with a diagnosis of chronic pancreatitis and insulin-treated diabetes were included in the study. Chronic pancreatitis was defined according to the M-ANNHEIM criteria, requiring at least one of the following: pancreatic calcifications, moderate or severe pancreatic ductal changes, persistent and marked exocrine insufficiency, or characteristic histological findings. 19 Diabetes was diagnosed based on the World Health Organization’s criteria. 3 Exclusion criteria included history or suspicion of abdominal malignancies, prior pancreatic, gastric, or vagal nerve surgeries, autoimmune pancreatitis, recent hospitalization for acute pancreatitis (within four weeks before enrollment), or glucocorticoid use in the past month (excluding inhaled forms for chronic respiratory diseases). In addition, individuals diagnosed with diabetes before the age of 18 were excluded. For comparison, 30 individuals with insulin-treated type 2 diabetes were selected from the usual care group of the DiaMonT trial. We used 1:1 matching with the chronic pancreatitis group based on HbA1c, age, and sex, without replacement, following a hierarchical order with HbA1c as the primary variable, followed by age and sex. The inclusion criteria for the type 2 diabetes group were ≥18 years of age, a diagnosis of type 2 diabetes for at least one year, and insulin treatment. Full inclusion and exclusion criteria for the DiaMonT trial are provided elsewhere. 18
Demographic and Clinical Characteristics
At baseline, clinical and demographic data were collected through medical records and patient interviews, including age, sex, and body mass index (BMI). Additional data included duration of chronic pancreatitis, chronic pancreatitis etiology, presence of exocrine insufficiency, and use of enzyme replacement therapy. Diabetes-related variables included disease duration, diabetes-related complications, insulin regime and dose, and noninsulin glucose-lowering treatments. Fecal elastase was measured unless a prior result (<10 µg/g) or a recent (≤6 months) result was available. Blood samples were analyzed for HbA1c, hemoglobin, and creatinine; the latter was used to estimate glomerular filtration rate (eGFR). Anemia was defined as hemoglobin <130 g/L for men and <120 g/L for women, and categorized as mild (110–129 g/L for men, 110–119 g/L for women), moderate (80–109 g/L), or severe (<80 g/L). 20 Impaired renal function was defined as eGFR < 60 mL/min/1.73 m². 21 For the type 2 diabetes group, the same clinical and demographic data and diabetes-related variables were collected, including baseline HbA1c. To evaluate insulin sensitivity, the estimated glucose disposal rate (eGDR) was calculated using the formula: 19.02 − (0.22 × BMI [kg/m2]) − (3.26 × hypertension) − (0.61 × HbA1c [%]). 22
Continuous Glucose Monitoring
Participants were equipped with a Dexcom G6 CGM (Dexcom, San Diego, California, USA), providing glucose levels (ranging from 40 to 400 mg/dL) every five minutes. The CGM was set to capture glucose concentrations without displaying the data to the participant (i.e., blinded assessment). Participants wore the device for 20 ± 2 days and were instructed to manage their diabetes and monitor blood glucose levels according to their usual practices. The type 2 diabetes group followed the same CGM protocol, with participants in the usual care group of the DiaMonT trial using blinded CGM for the first 20 ± 2 days. As in the chronic pancreatitis group, CGM data were not visible to participants and did not influence diabetes management.
Outcomes
The outcomes of this study were CGM metrics over the 20 ± 2-day period, compared between patients with chronic pancreatitis and insulin-treated diabetes and individuals with insulin-treated type 2 diabetes. These metrics included the number of days with active CGM use, mean glucose concentration (mg/dL), glucose management indicator, and time spent in various glucose ranges: above 250 mg/dL, between 181 and 250 mg/dL, within the target range (70-180 mg/dL), between 54 and 69 mg/dL, and below 54 mg/dL. In addition, the glycemia risk index for hyperglycemia and hypoglycemia was calculated. 23 Glycemic variability was assessed using multiple metrics. The coefficient of variation (CV) provides a measure of variability relative to the mean glucose level. Standard deviation (SD) captures overall variability. The mean amplitude of glycemic excursions (MAGE) highlights significant excursions. Continuous overall net glycemic action (CONGA) over 1-hour and 2-hour intervals was used to assess short-term variations in glucose.24-26 In addition, the proportion of patients with chronic pancreatitis and diabetes with a CV ≥36%, compared to individuals with type 2 diabetes, was investigated, as CV ≥36% is considered indicative of high glycemic variability. 26
A sensitivity analysis within the chronic pancreatitis group examined the effect of insulin regimen (basal alone vs basal plus bolus) on CGM metrics, considering its potential impact on glycemic control and variability. The impact of renal impairment and anemia on HbA1c values and potentially on the results was assessed through two sensitivity analyses: one excluding patients with renal impairment and their matched controls, and the other excluding those with moderate or severe anemia and their matched controls. Finally, the concordance between HbA1c and the glucose management indicator was assessed in each diabetes group to evaluate the reliability of HbA1c as a marker of glycemic control.
Statistical Analysis
Data are reported as counts (percentages), means (SD), or medians (interquartile range [IQR]). Differences in CGM metrics between the two diabetes groups were investigated using the Wilcoxon rank-sum test. The proportion of participants with a CV ≥ 36% was compared using Fisher’s exact test. Three sensitivity analyses were performed using the Wilcoxon rank-sum test: (1) basal insulin therapy versus basal plus bolus therapy, (2) excluding participants with moderate to severe anemia, and (3) excluding participants with renal impairment. Concordance between HbA1c and the glucose management indicator was evaluated in each diabetes group using the concordance correlation coefficient and Bland-Altman plots, including calculations of the limits of agreement. Statistical significance was set at P < 0.05. Statistical analyses and data management were carried out using SAS 9.4 (SAS Institute), Stata 17.0 (StataCorp), and R 4.3.2 (R Development Core Team).
Results
Of the 69 patients with chronic pancreatitis and insulin-treated diabetes screened, 30 were included. Exclusions occurred due to patient refusal (n = 30) or not meeting eligibility criteria (n = 9). Demographic and clinical characteristics are presented in Table 1. The chronic pancreatitis group had a mean age of 64.2 (SD 8.7) years, with 76.7% being male. Alcohol was the most common cause (63.3%), and exocrine insufficiency was present in 82.8% of patients. At baseline, 87% had normal eGFR, and 60% had normal hemoglobin. Among those with anemia, 9 (75%) had mild anemia, and 3 (25%) had moderate anemia. A matched group of 30 individuals with type 2 diabetes, selected based on HbA1c, age, and sex, was also included. Their mean age was 63.4 (SD 7.4) years, and 83.3% were male. A flowchart is presented in Figure 1.
Demographic and Clinical Characteristics of Patients With Chronic Pancreatitis and Insulin-Treated Diabetes and a Matched Group of People With Insulin-Treated Type 2 Diabetes.
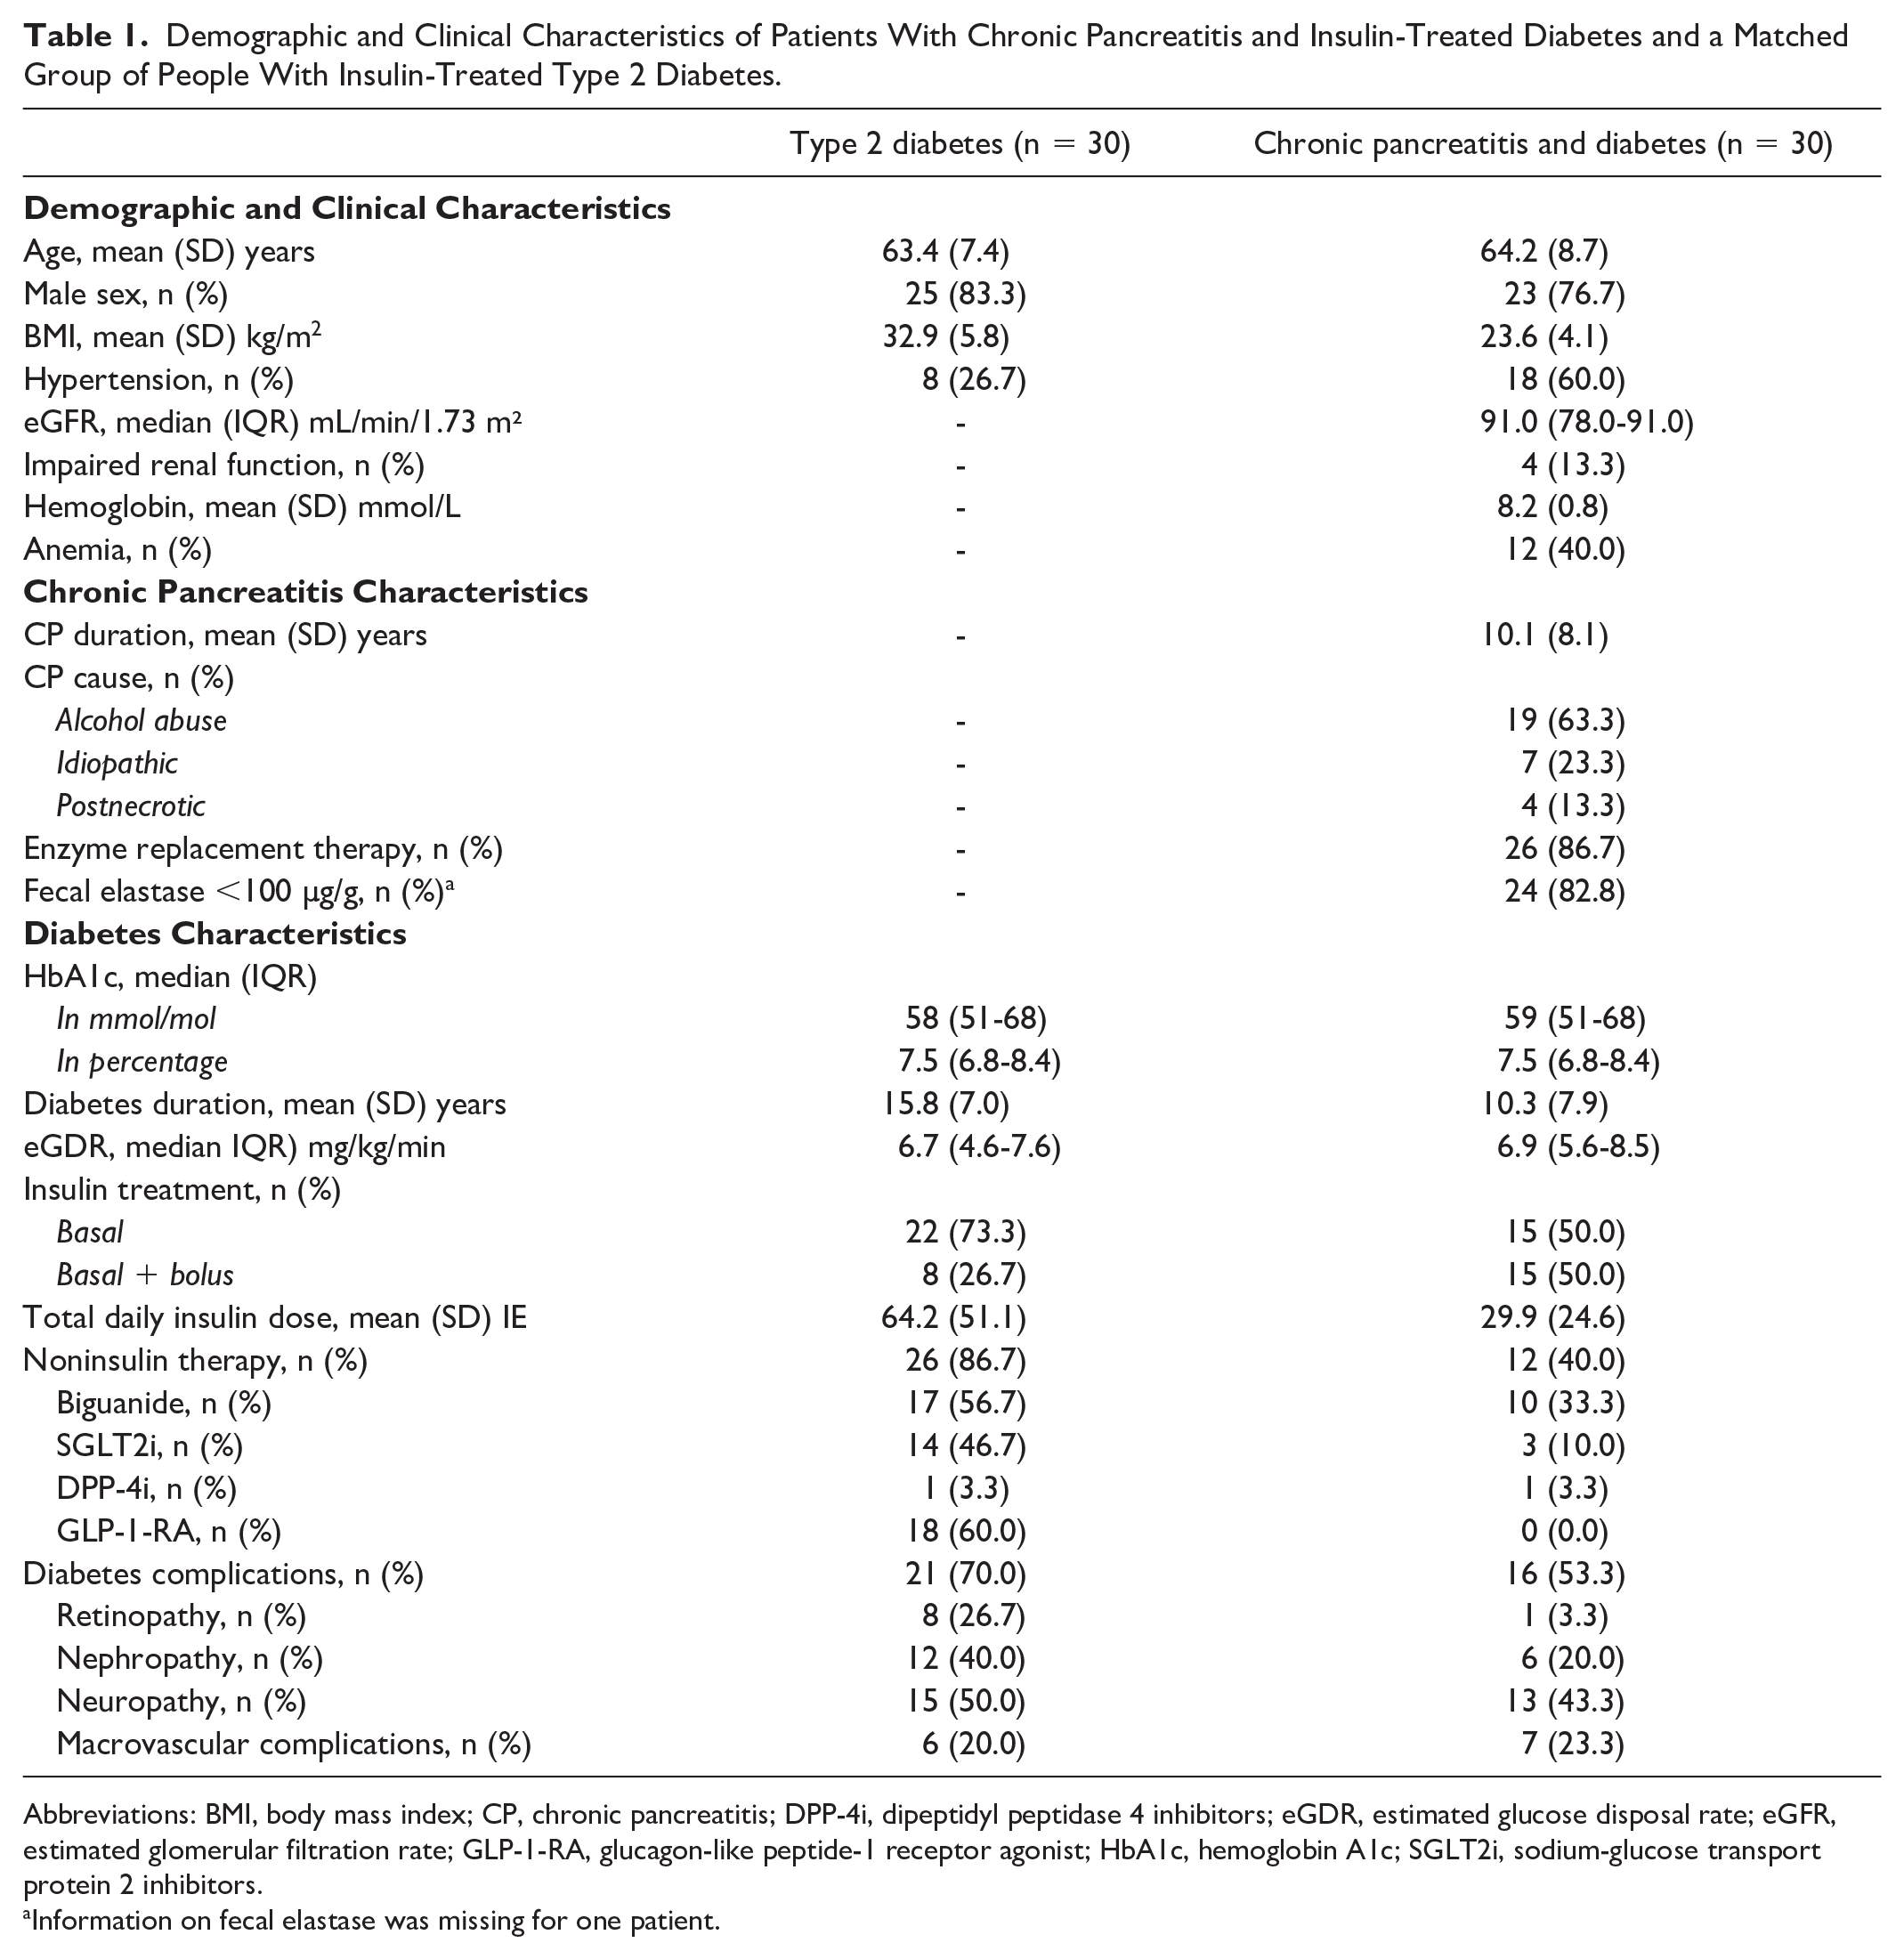
Abbreviations: BMI, body mass index; CP, chronic pancreatitis; DPP-4i, dipeptidyl peptidase 4 inhibitors; eGDR, estimated glucose disposal rate; eGFR, estimated glomerular filtration rate; GLP-1-RA, glucagon-like peptide-1 receptor agonist; HbA1c, hemoglobin A1c; SGLT2i, sodium-glucose transport protein 2 inhibitors.
Information on fecal elastase was missing for one patient.
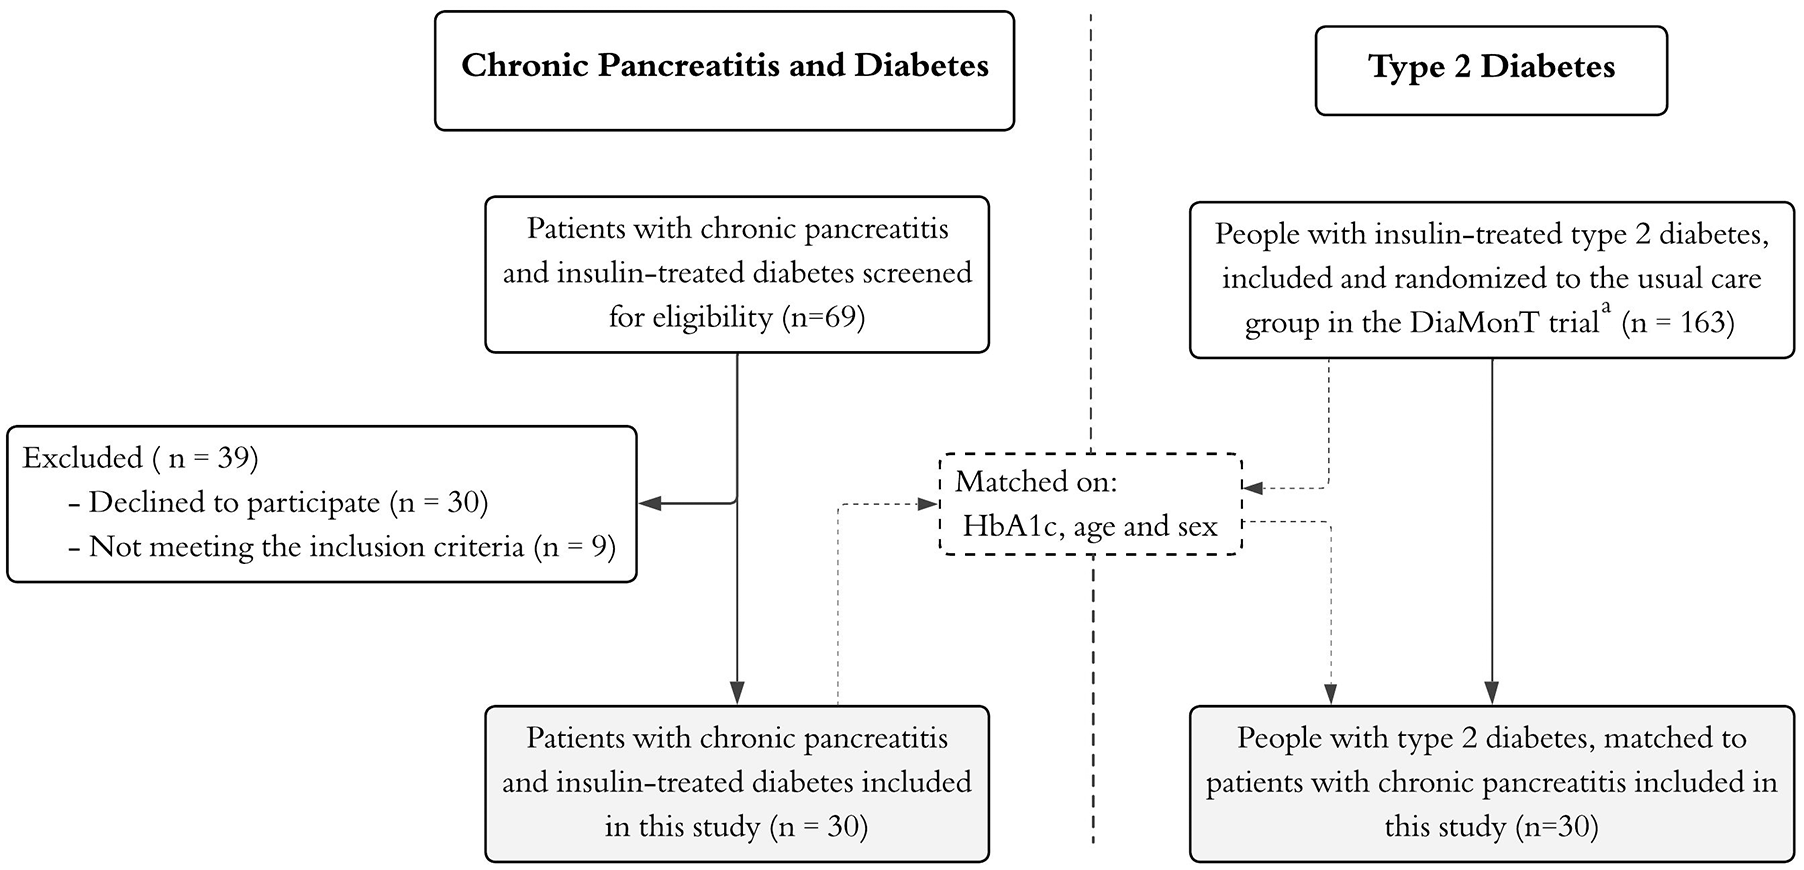
Study flowchart.
Median HbA1c levels were similar between patients with chronic pancreatitis and diabetes and individuals with type 2 diabetes (7.5% [IQR 6.8–8.4]) (Figure 2a). Compared to the type 2 diabetes group, patients with chronic pancreatitis and insulin-treated diabetes had a lower mean BMI (23.6 [SD 4.1] kg/m² vs 32.9 [SD 5.8] kg/m²), shorter mean diabetes duration (10.3 [SD 7.9] years vs 15.8 [SD 7.0] years), lower mean insulin use (29.9 [SD 24.6] IE vs 64.2 [SD 51.1] IE), and less frequent use of noninsulin therapy (40.0% vs 86.7%).
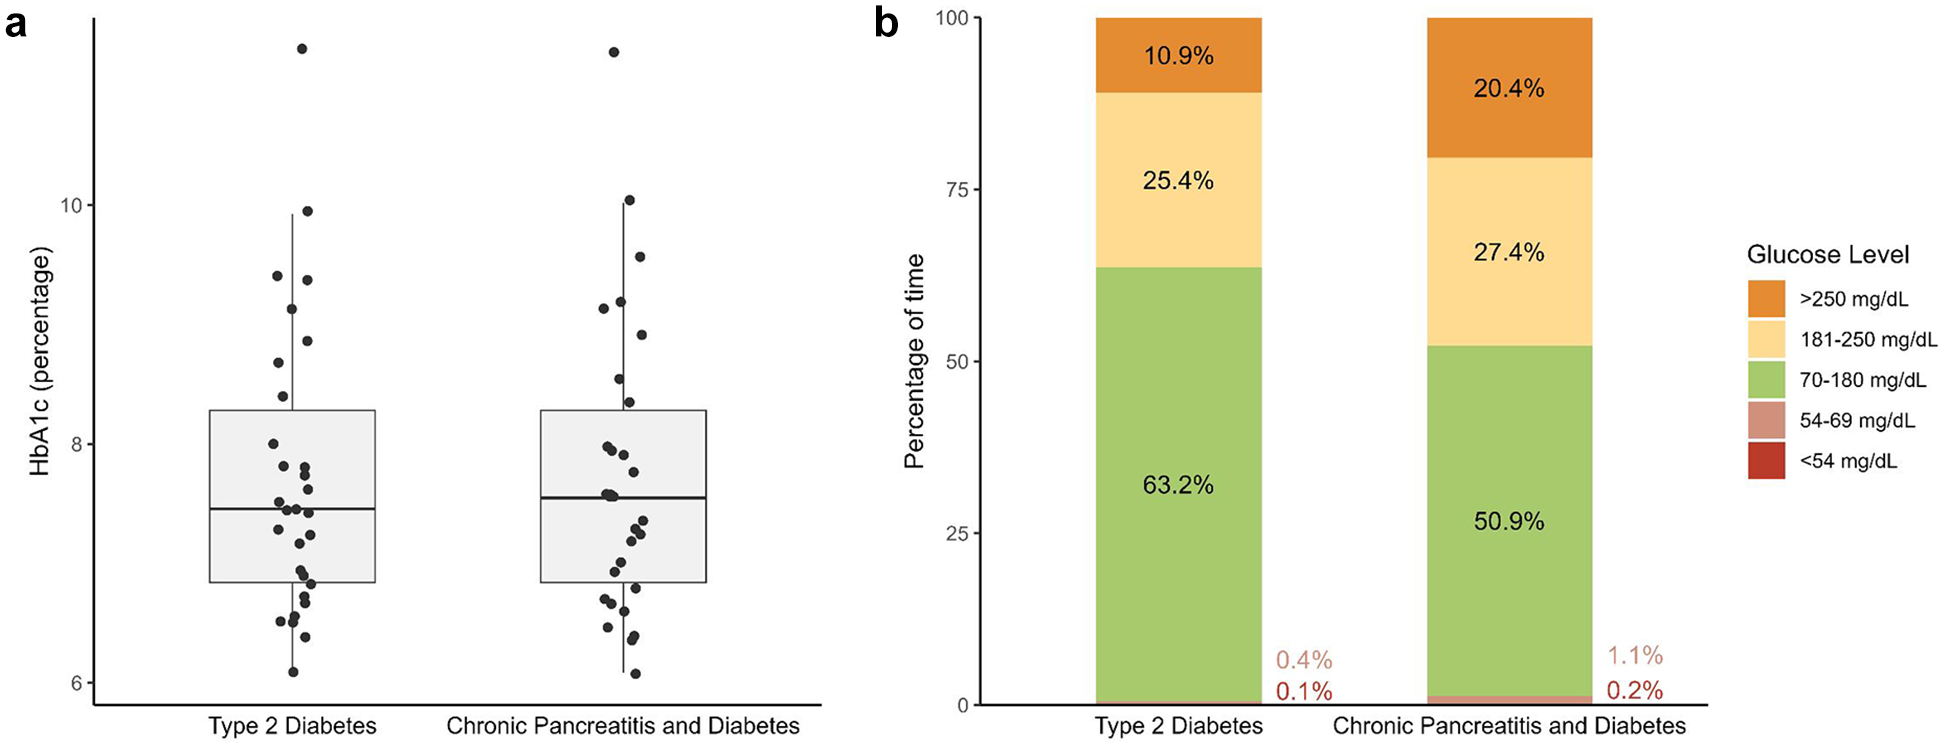
Baseline hemoglobin A1c (HbA1c) and continuous glucose monitoring (CGM) parameters in patients with chronic pancreatitis and insulin-treated diabetes and a matched group of individuals with insulin-treated type 2 diabetes. (a) Baseline HbA1c levels, with individual values shown as dots. (b) The percentage of time spent at different glucose levels measured by CGM.
Insulin Sensitivity
The median eGDR did not differ significantly between the two groups (6.9 [IQR 5.6–8.5] vs 6.7 [IQR 4.6–7.6], P = 0.14).
Glycemic Control in Pancreatic Diabetes vs Type 2 Diabetes
Table 2 presents CGM metrics over the 20 ± 2-day period in patients with chronic pancreatitis and insulin-treated diabetes and individuals with type 2 diabetes. Compared with type 2 diabetes, patients with chronic pancreatitis spent significantly more time with glucose levels >250 mg/dL (8.8% vs 3.1%, p = 0.008), less time within the target range of 70-180 mg/dL (56.7% vs 68.5%, p = 0.044), and more time with glucose levels between 54-69 mg/dL (0.2% vs 0.0%, p = 0.041). The glycemic risk index for hyperglycemia was also higher in the chronic pancreatitis group (25.5 vs 16.5, p = 0.033). Figure 2b illustrates the percentage of time spent at distinct glucose levels in both groups. Despite these contrasts, mean glucose levels over the 20-day CGM period were similar between the two groups (173.5 mg/dL vs 161.3 mg/dL, p = 0.100).
Glycemic Parameters Obtained From CGM in Patients With Chronic Pancreatitis and Insulin-Treated Diabetes and a Matched Group of People With Insulin-Treated Type 2 Diabetes.
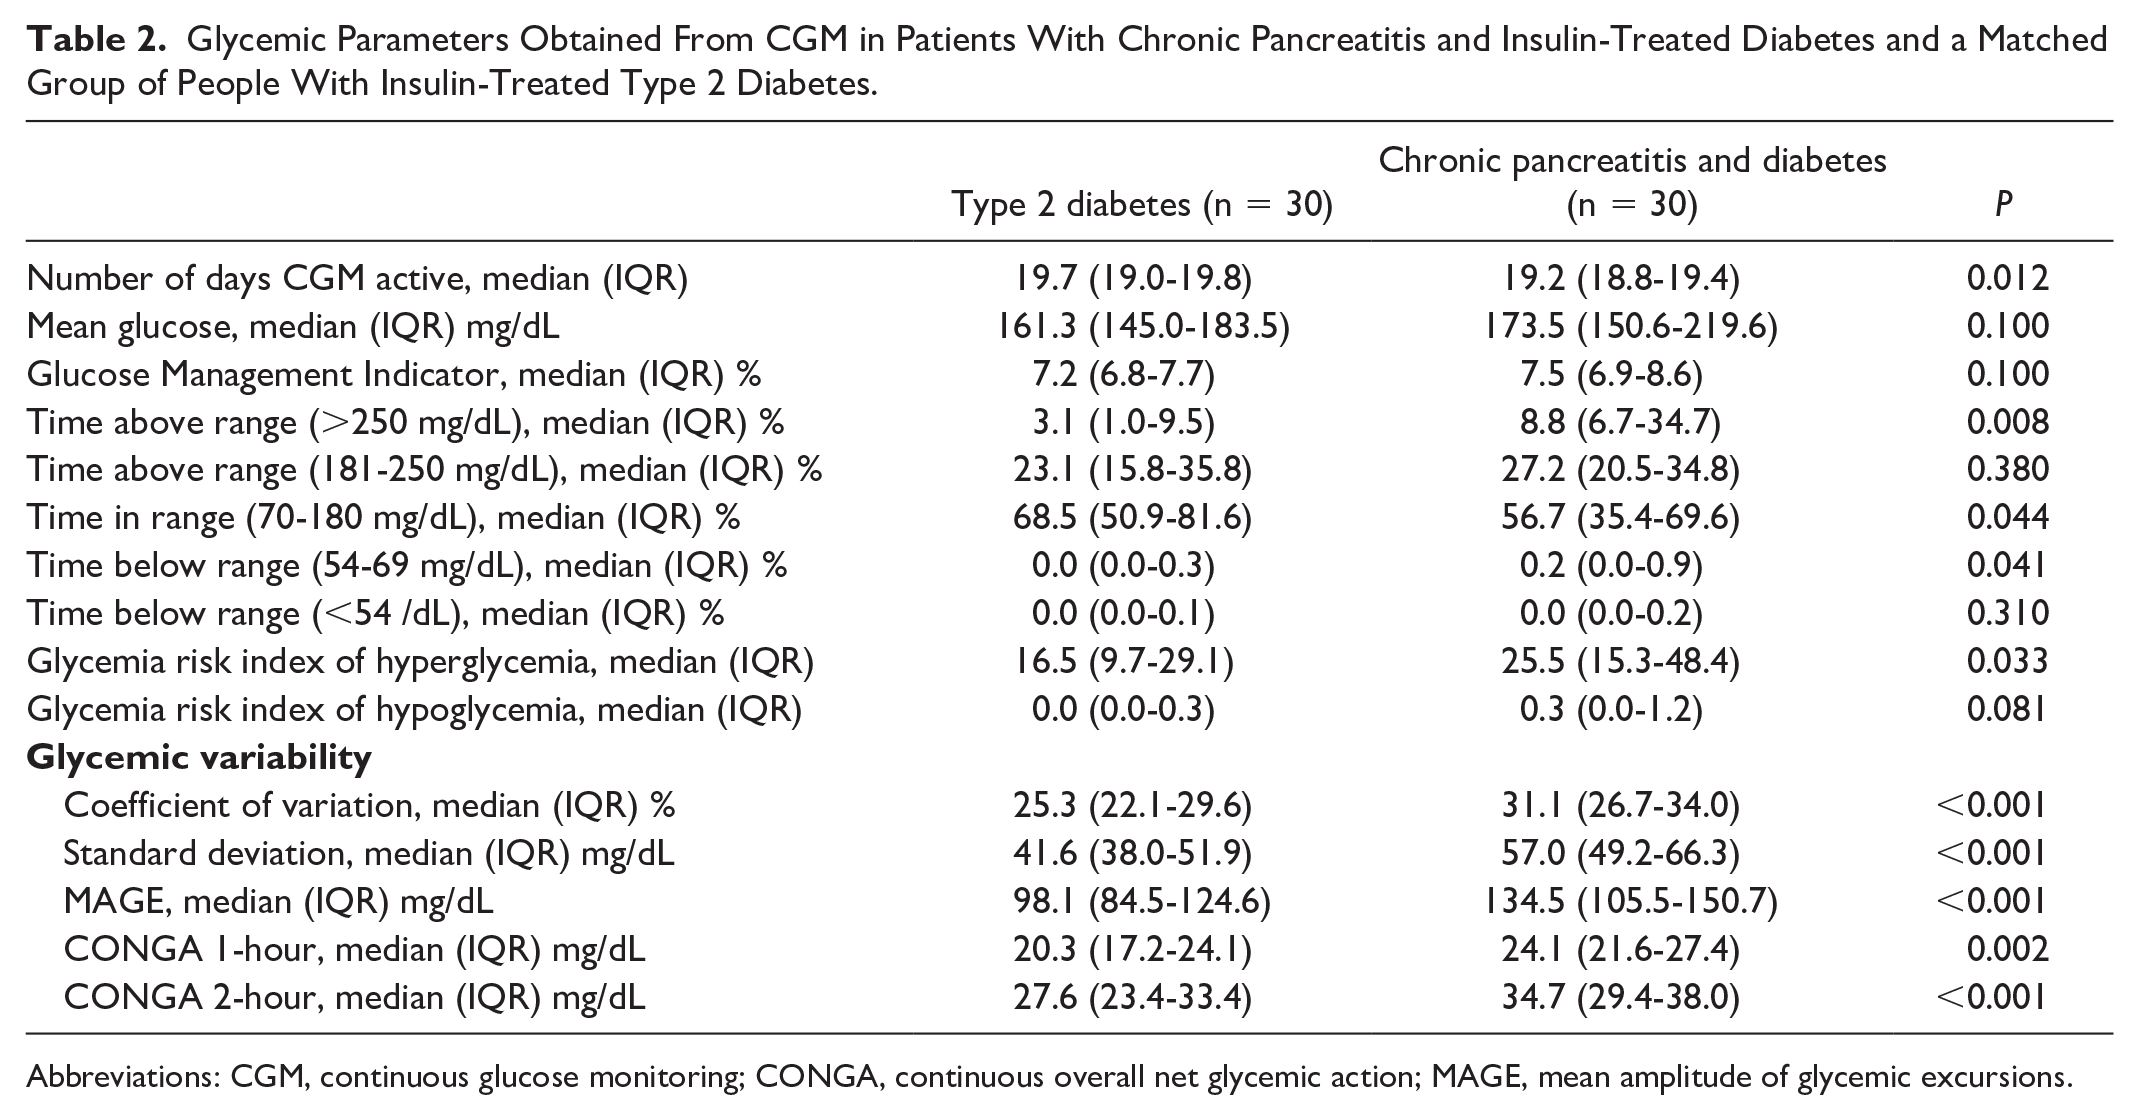
Abbreviations: CGM, continuous glucose monitoring; CONGA, continuous overall net glycemic action; MAGE, mean amplitude of glycemic excursions.
In the sensitivity analyses within the chronic pancreatitis group, no significant difference in glycemic control was observed between those using basal insulin therapy only and those using basal plus bolus insulin (Supplemental Table S1). Among patients with chronic pancreatitis, the concordance correlation coefficient was 0.72, with a mean difference of -0.11% and limits of agreement ranging from -1.83 to 1.61%. In individuals with type 2 diabetes, the coefficient was 0.73, with a mean difference of 0.28% and limits of agreement ranging from -1.26 to 1.82%. Bland-Altman plots are provided in Supplemental Figure S1.
Glycemic Variability in Pancreatic Diabetes vs Type 2 Diabetes
Patients with chronic pancreatitis and insulin-treated diabetes had higher glycemic variability across all CGM metrics compared to individuals with type 2 diabetes (Table 2). Notably, the CV was 31.1% (IQR 26.7%–34.0%) in chronic pancreatitis versus 25.3% (IQR 22.1%–29.6%) in type 2 diabetes (p<0.001) (Table 2 and Figure 3), with similar differences observed for SD, MAGE, CONGA1, and CONGA2 (Table 2). The proportion of participants with a CV ≥36% was 20% in the chronic pancreatitis group vs 6.7% in the type 2 diabetes group (p=0.250).
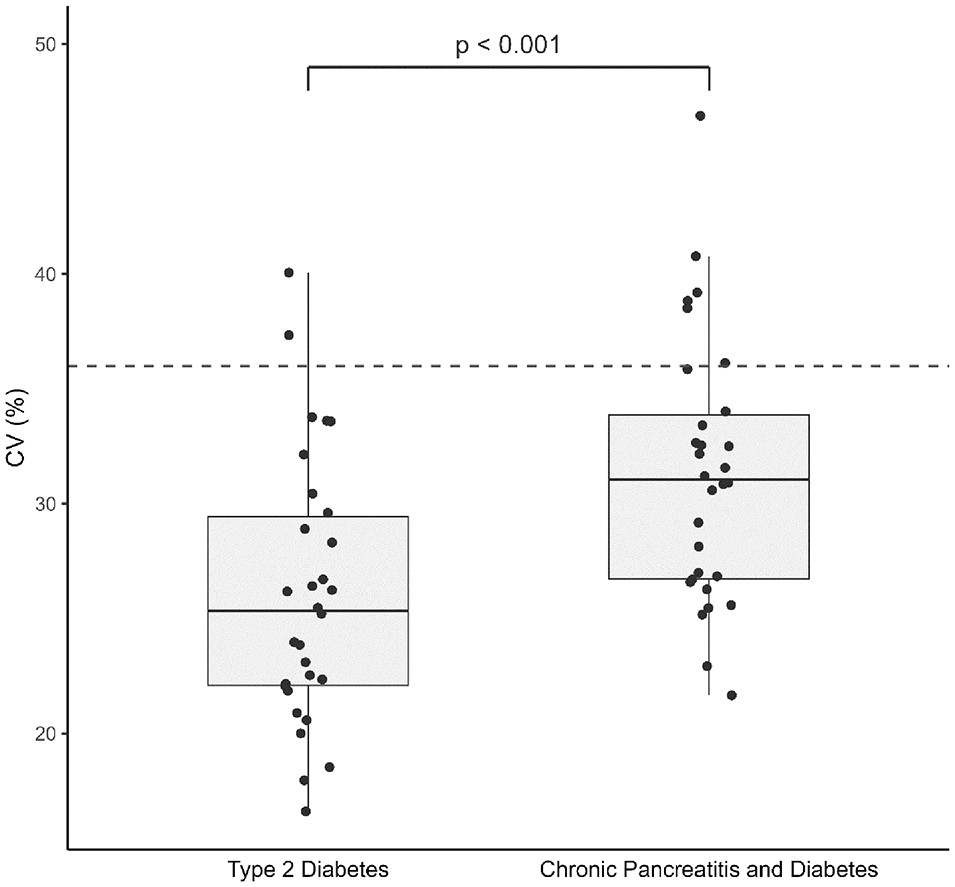
Comparison of glycemic variability as measured by continuous glucose monitoring in patients with chronic pancreatitis and insulin-treated diabetes and a matched group of individuals with insulin-treated type 2 diabetes. The coefficient of variation (CV) for each group is displayed, with individual data points represented as dots and boxplots illustrating the distribution of CV values. The dashed gray line represents the cutoff value of 36%, marking the threshold between normal and high glycemic variability.
Figure 4 presents the mean daily CGM curve of two matched pairs of individuals, illustrating the differences in daily glycemic variability despite these individuals being matched on HbA1c, age, and sex. Glucose fluctuations in patients with chronic pancreatitis and diabetes reflect both nocturnal declines in glucose levels and possible postprandial changes.
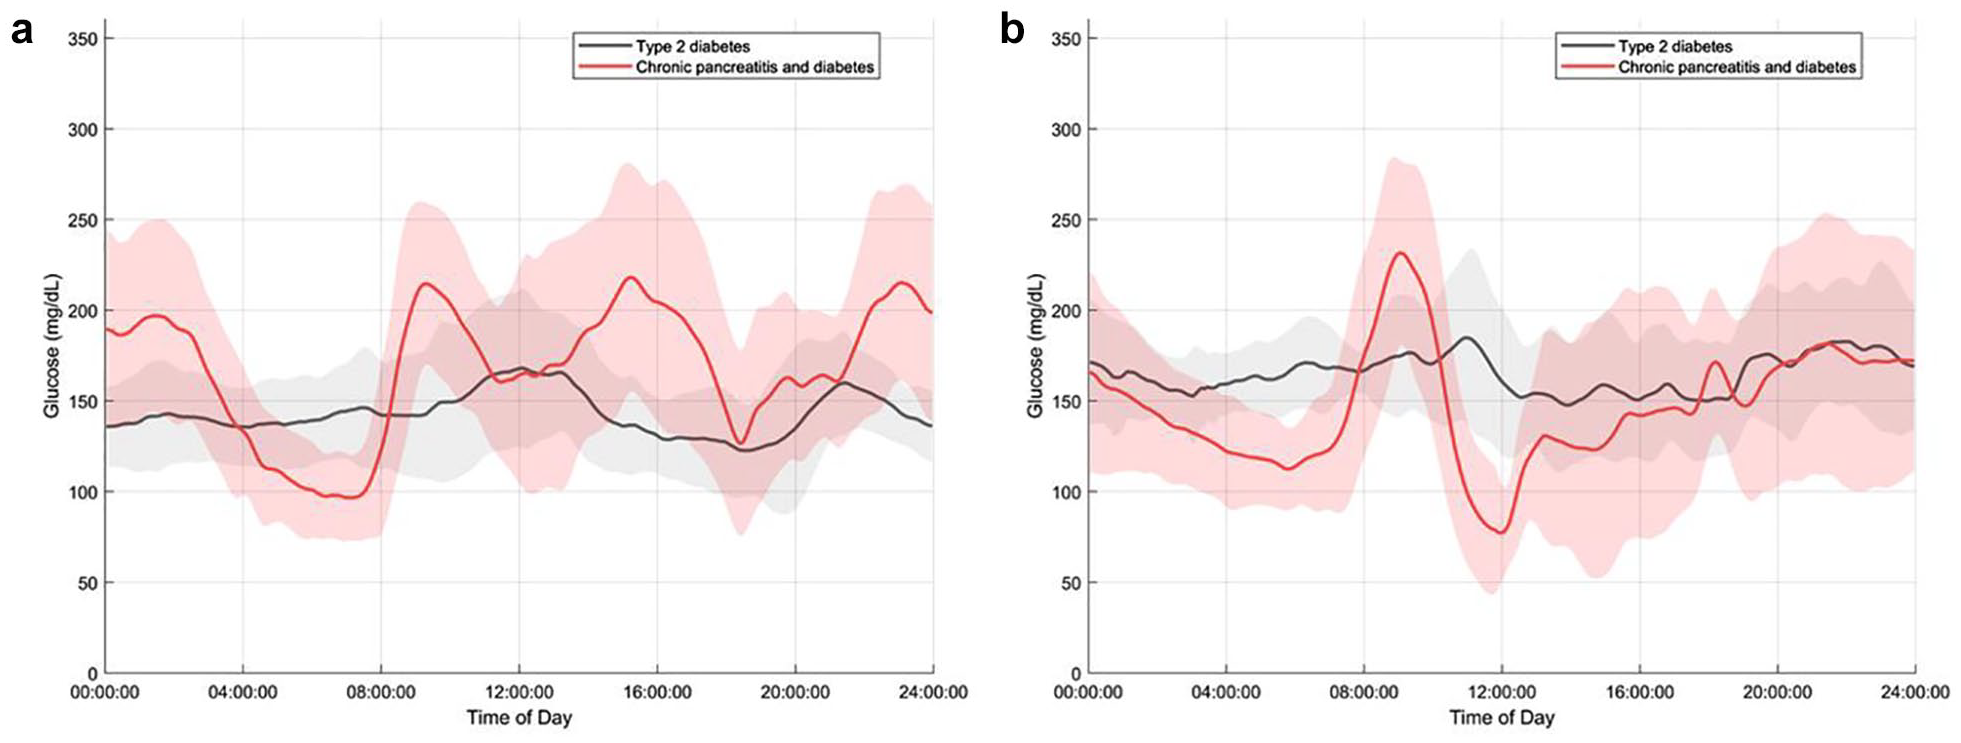
Mean (SD) daily continuous glucose monitoring (CGM) curve for individual patients with chronic pancreatitis and diabetes and type 2 diabetes matched on hemoglobin A1c (HbA1c), age, and sex based on 20±2 days: (a) A 63-year-old male with chronic pancreatitis and insulin-treated diabetes (red line) and a baseline HbA1c of 47 matched with a 62-year-old male with type 2 diabetes (black line) and a baseline HbA1c of 48. (b) A 69-year-old male with chronic pancreatitis and insulin-treated diabetes (red line) and a baseline HbA1c of 51 matched with a 67-year-old male with type 2 diabetes (black line) and a baseline HbA1c of 51.
In sensitivity analyses within the chronic pancreatitis group, no significant difference in glycemic variability was observed between those using basal insulin therapy only (median CV 31.6% [IQR 27.0–35.9]) and those using basal plus bolus therapy (median CV 30.9% [IQR 26.3–32.5]) (p = 0.420) (Supplemental Table S1). Furthermore, the difference in glycemic variability between patients with chronic pancreatitis and diabetes and those with type 2 diabetes remained significant in sensitivity analyses, excluding those with renal impairment or moderate to severe anemia (Supplemental Tables S2 and S3).
Discussion
This study used CGM to assess glycemic control and variability in a well-characterized group of patients with pancreatic diabetes secondary to chronic pancreatitis and individuals with type 2 diabetes matched on HbA1c, age, and sex. Despite similar baseline HbA1c levels, patients with pancreatic diabetes exhibited more glycemic variability, spent more time above and below the target range, and less time within the target range.
Comparison With Existing Literature
Previous studies employing CGM in patients with pancreatic diabetes have reported conflicting results regarding glycemic variability.15-17 Our findings align with an Indian study on fibrocalculous pancreatic diabetes, reinforcing that glycemic variability is consistently elevated in patients with pancreatic diabetes across populations and causes. 16 Despite differences in underlying causes of chronic pancreatitis, both studies indicate that pancreatic diabetes is characterized by increased glycemic instability. However, our study provides additional clinical insights. Unlike the Indian study, which was conducted in hospitalized patients with controlled meals and limited physical activity, our outpatient setting better reflects real-world fluctuations. Furthermore, our 20-day CGM monitoring period, compared to just three days in the Indian study, aligns with current recommendations that suggest at least 14 days of CGM for reliable assessments. 27
In contrast to our findings and the Indian study, an Australian study found no difference in glycemic variability between pancreatic diabetes and type 2 diabetes. 15 Several methodological differences may explain this discrepancy. The Australian study included a heterogeneous group of causes, including patients with pancreatic cancer, pancreatic surgical procedures (Whipple’s procedure, total or distal pancreatectomy), recurrent or chronic pancreatitis, cystic fibrosis, and thalassemia, which might have reduced the ability to detect differences specific to each disease. Also, they assessed glycemic variability using only CV, whereas we used multiple metrics to capture the complexity of glucose fluctuations. Moreover, neither did they match on HbA1c, making comparisons between the two diabetes subtypes less precise. Finally, their use of flash glucose monitoring and exclusion of participants with less than 70% sensor coverage may have selectively removed individuals with poorer glycemic control and higher variability (i.e., selection bias).
Mechanisms of Glycemic Variability in Pancreatic Diabetes
The higher glycemic variability observed in pancreatic diabetes, compared to type 2 diabetes, is likely due to a combination of factors. While type 2 diabetes is primarily driven by insulin resistance and beta cell dysfunction, diabetes in chronic pancreatitis involves different mechanisms. In addition to damage to all subtypes of pancreatic islet cells, which impairs insulin and glucagon secretion, there is also often significant impairment of the exocrine pancreatic function (83% in this study). This plays a crucial role in nutrient digestion and, when compromised, can influence glucose metabolism. Exocrine insufficiency may affect glucose levels directly by altering nutrient availability and indirectly through an impaired incretin response, contributing to increased glycemic variability.5,28,29 The latter may contribute to the excessive postprandial glucose excursions observed in pancreatic diabetes. Future studies on exocrine insufficiency’s role in glycemic control and variability are needed to fully understand its impact.
Hypoglycemia is a frequent complication of pancreatic diabetes.11-13 This is likely due to a combination of impaired glucagon-mediated counter-regulation and depleted glycogen stores, a consequence of exocrine insufficiency and malnutrition. In our study, 50% of chronic pancreatitis patients received basal-bolus insulin (vs 27% in type 2 diabetes), raising the question of whether bolus therapy contributes to hypoglycemia and variability. However, our sensitivity analysis found no difference in glycemic control or variability across insulin regimens.
Clinical Implications
Pancreatic diabetes is often unrecognized and misclassified as type 2 diabetes. 30 Studies like this, highlighting differences in glycemic variability and control, emphasize the importance of distinguishing this subtype of diabetes from the much more prevalent type 2 diabetes to avoid suboptimal treatment. Given the distinct pathophysiology and glycemic patterns, treatment strategies must be tailored accordingly. Diabetes management currently relies heavily on HbA1c, but several studies have shown that HbA1c alone is insufficient for capturing glycemic variability and, consequently, the risks of hypoglycemia and hyperglycemia.31-33 As shown in this study, even when HbA1c levels are matched, differences in glycemic variability and time spent outside the target range exist. In contrast, CGM provides valuable insights into glycemic trends, allowing for more accurate assessments and personalized treatment adjustments.
Strengths and Limitations
The strengths of this study include well-characterized groups of patients with pancreatic diabetes and individuals with type 2 diabetes matched on HbA1c, age, and sex. Focusing on insulin-treated individuals allows for comparable assessments of glycemic variability and hypoglycemia, as insulin directly affects these factors. The real-world setting enhances generalizability, and the 20-day observation period with multiple glycemic variability metrics offers a comprehensive assessment.
Limitations include the lack of detailed information on dietary intake, activity levels, and insulin use during the study period, which could provide context for glycemic variability and control. Although no differences in glycemic control and variability were observed across insulin regimens, uniform treatment would have been ideal. The groups were not matched for noninsulin therapies, which may affect glycemic control and variability. However, as current guidelines recommend multimodal pharmacological treatment for type 2 diabetes, insulin monotherapy is uncommon in clinical practice, reflected in our cohort, where only four individuals in the type 2 diabetes subgroup were on insulin alone. Therefore, we were unable to undertake meaningful sub analysis focused on the impact of noninsulin therapies, and future studies with larger sample size should address this. The low hypoglycemia incidence in pancreatic diabetes is in opposition to the marked increased risk of hypoglycemia reported in epidemiological studies.11,14 This may reflect selection bias, but if the broader pancreatic diabetes population experiences more hypoglycemia, they would likely show higher variability, reinforcing our findings. Lastly, while HbA1c was used for matching, its validity in chronic pancreatitis patients warrants consideration due to factors such as maldigestion, gastrointestinal bleeding, and chronic inflammation, which can contribute to anemia and influence HbA1c levels.34,35 In this study, most patients had normal eGFR and hemoglobin levels. In addition, since the effect of anemia on HbA1c is dependent on its severity, and most anemic patients had mild anemia, the impact of anemia on HbA1c in this study was likely minimal. 36 This was confirmed in the sensitivity analysis and also reflected in the good concordance between HbA1c and the glucose management indicator.
Conclusions
In conclusion, patients with pancreatic diabetes exhibit greater glycemic variability than those with type 2 diabetes despite similar HbA1c levels. These findings reinforce the distinct nature of pancreatic diabetes and highlight the importance of recognizing its unique glycemic patterns to optimize treatment and reduce the risks associated with glycemic variability.
Supplemental Material
sj-docx-1-dst-10.1177_19322968251356239 – Supplemental material for Increased Glycemic Variability in Patients With Chronic Pancreatitis and Diabetes Compared to Type 2 Diabetes
Supplemental material, sj-docx-1-dst-10.1177_19322968251356239 for Increased Glycemic Variability in Patients With Chronic Pancreatitis and Diabetes Compared to Type 2 Diabetes by Line Davidsen, Morten Hasselstrøm Jensen, Thomas Kronborg, Stine Hangaard, Peter Vestergaard, Asbjørn Mohr Drewes, Filip Krag Knop, Simon Lebech Cichosz and Søren Schou Olesen in Journal of Diabetes Science and Technology
Footnotes
Acknowledgements
None.
Abbreviations
BMI, Body Mass Index; CGM, continuous glucose monitoring; CONGA, continuous overall net glycemic action; CV, coefficient of variation; DiaMonT, The Diabetes teleMonitoring of patients in insulin Therapy trial; eGDR, estimated glucose disposal rate; eGFR, estimated glomerular filtration rate; HbA1c, hemoglobin A1c; IQR, interquartile range; MAGE, mean amplitude of glycemic excursions; SD, standard deviation.
Declaration of Conflicting Interests
The author(s) declared the following potential conflicts of interest with respect to the research, authorship, and/or publication of this article: PV is head of research at the Steno Diabetes Center North Denmark, which is funded by an unrestricted grant from the Novo Nordisk Foundation. SLC received research funding from i-SENS and consultant fees from Roche. The remaining authors declare no conflicts of interest.
Funding
The author(s) disclosed receipt of the following financial support for the research, authorship, and/or publication of this article: This study was funded by the Steno Diabetes Center North Denmark, the A.P. Møller and Chastine Mc-Kinney Møller Foundation, Heinrich Kopp’s Grant, and the Region North Denmark Health Science Research Foundation. Dexcom, Inc. provided discounted G6 CGM equipment for the study but did not contribute to the study design, data analysis, or interpretation of the results.
ORCID iDs
Supplemental Material
Supplemental material for this article is available online.
References
Supplementary Material
Please find the following supplemental material available below.
For Open Access articles published under a Creative Commons License, all supplemental material carries the same license as the article it is associated with.
For non-Open Access articles published, all supplemental material carries a non-exclusive license, and permission requests for re-use of supplemental material or any part of supplemental material shall be sent directly to the copyright owner as specified in the copyright notice associated with the article.