
Abstract
Background:
Continuous glucose monitoring (CGM) is increasingly used in the management of diabetes, providing dense data for patients and clinical providers to review and identify patterns and trends in blood glucose. However, behavioral factors like hypoglycemia treatments (HTs) are not captured in CGM data. Hypoglycemia treatments, by definition, reduce the visibility (frequency and duration) of hypoglycemia exposure recorded by CGM, which can lead to errors in treatment management when relying solely on CGM metrics.
Methods:
We propose a method to incorporate HTs into CGM-based metrics and standardize hypoglycemia exposure quantification for a variety of HT behaviors; specifically (1) treatment proactiveness and (2) potential severity of the avoided hypoglycemia. In addition, we introduce an HT detector to identify instances of HT using in CGM data that otherwise lack HT documentation. We then use the HT-modified hypoglycemia metrics in a previously published run-to-run treatment adaptation system using CGM-based metrics.
Results:
Using in-silico data to correct time-below-range with HT, we reconstruct the avoided hypoglycemia exposure with high fidelity (R2 = .94). Our HT detector has an F1 score of 0.72 on clinical data with labeled HT. In the example run-to-run application, we reduce the average number of HT per day from 3.3 in the HT-unaware system to 1.6, while maintaining 84% time in 70 to 180 mg/dL.
Conclusion:
This new metric integrates HT behaviors into CGM-based analysis, offering a behavior-sensitive measure of hypoglycemia exposure for more robust T1D management. Our results show that HT can be seamlessly incorporated into existing CGM methods, enhancing treatment insights by accounting for HT variability.
Keywords
Introduction
Increasingly, continuous glucose monitoring (CGM) is used in the management of diabetes.1,2 These devices measure glucose values frequently throughout the day, often every 5 minutes, and can provide real-time glucose information to the user. 2 CGM data provide patient and health care providers with blood glucose and trend information throughout the day. These data allow patients and health care providers to assess glycemic control more accurately. 3 Derived metrics such as time in range (TIR), glucose variability, and average glucose, offer a more comprehensive view of a patient’s glucose levels than traditional measures like HbA1c. 4 Clinicians use this information to make adjustments to insulin therapy, oral medications, or lifestyle recommendations, addressing specific patterns like post-meal hyperglycemia or nighttime hypoglycemia.3,4 Continuous glucose monitors also help identify patients at risk for complications by tracking the frequency and duration of hypoglycemic or hyperglycemic events, allowing for timely interventions.1,4
Hypoglycemia treatments (HTs) are small amounts of carbohydrates with high glycemic index, that is, fast absorption rate, that are consumed to treat low blood glucose events. They represent a behavioral factor in the management of T1D that is not typically accounted for in CGM-based metrics. Individuals may consume HTs earlier or later during, or even before, hypoglycemic events due to hypoglycemia fear, activity level, or other factors.5,6 Hypoglycemia treatments, by definition, reduce the amount of hypoglycemic exposure; thus, they can have a profound impact in its assessment using CGM metrics (e.g. percent time below 70mg/dL). Figure 1 shows an example of an HT event and the corresponding reduction in hypoglycemia exposure.
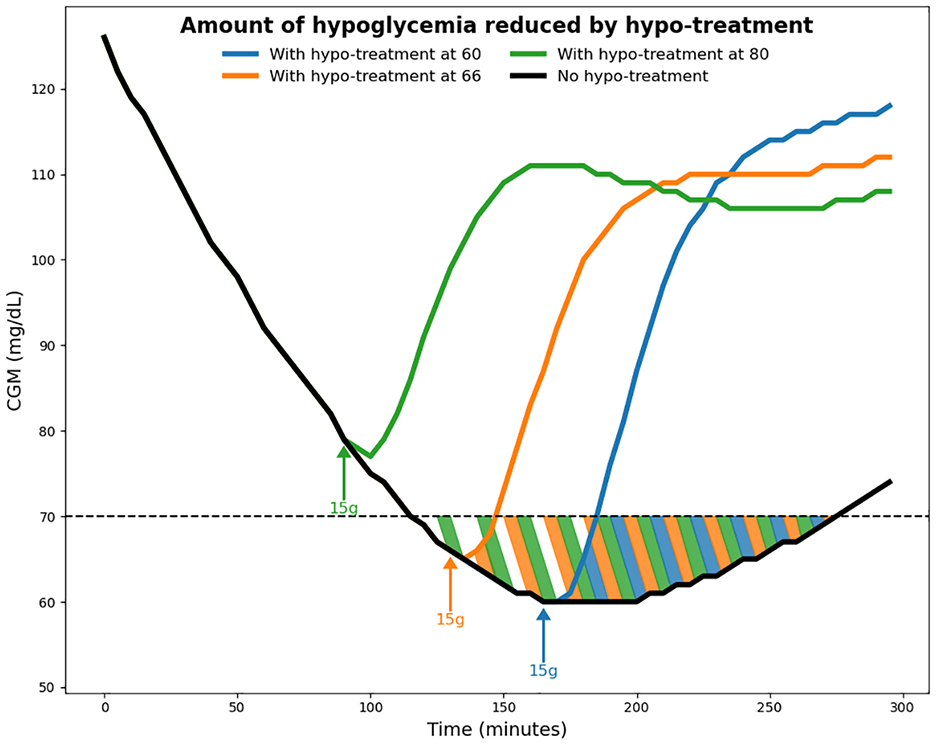
Example of a hypoglycemia treatment event. The subject consumes 15 g of carbohydrates to treat a low glucose event. The highlighted area indicates the amount of avoided hypoglycemia due to the treatment. The amount of hypoglycemia avoided depends on when the HT is consumed, where more hypoglycemia is avoided by consuming the HT earlier.
Current CGM metrics do not consider the impact of HT. Hypoglycemia treatment data can offer insights into clinically relevant hypoglycemia information such as frequency of hypoglycemic events, 7 and highlight behavioral factors that are relevant to understanding the challenges of T1D management. 6 Figure 2 shows a motivational example using data from previously published clinical trials.8,9 Based on the consensus CGM metrics (thermometer plots on the right), the two individuals are nearly identical. When we compare the top plot vs the bottom plot, the individual in the top plot consumed more HT which hides hypoglycemia. This highlights the need to develop additional metrics that can distinguish the behavioral differences between these two subjects.
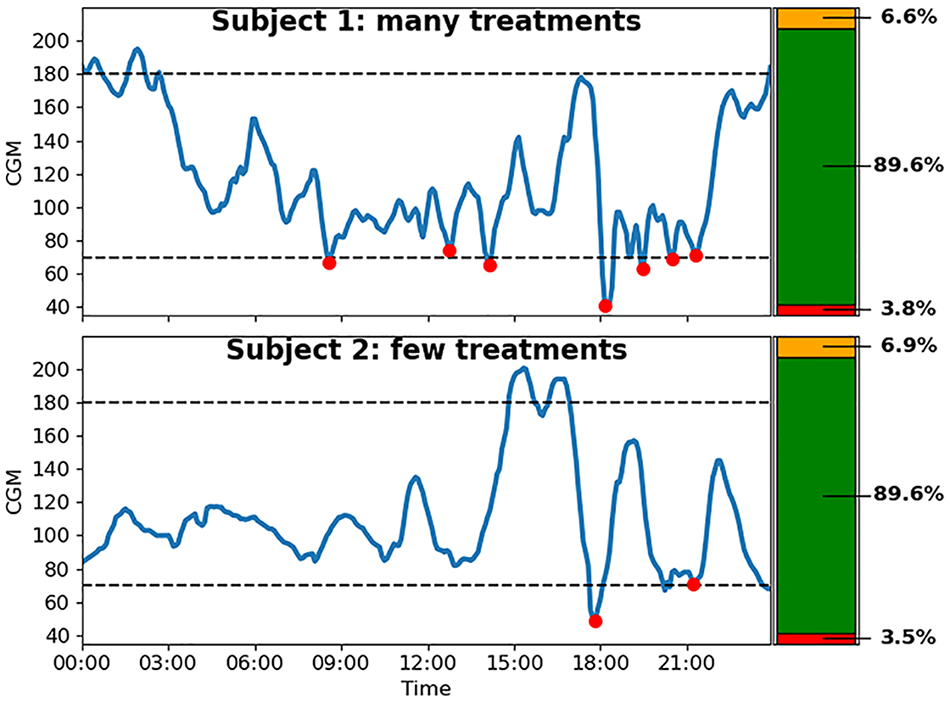
Comparison between 2 example days with many hypoglycemia treatments (top) and few hypoglycemia treatments (bottom). CGM-based metrics are identical despite behavioral differences.
Consider an extreme case where a subject consumes an HT anytime their glucose is below 85 mg/dL, only considering CGM metrics like time below range (<70 mg/dL) (TBR) would observe very low amounts of hypoglycemia exposure leading to incorrect conclusions about the effectiveness of therapy and relative insulin balance. In algorithm-based insulin therapy, this could cause the system to become increasingly aggressive, causing even more HTs to be consumed: which is the opposite of desired behavior. Accounting for HTs allows systems to better adapt to individual behavioral factors.
Many diabetes technologies including automated insulin delivery (AID), and decision support systems (DSS) are based on cost functions relying on CGM metrics; examples include reinforcement learning,10-15 run-to-run algorithms, and 16-19 model-based algorithms.20-22 Some methods consider HTs in their cost function, 23 but this introduces another objective into the cost function which can complicate tuning cost function parameters.
The aim of this work is to design a method that automatically detects HTs and incorporates them into common hypoglycemia exposure metrics such as TBR. Our goal is for this to naturally integrate with other methodologies, enabling them to adapt to variable HT behaviors without the need for extensive re-design. Our contributions are as follows:
• We present a method to quantify the amount of avoided hypoglycemia due to an HT event into common hypoglycemia exposure metrics.
• We present a method to automatically detect HTs based on CGM data, if they are not explicitly recorded.
• We demonstrate an example application of applying the modified metrics in an existing run-to-run adaptation system.
Methods
We present a method to quantify the amount of avoided hypoglycemia due to an HT event. We consider it to be primarily a function of the severity of the hypoglycemia event and the proactiveness of the treatment. The size of the HT is not included as a covariate because we assume that the HT is sufficiently large to completely recover from hypoglycemia. We use Gmin, which is the minimum glucose that would be reached if the HT was not consumed as a measure of severity, and we use GH, which is the glucose level at which the HT is consumed to gauge the proactiveness. It is expected that if a more profound hypoglycemia (e.g. Gmin < 54) is treated very proactively (e.g. GH > 70), there will be a large amount of avoided hypoglycemia, while a mild hypoglycemia that is treated late will have less. We note that Gmin cannot be observed directly in data, so it may seem better to choose another available feature such as the derivative of glucose to measure severity. However, early results indicated that Gmin was a stronger predictor of avoided hypoglycemia than glucose derivative, and Gmin can instead be estimated via glucose derivative or other features, benefiting from advancements in the expanding field of research into glucose prediction.24-28
The proposed formulation relies on information that may not be available in practice. Namely, the labels of when an HT event occurs may not be available; and Gmin is impossible to know outside of a controlled environment. We therefore also present methods to detect HT events and estimate Gmin based on CGM data.
Accounting for HTs in Hypoglycemia Exposure Metrics
We use the UVA/Padova Simulator
29
with a virtual population of 100 subjects to simulate the effect of HTs. We design a short scenario where subjects start with an initial glucose of 200 mg/dL and are given an ad-hoc bolus of insulin to reduce their glucose to Gmin. The subject basal rate is set to zero to mimic a low glucose suspend that is common in modern AID systems. A single 15 g HT is given to the subject when their glucose reaches GH. Owing to the simulated environment, the exact amount of hypoglycemia avoided due to the HT event can be computed by repeating the scenario with and without the HT. We considered a grid for
Time below range was considered as the primary metric of hypoglycemia exposure due to its prevalence in clinical guidelines and practice. 4 However, the same methodology can be applied to any CGM-based hypoglycemia metric. The goal is to approximate the function c(GH,Gmin) needed to make an adjusted metric:
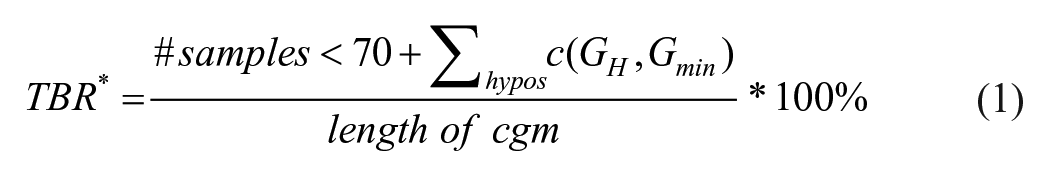
We want to approximate the function: c(GH, Gmin) as the number of samples of avoided hypoglycemia. Intuitively, this means that a single HT will have less effect over 2 weeks than over a single day. Because TBR is a threshold-based metric, based on the number of samples below 70 mg/dL, we observe in silico that in most cases treatments above 75 mg/dL fully avoid the hypoglycemia event. Thus, GH = 75 mg/dL is considered as the maximum GH for TBR, and c is held constant for values larger than 75 as hypoglycemia is completely avoided.
To test the hypothesized predictors, several functions of increasing complexity are considered to approximate c. Starting with a constant function, we then consider linear functions of: (GH), (Gmin), (GH, Gmin), and (GH, Gmin, GH*Gmin). Least squares regression was used to find the best fit and the models are compared based on the root mean squared error (RMSE), Akaike information criterion (AIC), and Bayesian information criterion (BIC).
Figure 3 shows the shape of the model as a function of GH, Gmin. GH is constrained to be greater than or equal to Gmin, which leads to the bend in the left side of the plot.
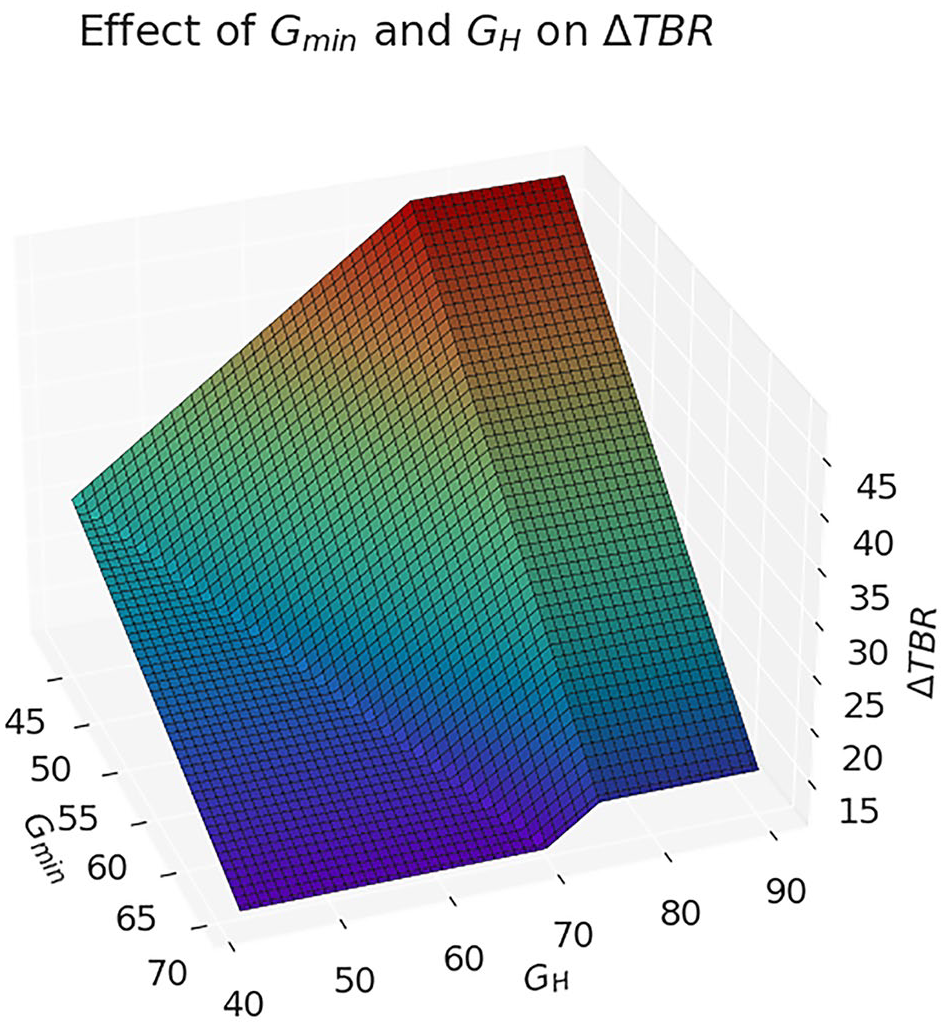
3D plot of TBR adjustment based on GH, Gmin.
It is worth noting the flexibility of the joint model for adapting to other applications. For example, if a system is already designed assuming HTs are consumed at a specific threshold, th, an auxiliary cost function can be defined as
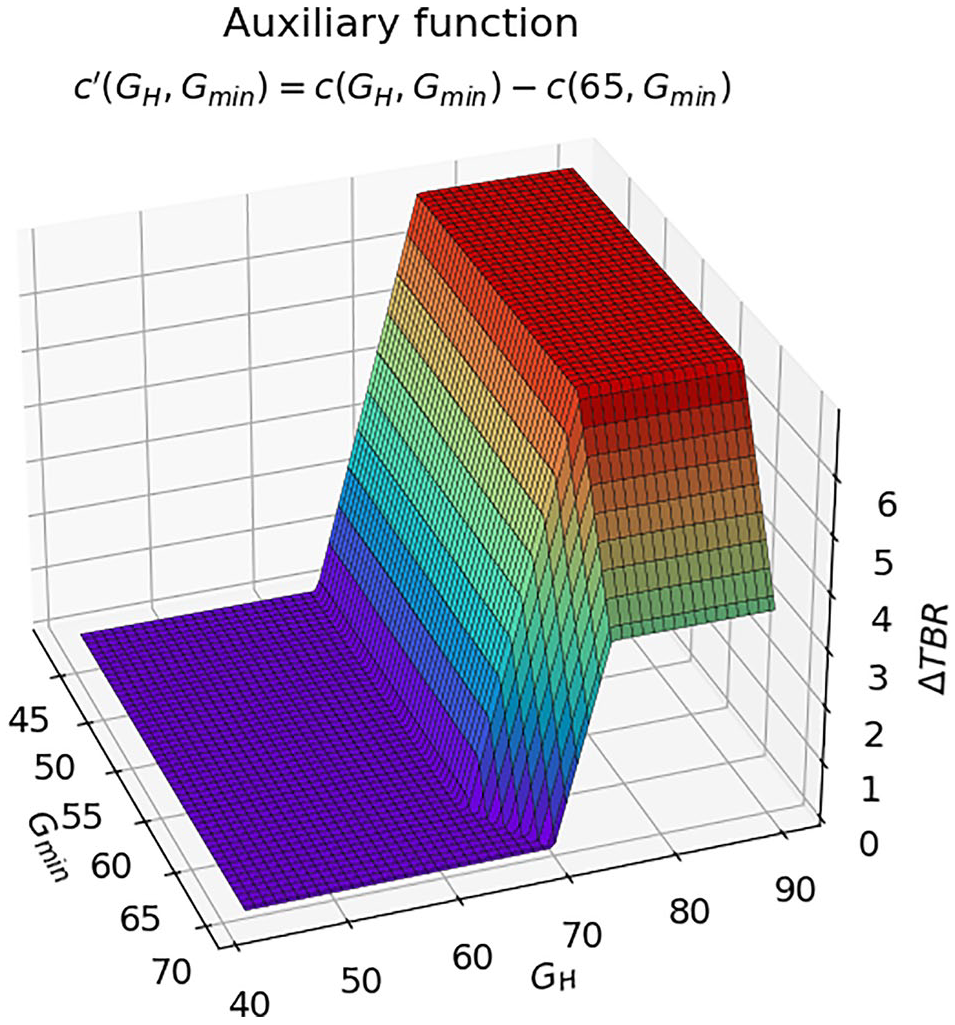
3D plot of auxiliary function with th = 65.
Hypo Treatment Detection
We present a simple method to detect HT events. The purpose is to provide a baseline that makes minimal assumptions (eg, only CGM data) and is computationally simple, but it could be exchanged for more sophisticated methods in practice. At each timestep, we consider 7 cgm samples (15 minutes before, current time, and 15 minutes after), and fit a quadratic curve to the samples to extract the local trend and filter out noise. The coefficients of this quadratic, along with the minimum glucose value in the window, are used as features in a logistic regression model. This design is inspired by existing methods in the literature for detecting meal events from CGM data. 30
This outputs a sequence of timestamps when the logistic regressor predicts the positive class (detection window). The HT is assumed to occur at the time of the minimum CGM value within the detection window.
To filter out false positives, we also add several filtering steps. The first is to ensure an increase in glucose after the HT event of at least 10 mg/dL over 30 minutes. The second is to ensure that the glucose level is below 90 mg/dL at the time of the HT event.
Data from several controlled clinical trials with ground-truth HT events were used to evaluate the model.31-33 A true positive is defined as a detected HT event within ±15 minutes of the ground truth HT event. A false positive is defined as a detected HT event that is not within ±15 minutes of a ground-truth HT or meal event. A false negative is defined as a ground-truth HT event that is not within ±15 minutes of a detected event.
Minimum Hypoglycemic Glucose Value Reconstruction
We present a method to estimate Gmin. Based on previous work,
28
we use a simple ARIMA model to predict glucose values over 6 samples (30 minutes), and the minimum predicted value is chosen for Gmin. The model is trained using 1 week of in silico data. We perform a grid search over
We combine the glucose predictor and HT detector and apply them to from NCT03563313 and NCT04796779 to compute the adjusted data metrics.8,9 These data do not contain ground-truth HT announcements, so we cannot evaluate the performance of the method, but we test whether each TBR correction method is equivalent under the imperfect information. Equivalence of the methods is computed using TTOST (two one-sided tests), where the null hypothesis is that the two cost functions are equivalent within a margin of 0.5% TBR.
Example Application
We demonstrate an example application of adjusted metrics in a run-to-run adaptation system. This system considers CGM metrics from the previous day to adjust insulin treatment. We use the run-to-run approach defined by Toffanin et al 16 to modulate the basal rate and carb ratio of a virtual subject. The purpose of this test is to demonstrate the capability of the proposed methodology to account for behavioral factors in any system using CGM-based hypoglycemia metrics.
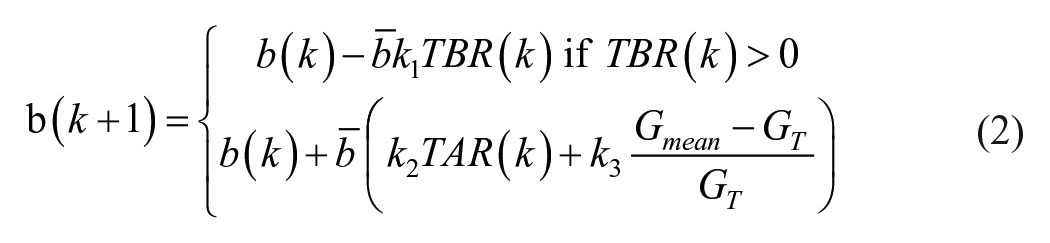
The run-to-run adaptation system uses a simple set of rules to adjust the basal rate and carb ratio. The update rule is described in equation 2, where b is the parameter being updated,
We compare the run-to-run adaptation system in silico with and without corrections to TBR. A realistic meal scenario is designed with intra-day variability of UVA/Padova simulator 29 to generate diverse hypoglycemia conditions. Three meals are given with sizes 75 g, 85 g, 100 g at 8:00 AM, 1:00 PM, and 8:00 PM, respectively. There is one CR value for each meal, and the basal rate is constant throughout the day. The CR values are initialized at ±20% of the nominal value. The insulin sensitivity is initialized at [60%-100%] of the nominal value, to match the initial prevailing hyperglycemia observed in the results in the original work. The virtual population consists of 100 subjects of the UVA/Padova simulator, 29 and the simulation is run for 8 weeks. Each subject is placed in a closed-loop system using the USS Virginia control algorithm (ie, the academic version of Control-IQ). 9 In the baseline scenario, HTs are given at 65 mg/dL, as in the original publication, and we also consider treatments at 80 mg/dL to demonstrate the effects of the proposed methodology.
Since the system was designed with HTs at 65 mg/dL, we use an auxiliary function to compute the change in TBR relative to a HT at 65. As discussed earlier, this auxiliary function can be written as
Results
Model Fit
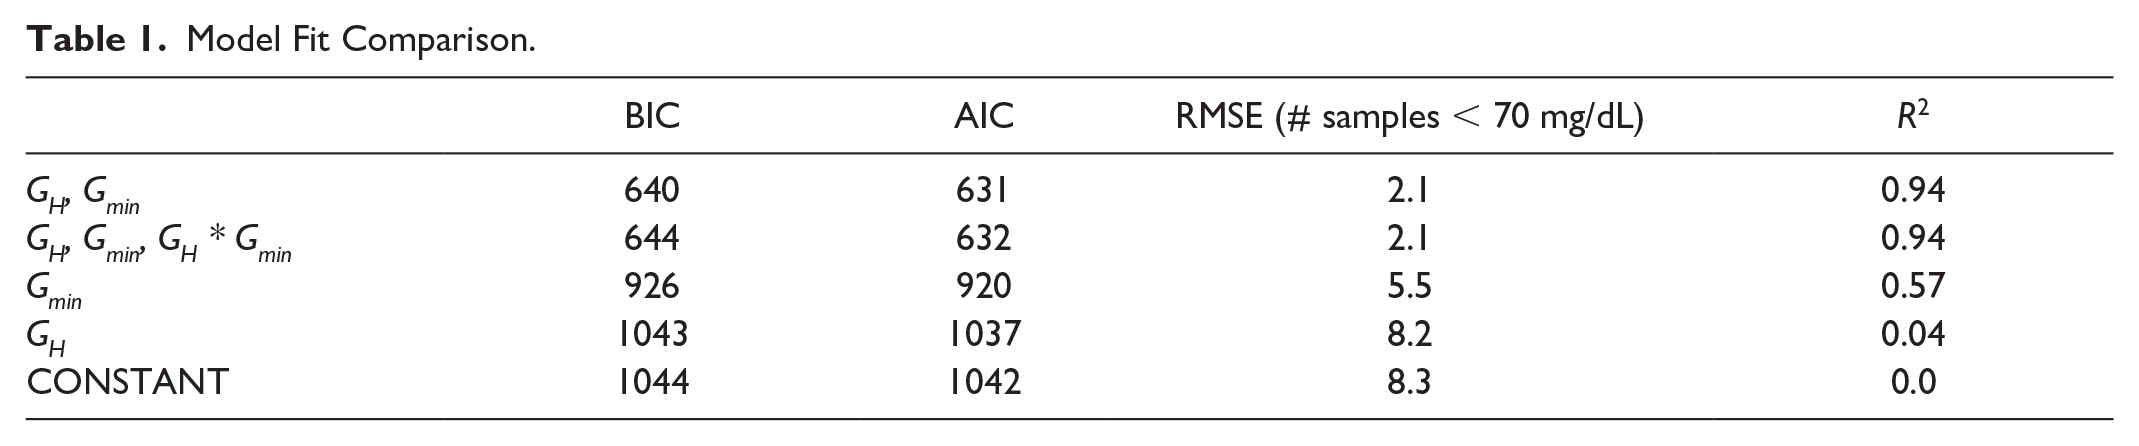
Table 1 shows the results of the model comparison. It can be observed that the interaction term, GH * Gmin, is not significant, and that both AIC and BIC justify the increased complexity of the joint (GH, Gmin) model. The fit indicates the informativeness of each set of predictors follows the order: (GH, Gmin) > Gmin > GH ≈ 0.
Model Fit Comparison.
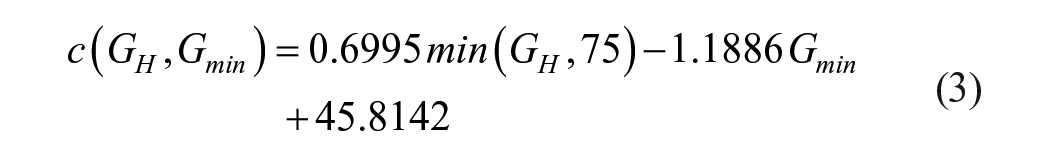
Equation 3 shows the coefficients for the best fit function of GH, Gmin. The units of this function are in number of samples (frequency of 5 minutes). We force GH to be limited to 75 mg/dL because hypoglycemia tends to be fully avoided for treatments above 75 mg/dL. In addition, we constrain GH = max(GH, Gmin) which means that the treatment cannot occur below the min glucose.
On datasets with labeled HTs, the HT detector achieved a precision of 0.69, a recall of 0.74, and an F1 score of 0.72. The ARIMA model with the lowest BIC on in silico data had parameters p = 1, q = 1, d = 1. Using clinical data, the ARIMA glucose predictor was validated with a prediction horizon of 30 minutes, and we found that the RMSE over the entire glucose range is 22.8 mg/dL, which is on par with currently available methods.24-28
On the unlabeled datasets, the TBR correction functions are tested for equivalence within a 0.5% margin under full system uncertainty. The analysis shows that GH is equivalent to CONSTANT, and (GH, Gmin) is equivalent to (GH, Gmin, GH* Gmin) with p < .001. The results support the in-silico analysis that GH alone does not provide any additional information and that the interaction term GH* Gmin does not improve model fit. From this, we conclude that a planar function is best for modeling avoided hypoglycemia.
Case Study
We take a day from NCT03563313 to visualize how this methodology works. 9 We choose a day where there are detected HTs at higher glucose values to demonstrate the need for this method. Figure 5 shows the proposed methodology applied to the selected day. The selected day has 0% TBR because the treatments were given early, hypoglycemia is completely avoided. From visual inspection of the CGM trace, one can observe that the hypoglycemia risk is not zero as indicated by TBR alone.
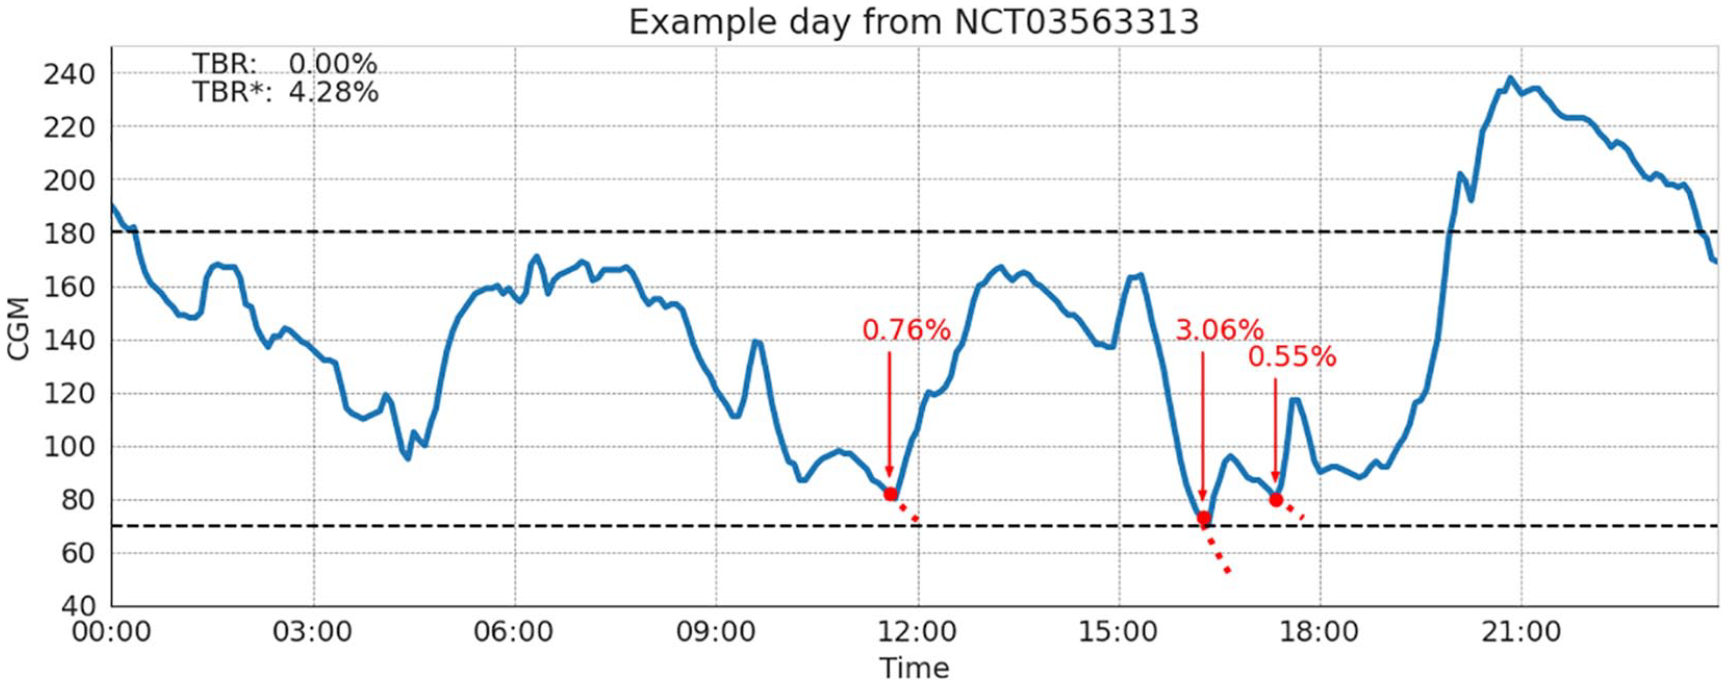
Example day from NCT03563313 of the proposed methodology. CGM metrics show no hypoglycemia exposure; however, the HT-corrected metric includes the avoided hypoglycemia.
Three HTs are detected at 11:30 AM, 4:15 PM, and 5:10 PM. At these times of treatment, CGM was 82, 73, and 80 mg/dL and predicted min glucose of 68, 51, and 69 mg/dL, respectively. The corrected TBR* exposure is 4.28% compared to 0.0% based on CGM alone. We note that the first treatment at 11:30 AM is likely a meal event, which would indicate a false positive in the HT detector. Despite this, it is possible that the meal is hiding hypoglycemia that would have occurred otherwise. Specifically focusing on the event at 4:15 PM, we see a very sharp drop in glucose, and it is likely that, without rescue carbohydrates, this could have led to prolonged hypoglycemia, so most of the TBR correction is driven by this event. The other hypoglycemic events have a smaller contribution to TBR*, predicting less than 10 minutes of avoided hypoglycemia, because they are predicted to be less severe. This highlights the ability of this method to distinguish between different severities of hypoglycemic events.
Example Application
Table 2 shows the performance metrics during the final week of adaptation at two different treatment thresholds. We notice in the baseline scenario; the performance of the proposed method is nearly identical to that of the original publication. 16 In the experimental scenario, with treatments at 80 mg/dL, the algorithm using unmodified TBR became continuously more aggressive leading to more than three HTs per day on average. While using the proposed methodology, the system adapted to the new behavioral component and reduced the number of HT events, while still maintaining TIR performance at least as good as the original method. Figure 6 shows the performance over time in the hypo-fearing treatment scenario (HT at 80 mg/dL). Results show an increasing number of HT over time with the baseline method, while stabilized number of HT per day using the proposed methodology.
Performance Metrics During Last Week of Simulation. Compare Baseline Adaptation Scheme Versus Two Versions of the Proposed Method Under Different Hypotreatment Thresholds. Results Are Presented As Mean (Standard Deviation).

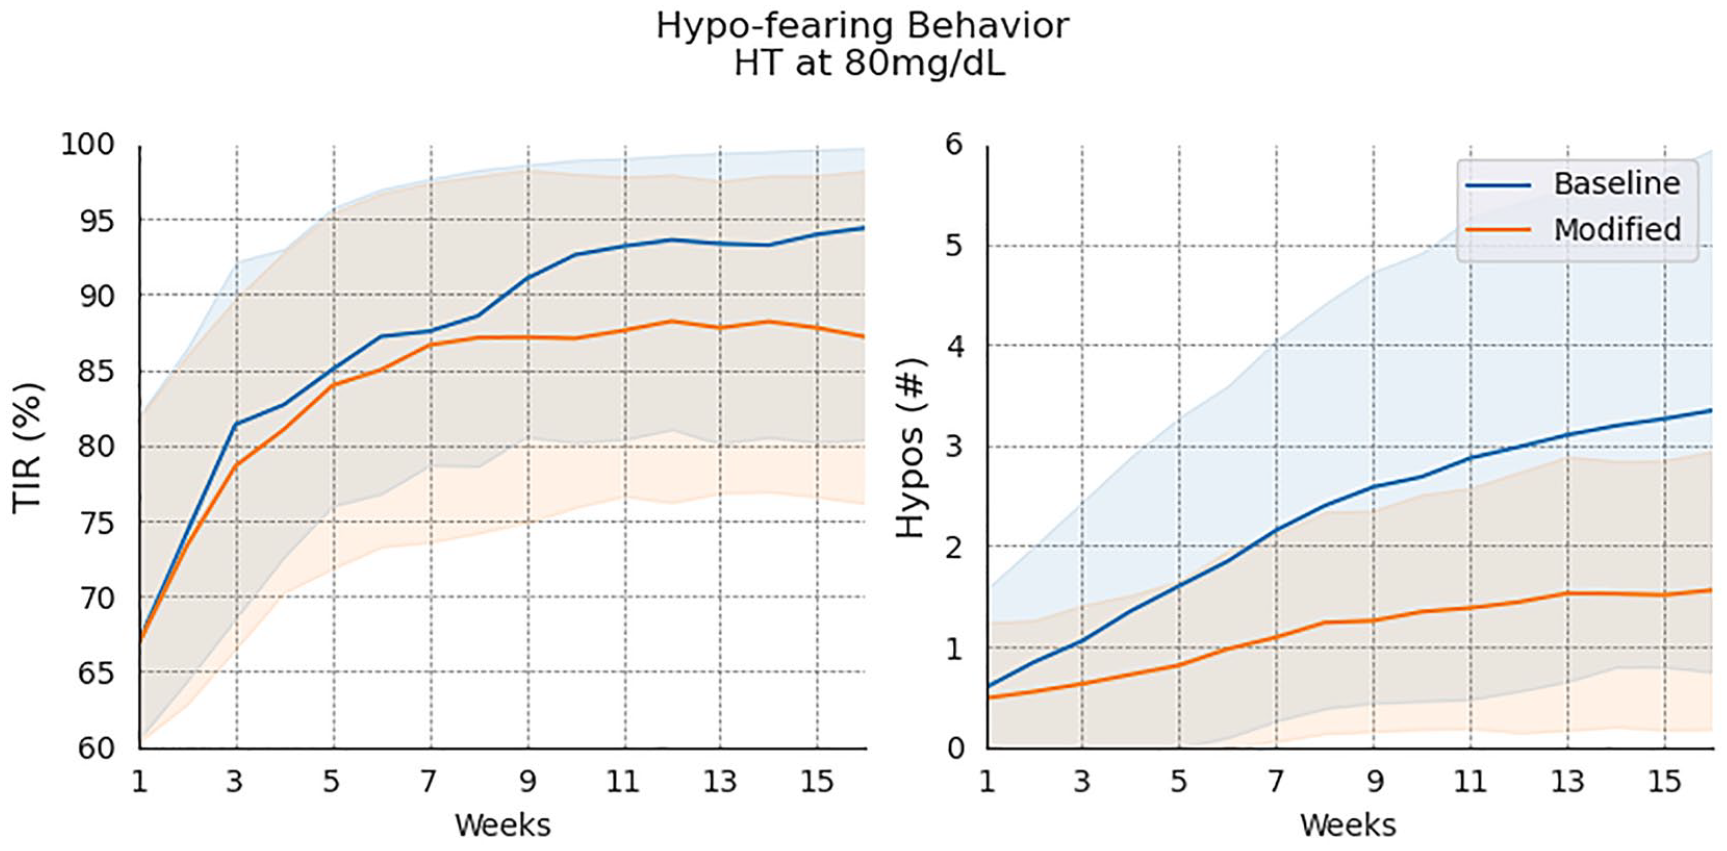
Performance of the run-to-run adaptation system over time with and without the proposed methodology.
Discussion
Continuous glucose monitor-based metrics are increasingly common in the field of diabetes. Since behavioral factors such as HTs can increase patient burden and artificially reduce apparent hypoglycemia in CGM metrics, HTs should be jointly considered with CGM metrics when gauging performance. The proposed methodology provides a way to incorporate HT directly into hypoglycemia metrics. This can provide clinicians with better measures of hypoglycemia exposure that may otherwise be masked by HTs. Incorporating HT information into system design can help fine-tune treatment regimens, and guide more personalized management strategies. As a result, this has the potential to help reduce the overall burden of T1D management.
The individual case study presented in Section 3.2 illustrates the proposed method’s potential utility. While the CGM data predicts 0% TBR, indicating no hypoglycemia exposure, qualitative observations reveal treatment behaviors that may obscure actual hypoglycemic events. By accounting for these behaviors, our method offers a way to uncover the “true hypoglycemia exposure,” which could serve as a valuable metric providing a more comprehensive understanding of patient behaviors and hypoglycemia exposure.
The example application (Section 3.3) shows this methodology being applied to the approach introduced by Toffanin et al. 16 The results show that this methodology enables the system to adapt to variable HT behaviors without algorithm re-tuning. Under baseline conditions, performance remains nearly identical to the initial solution, indicating that false positives and hypoglycemia misestimations do not impact outcomes. In the hypo-fearing scenario, the methodology significantly reduces daily HT occurrences, demonstrating its effectiveness in detecting insulin imbalances and adapting to different behavioral factors.
Many practical applications may not need the joint function of GH, Gmin because it increases system complexity by requiring an estimate of Gmin. It may be used only for deriving a constant term through the auxiliary functions or prior information on GH or Gmin.
The auxiliary functions allow this method to be applied to a wide range of scenarios. Another example demonstrating the utility of this method is the observation that a personalized constant model can be derived as the expected value of the joint model. With additional information on the prior distribution of GH and Gmin, the constant model can be further refined to provide more accurate predictions while maintaining its simplicity.
The HT detector and glucose predictor are designed as a proof of concept and may be exchanged for more sophisticated methods in practice.24-28,34,35 The methods presented here are designed to use only CGM data but could be combined with other data sources to improve performance. The ARIMA glucose predictor is essentially a linear extrapolation of the last 2 points for 30 minutes. This is unlikely the best available estimate of Gmin, so the results may be improved by using a more sophisticated method.
One main limitation of this work is that the experimental design to approximate the amount of avoided hypoglycemia relies upon the UVA/Padova simulator. This may not accurately reflect individual response in hypoglycemia: leading to incorrect predictions. Related to this, the baseline function c(GH, Gmin) often yields large changes in TBR for a single HT because of prolonged in silico glucose recovery. This motivates the use of auxiliary functions (corrections are relative to an assume treatment threshold, eg, 65 mg/dL) to give smaller corrections to TBR. Another limitation is that the training scenario is highly contrived to isolate the impact of a single hypotreatment. It was also generated using a scenario with suspended insulin; however, it could be regenerated to account for different treatment modality.
The inclusion of HTs turns a bi-objective problem (balancing TBR and TAR) into three objectives. The proposed methodology simplifies this by including HTs directly into TBR. This methodology was applied to TBR but can be applied to any hypoglycemia exposure metric. The Appendix includes an example using Low Blood Glucose Index (LBGI).
Conclusion
Consuming rescue carbohydrates, or HTs, by definition, reduces the incidence of hypoglycemia. Considering only CGM-based metrics can lead to misestimation of performance and potentially incorrect conclusions about insulin-imbalance. However, many methods overlook the impact of HTs and how these impacts vary based on individual preferences.
We present a methodology to account for the reduction in CGM-based performance metrics caused by HTs. This methodology can be applied to a wide range of use cases and accommodates individual variability. We provide a proof-of-concept HT detector and glucose predictors. Our demonstration shows that these tools can be integrated with existing methods in literature to seamlessly account for HTs within CGM-based metrics.
Supplemental Material
sj-docx-1-dst-10.1177_19322968251329952 – Supplemental material for Accounting for Hypoglycemia Treatments in Continuous Glucose Metrics
Supplemental material, sj-docx-1-dst-10.1177_19322968251329952 for Accounting for Hypoglycemia Treatments in Continuous Glucose Metrics by Elliott C. Pryor, Anas El Fathi and Marc D. Breton in Journal of Diabetes Science and Technology
Footnotes
Abbreviations
CGM, continuous glucose monitoring; HT, hypoglycemia treatment; TIR, time in range; TBR, time below range; TAR, time above range; RMSE, root mean squared error; AIC, Akaike information criterion; BIC, Bayesian information criterion.
Declaration of Conflicting Interests
The author(s) declared the following potential conflicts of interest with respect to the research, authorship, and/or publication of this article: MDB has received research support from Tandem Diabetes Care, Dexcom, and Novo Nordisk through his institution. MDB has received honoraria, travel expenses, and consulting fees from Roche Diagnostics, Dexcom, Vertex, Tandem, Sanofi, BoydSense, and Portal Insulin. AEF holds intellectual properties in the field of diabetes technology.
Funding
The author(s) disclosed receipt of the following financial support for the research, authorship, and/or publication of this article: This study was funded by the National Institutes of Health (grant no. NIH R01DK051562).
Supplemental Material
Supplemental material for this article is available online.
References
Supplementary Material
Please find the following supplemental material available below.
For Open Access articles published under a Creative Commons License, all supplemental material carries the same license as the article it is associated with.
For non-Open Access articles published, all supplemental material carries a non-exclusive license, and permission requests for re-use of supplemental material or any part of supplemental material shall be sent directly to the copyright owner as specified in the copyright notice associated with the article.