
Abstract
Introduction:
Insulin pump therapy can be adversely affected by interruption of insulin flow, leading to a rise in blood glucose (BG) and subsequently of blood beta-hydroxybutyrate (BHB) ketone levels.
Methods:
We performed a PubMed search for English language reports (January 1982 to July 2024) estimating the rate of rise in BG and/or BHB after ≥ 60 minutes of interruption of continuous subcutaneous insulin infusion (CSII) in persons with type 1 diabetes (PwT1D). We also simulated the rise in BG in a virtual population of 100 adults with T1D following suspension of continuous subcutaneous insulin infusion.
Results:
We identified eight relevant studies where BG and BHB (seven of these eight studies) were measured following suspension of CSII as a model for occlusion. After 60 minutes post-suspension, the mean extracted rates of rise averaged 0.62 mg/dL/min (37 mg/dL/h) for BG and 0.0038 mmol/L/min (0.20 mmol/L/h) for BHB. Mean estimated time to moderately/severely elevated BG (300/400 mg/dL) or BHB (1.6/3.0 mmol/L) was, respectively, 5.8/8.5 and 8.0/14.2 hours. The simulation model predicted moderately/severely elevated BG (300/400 mg/dL) after 9.25/12, 6.75/8.75, and 4.75/5.75 hours in the virtual subjects post-interruption with small (5th percentile), medium (50th percentile), and large (95th percentile) hyperglycemic changes.
Discussion:
Clinical studies and a simulation model similarly predicted that, following CSII interruption, moderate/severe hyperglycemia can occur within 5-9/6-14 hours, and clinical studies predicted that moderate/severe ketonemia can occur within 7-12/13-21 hours. Patients and clinicians should be aware of this timing when considering the risks of developing metabolic complications after insulin pump occlusion.
Introduction
Insulin pump therapy and automated insulin delivery systems have revolutionized diabetes management. A complete or partial occlusion of insulin flow can occur within an insulin pump, an infusion set, or anywhere along the path from the pump to the subcutaneous space. Following occlusion and cessation of insulin delivery into the subcutaneous space, as circulating insulin levels decrease, blood glucose (BG) concentrations rise as blood insulin levels eventually fall to zero. Subsequently, blood ketone levels (mainly consisting of beta-hydroxybutyrate, BHB) also rise. Insulin pumps contain detection systems to alert a person with diabetes (PwD) wearing a pump to an occlusion. Different insulin pump types use various technical approaches to detect an occlusion and provide an alert.
Insulin pump occlusion is not uncommon. A study using self-reported surveys for a nationwide type 1 diabetes (T1D) registry showed that 96.6% of the participants had experienced at least one insulin infusion set failure per year, and 41.4% encountered at least one such failure per month. 1 Others have found that the incidence of adverse insulin pump events is between 0.5 and 5 events per person-year, which often do not require hospitalization. 2
Following an interruption of insulin delivery, the rate of rise in BG and BHB concentrations depends on the physiological glucose dynamics in the PwD. We define moderate and severe hyperglycemia as BG levels of 300 and 400 mg/dL,3-6 and moderate and severe ketonemia as BHB of 1.6 and 3.0 mmol/L7,8 and refer to these levels as metabolic complications. A BHB level of 3.0 mmol/L is necessary but not sufficient for the diagnosis of diabetic ketoacidosis, which also requires evidence of acidosis. 7 Prompt detection of a pump occlusion is necessary to prevent severe metabolic complications.
After an insulin pump occlusion, the insulin effect does not immediately disappear. The BG and BHB do not start rising immediately. To predict the time until metabolic complications occur, we need to know or assume the BG and BHB concentrations before the occlusion and determine (1) the time from interruption until BG and BHB start to rise and (2) the rate of rise. We conducted a systematic review of the literature to ascertain these two factors.
The effect of insulin pump occlusion events on glucose control over several hours following basal rate suspension can also be evaluated using computer simulation. For in silico populations, a range of rates of the subsequent rise in BG following insulin suspension can be predicted. Glucose levels rise because of insufficient insulinization, which affects some PwT1Ds more than others. Simulation modeling is not available for BHB accumulation.
In this study, we set out to determine the amount of time to moderate/severe metabolic complications following insulin pump occlusion. We used both the results of clinical studies and computer simulations.
Methods
Literature Search and Screening of Studies
We performed a PubMed search for all English language reports published from January 1982 to July 2024 that provide data from clinical studies about the rate of rise in BG and/or BHB after interruption of a subcutaneous insulin infusion in persons with type 1 diabetes (PwT1D). We would also have included simulation studies, but none were identified. The search string was: (type 1 diabetes mellitus OR T1DM OR type 1 diabetes OR insulin-dependent diabetes mellitus OR IDDM OR insulin dependent diabetic) AND (continuous subcutaneous insulin infusion OR CSII OR insulin pump) AND (insulin OR basal insulin) AND (interruption OR suspension OR occlusion) AND (beta hydroxybutyrate OR BHB OR ketone OR ketone bodies OR glucose OR blood glucose OR plasma glucose OR ketoacidosis) AND (clinical study OR clinical trial OR in-silico OR simulation study OR experiment) AND (Human)
In addition, individual authors independently identified potentially relevant studies. The bibliographies of articles identified through the electronic search and individual searches were further reviewed for additional studies not previously recognized. Two authors (C.N.H. and A.T.A.) independently reviewed all potentially relevant abstracts and determined whether to advance to full-text review. Disagreements were resolved by a third author (M.A.K). Full-text review determined whether the study met the inclusion criteria for data extraction (Table 1).
Inclusion and Exclusion Criteria.

Abbreviations: BG, blood glucose; BHB, beta-hydroxybutyrate; CGM, continuous glucose monitor; CSII, continuous subcutaneous insulin infusion; T1D, type 1 diabetes.
Data Extraction
The BG and BHB levels that were measured at multiple time points during the suspension of the infusion were reported only in plots. We digitized the plots using WebPlotDigitizer 9 and fit the digitized BG/BHB data (difference from baseline) using linear regression (no intercept) and reported the slope in mg/dL/min (BG) or mmol/L/min (BHB). The other extracted information is listed in Table 2.

The starting BG level ranged from 82 to 108 mg/dL.
Abbreviations: BG, blood glucose; BHB, beta-hydroxybutyrate; N/A, not available.
For two studies, we calculated the average rate of rise using the timepoint at which one patient had dropped out.
Personal communication.
Primary Data Analysis
We report the extracted rates of increase contained in each study. We calculated the rate of increase starting at the point where the insulin effect ended as evidenced by the amount of time that the BG and BHB concentrations remained flat following the suspension of insulin infusion. We also report the average (range) across all studies without attempting to weight studies differentially by number of participants or duration of interruption. We used the rates of increase in the studies to extrapolate the time to a BG level of 180, 250, 300, 400, and 600 mg/dL and the time to a BHB level of 1.6 to 3.0 mmol/L. These times include the interval during which the BG and BHB levels remain flat before they start to rise.
Simulation
The effect of insulin pump occlusion events on glycemic control of PwD over several hours following basal rate suspension was evaluated using computer simulations. For this purpose, we used the University of Virginia (UVA)/Padova T1D simulator, which consists of a fully identified maximal model of glucose metabolism in T1D 18 and a virtual population of 100 adult PwDs displaying key metabolic behaviors observed in the general population of individuals with T1D.18-21 To simulate the occlusion events, the virtual participants were considered to be in fasting condition at the moment of pump delivery failure (no carbohydrate on board) and having consistently received their usual basal insulin infusion rate in the hours leading up to the occlusion event. At the time of pump failure, the delivery of insulin was suspended, and the evolution of BG concentration was observed for the following 16 hours; during this time, the virtual subjects are assumed to have not consumed any carbohydrates.
Results
Literature Review
The initial PubMed search yielded 73 publications. Another 28 were identified by individual authors, and 13 through review of bibliographies of the identified studies (Figure 1). The abstract review yielded 26 articles (98 were excluded). Full-text review resulted in eight studies for data extraction10-17 (Table 2). Several of the other 18 studies that could not be used for data extraction provided important background information. Five studies were excluded because they did not use a rapid-acting insulin analog. (The US Food and Drug Administration approved insulin lispro in 1996 and insulin aspart in 2000.) We initially estimated the rates of rise of BG and BHB for studies using regular insulin but found that the values differed from studies using rapid-acting insulin analogs, so we changed our inclusion/exclusion criteria. None of the eight studies included children, and none were simulation studies. Also, none of the studies displayed the time course of BG or BHB for individuals, only the average across all study participants.
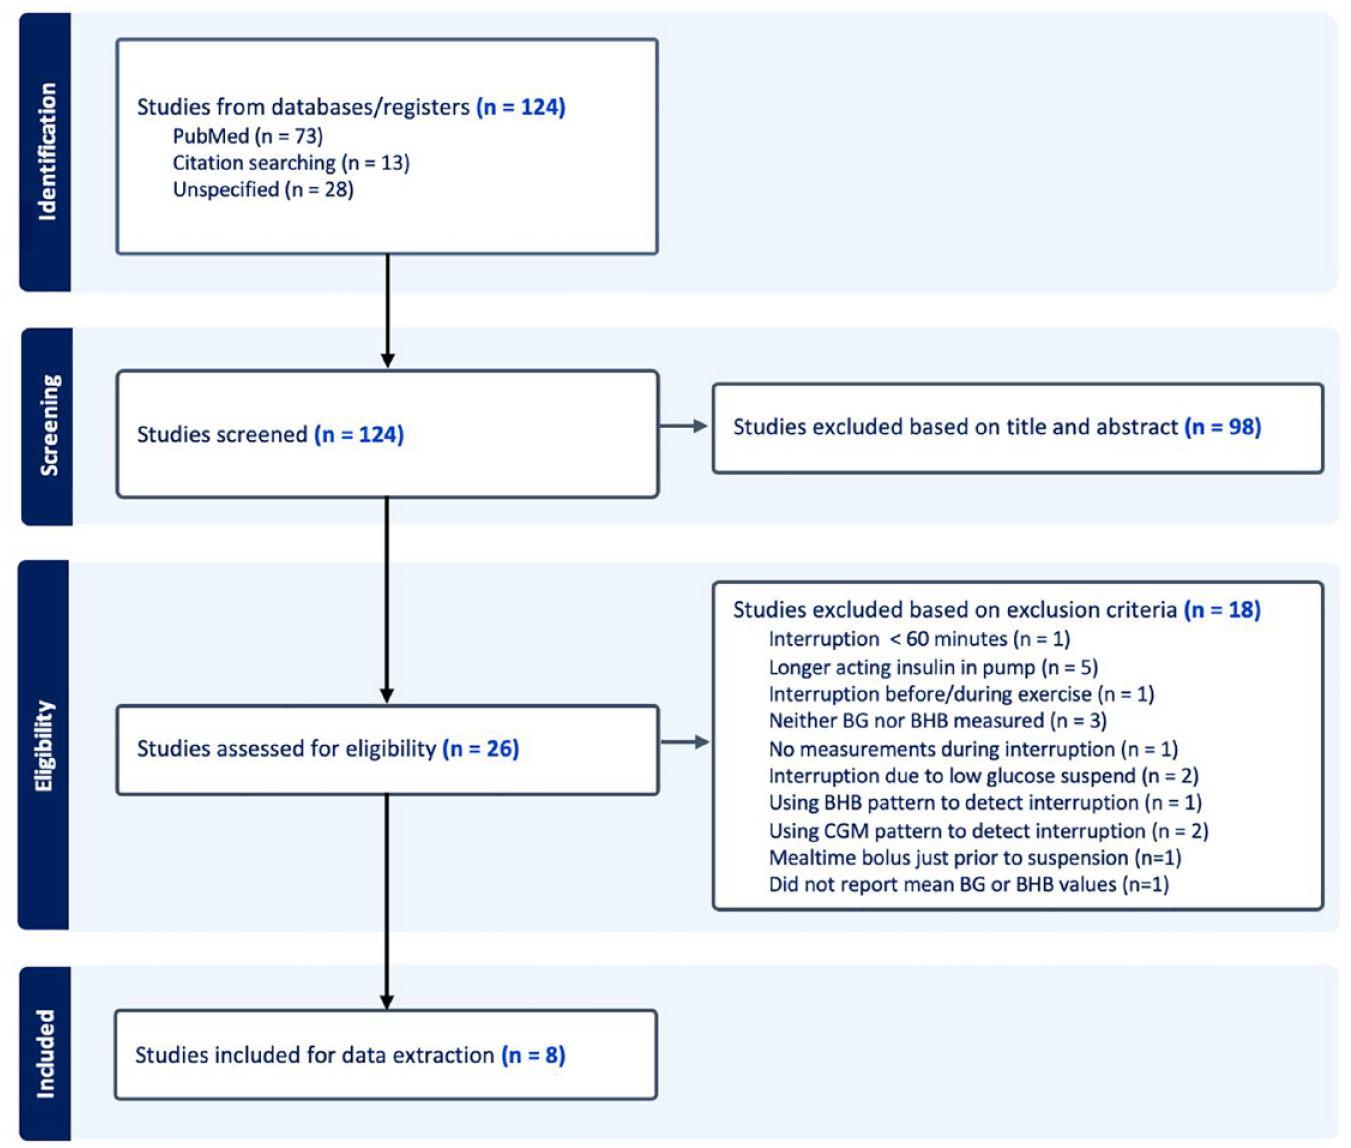
Flow diagram for the systematic review of clinical studies presenting the rate of rise in BG and/or BHB after interruption of a subcutaneous insulin infusion in PwT1D (Generated by Covidence and then modified.). 22
Extracted Results
All eight studies showed essentially flat BG and BHB profiles for the first 60 minutes after suspension of the insulin infusion (see Supplementary Figures S1 and S2.) After the first 60 minutes, the rate of rise of BG ranged from 0.36 to 0.81 mg/dL/min (22 to 49 mg/dL/h). The average across studies was 0.62 mg/dL/min (37 mg/dL/h). The extracted rate of rise of BHB ranged from 0.0025 to 0.0058 mmol/L/min (0.15-0.35 mmol/L/h). The average across the studies was 0.0038 mmol/L/min (0.23 mmol/L/h).
Average rate of increase
Using the average rate of increase for BG across studies, it would take 5.8 or 8.5 hours to reach a BG level of 300 or 400 mg/dL, respectively (starting at a BG of 120 mg/dL). For ketones, it would take 8.0 or 14.2 hours to reach a BHB of 1.6 or 3.0 mmol/L, respectively (starting at a BHB of 0.0 mmol/L). Times to various levels of BG and BHB are presented in Table 3. Based on extrapolations of the average rates of increase of BG and BHB, respectively, the average time to reach severe hyperglycemia (400 mg/dL) was shorter than the average time to reach severe ketonemia (3.0 mmol/L).
Time Following Suspension to Various Elevated Levels of BG and BHB Based on Extracted Rates of Increase From the Eight Identified Studies.
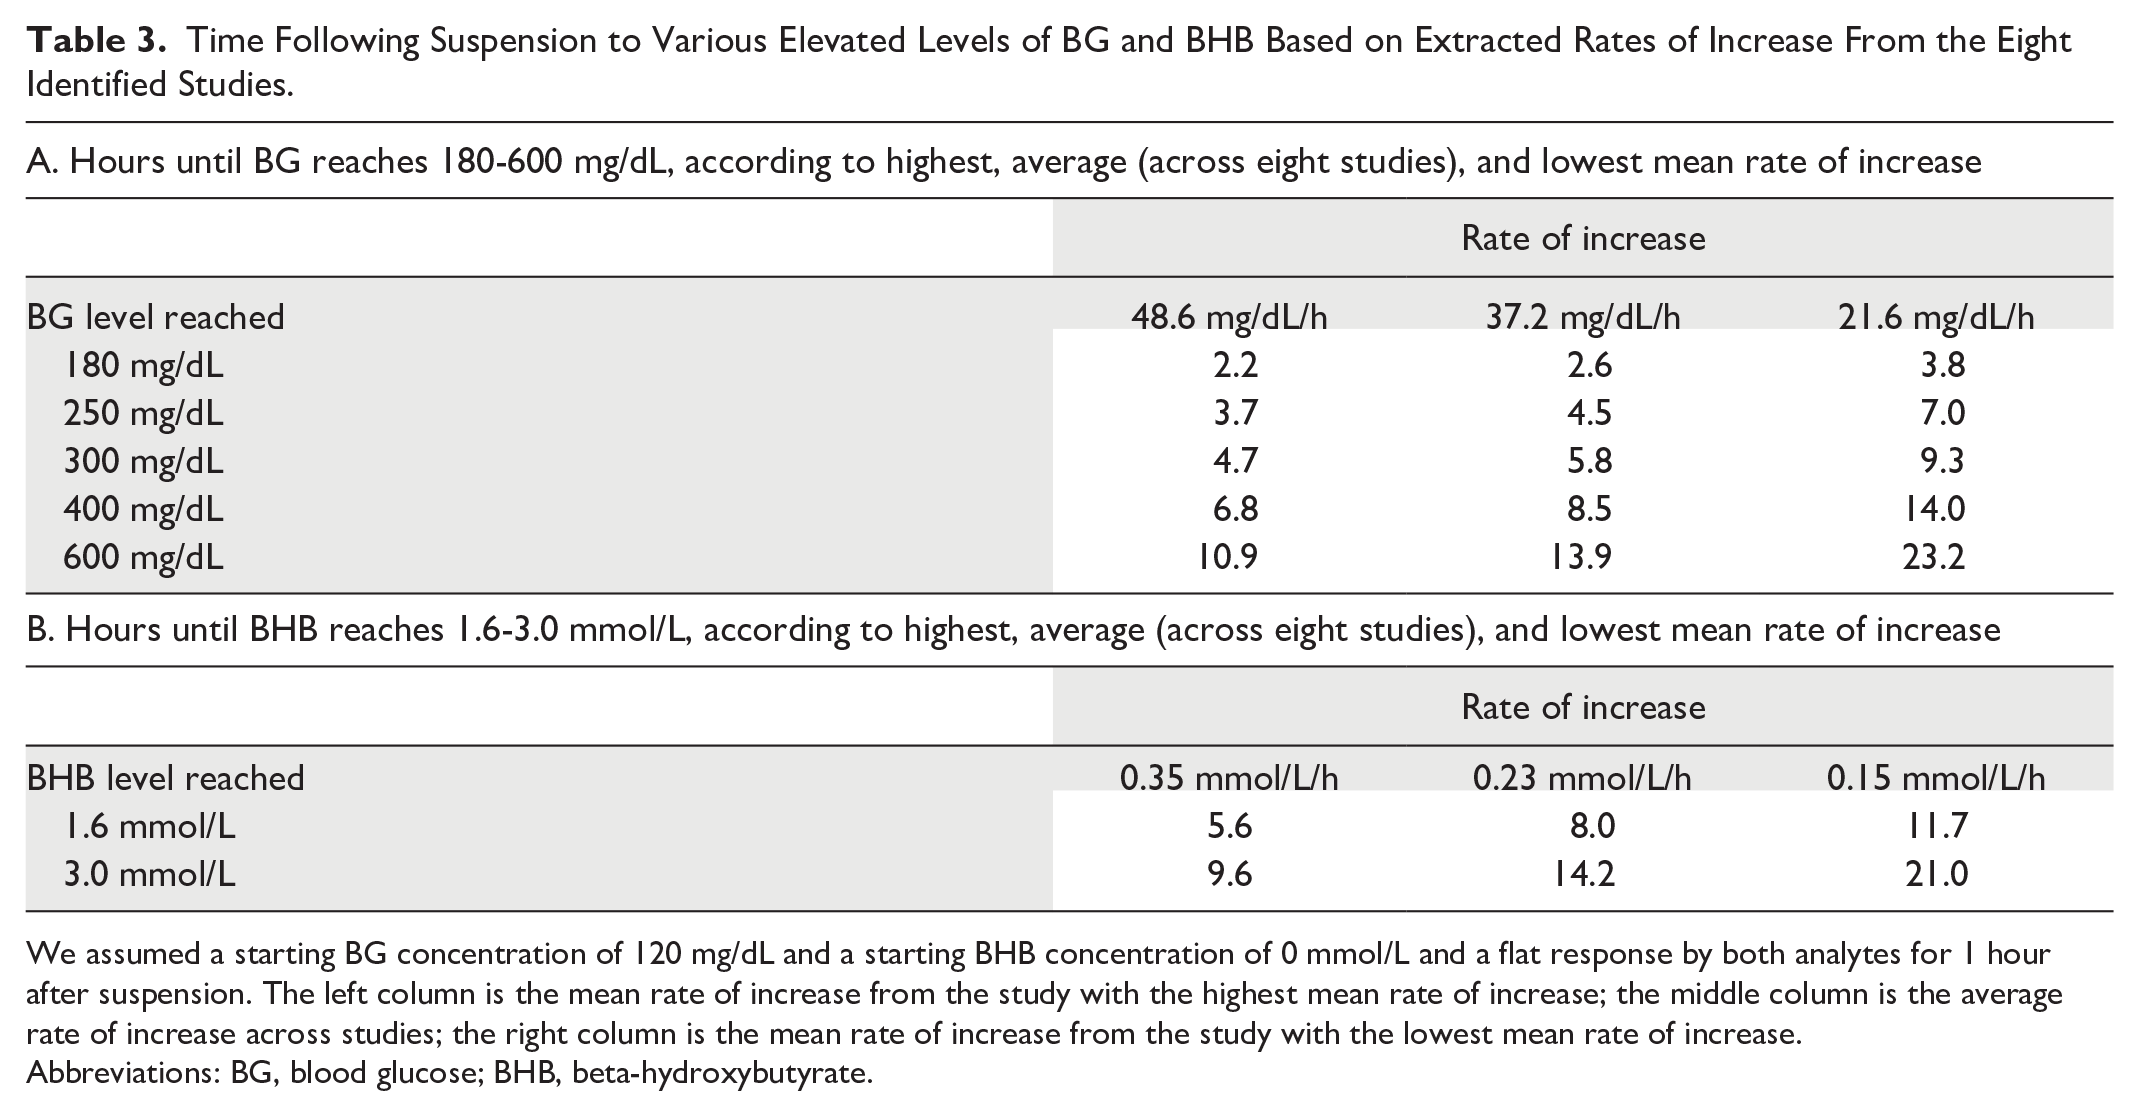
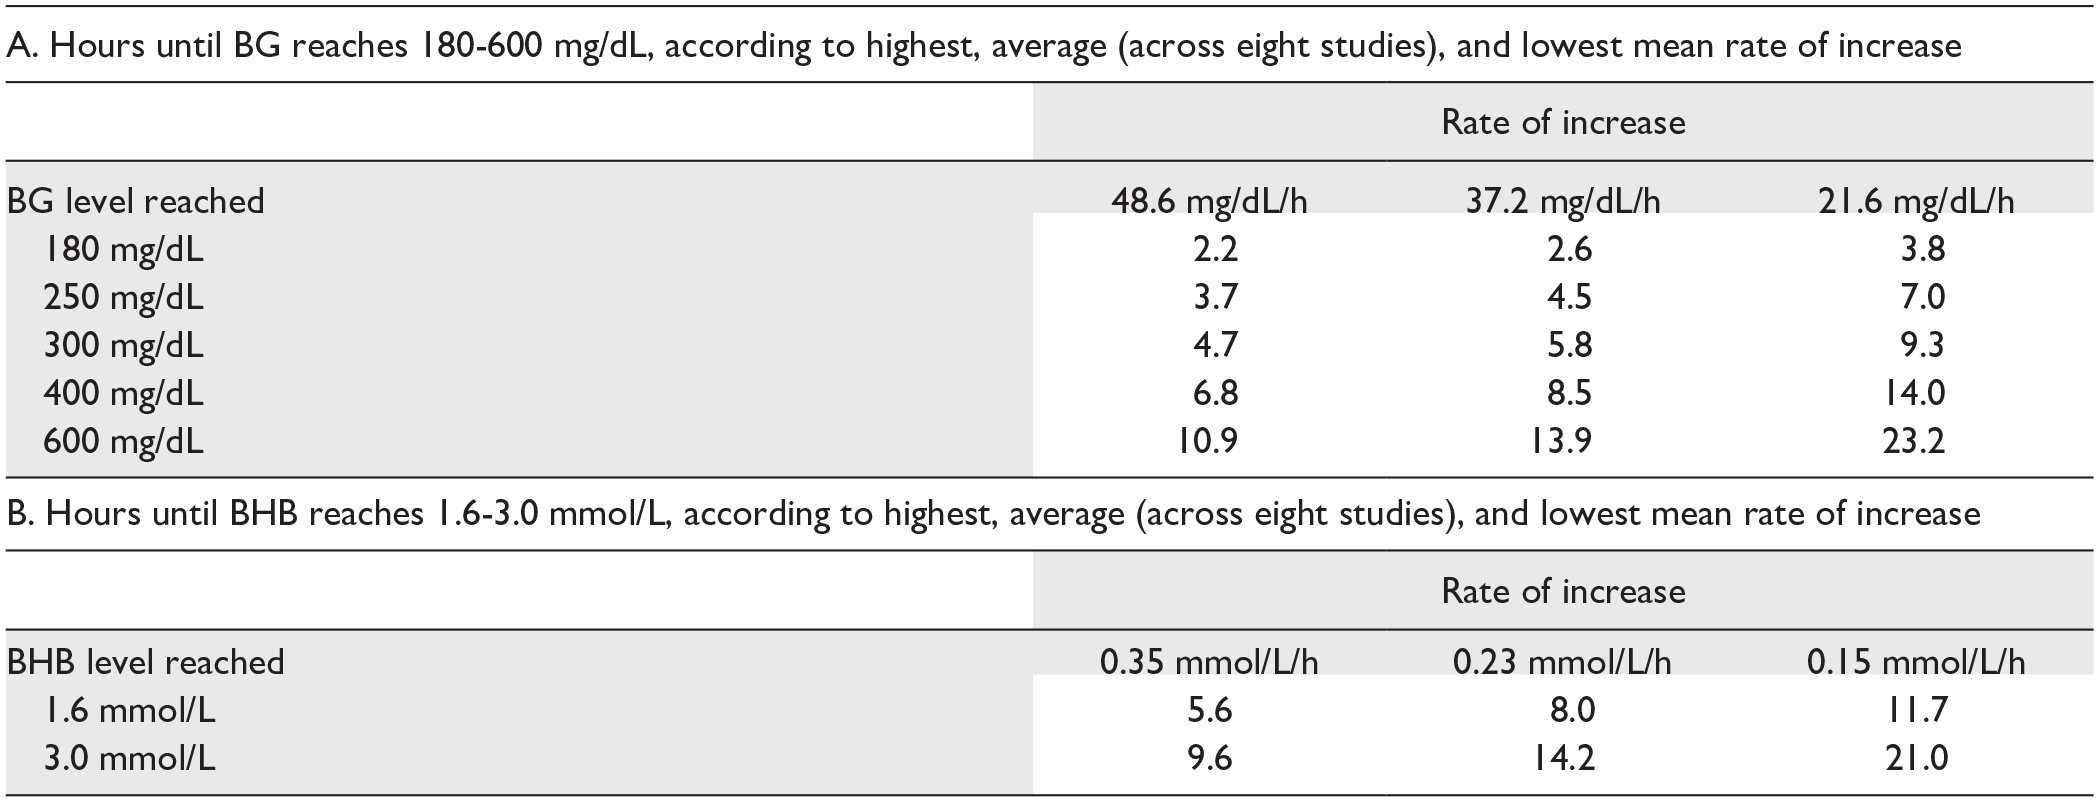
We assumed a starting BG concentration of 120 mg/dL and a starting BHB concentration of 0 mmol/L and a flat response by both analytes for 1 hour after suspension. The left column is the mean rate of increase from the study with the highest mean rate of increase; the middle column is the average rate of increase across studies; the right column is the mean rate of increase from the study with the lowest mean rate of increase.
Abbreviations: BG, blood glucose; BHB, beta-hydroxybutyrate.
Highest rate of increase
Using the average rate of increase from the study with the highest rate of increase of BG, it would take 4.7 or 6.8 hours to reach a BG level of 300 or 400 mg/dL, respectively (starting at a BG of 120 mg/dL). 13 Using the average rate of increase for the study with the highest rate of increase of BHB, it would take 5.6 or 9.6 hours to reach a BHB level of 1.6 or 3.0 mmol/L, respectively (starting at a BHB of 0.0 mmol/L). 17 Note that each rate in Table 2 is an average across study participants; individual rates of increase could be higher, which would cause times for metabolic complications to be correspondingly shorter.
An optimal BG target for users of continuous glucose monitors is widely considered to be 70 to 180 mg/dL. Above that range, 181 to 250 mg/dL, is defined as level 1 hyperglycemia and above 250 mg/dL is defined as level 2 hyperglycemia. 23 As presented in Table 2, following insulin suspension, if the baseline BG is 120 mg/dL, then the BG can rise to level 1 and level 2 hyperglycemic concentrations, respectively, within 2.2-3.8 hours and 3.7-7.0 hours.
As no studies involving children were found, we could not estimate the rate of increase of BG or BHB after insulin infusion interruption in children with T1D. A prior study did report that younger children aged four to nine years were more sensitive to pump interruption than older children aged 10 to 14 years. 24
Simulation Results
The model was used to predict times to moderately or severely elevated BG. For the virtual subjects that demonstrated small (5th percentile), medium (50th percentile), and large (95th percentile) effects, moderate/severe hyperglycemia (300/400 mg/dL) occurred 9.25/12, 6.75/8.75, and 4.75/5.75 hours after insulin interruption. Results are shown in Table 4. An illustration of the simulation results for all 100 virtual patients is presented in Figure 2. Based on the simulation, the BG can rise to level 1 and level 2 hyperglycemic concentrations, respectively, within 3.0-5.25 hours and 4.0-7.75 hours.
Hours Following Insulin Suspension to Reach Various Elevated Levels of BG Based on a Simulated Population of 100 Persons With Type 1 Diabetes According to BG Level and Simulation Percentile.

Rankings were assigned based on BG levels at 360 minutes. 95th percentile is the virtual patient with the fifth highest BG level; 50th percentile is the patient with the median BG level; 5th percentile is the patient with the fifth lowest BG level.
Abbreviations: BG, blood glucose; N/A, not applicable.
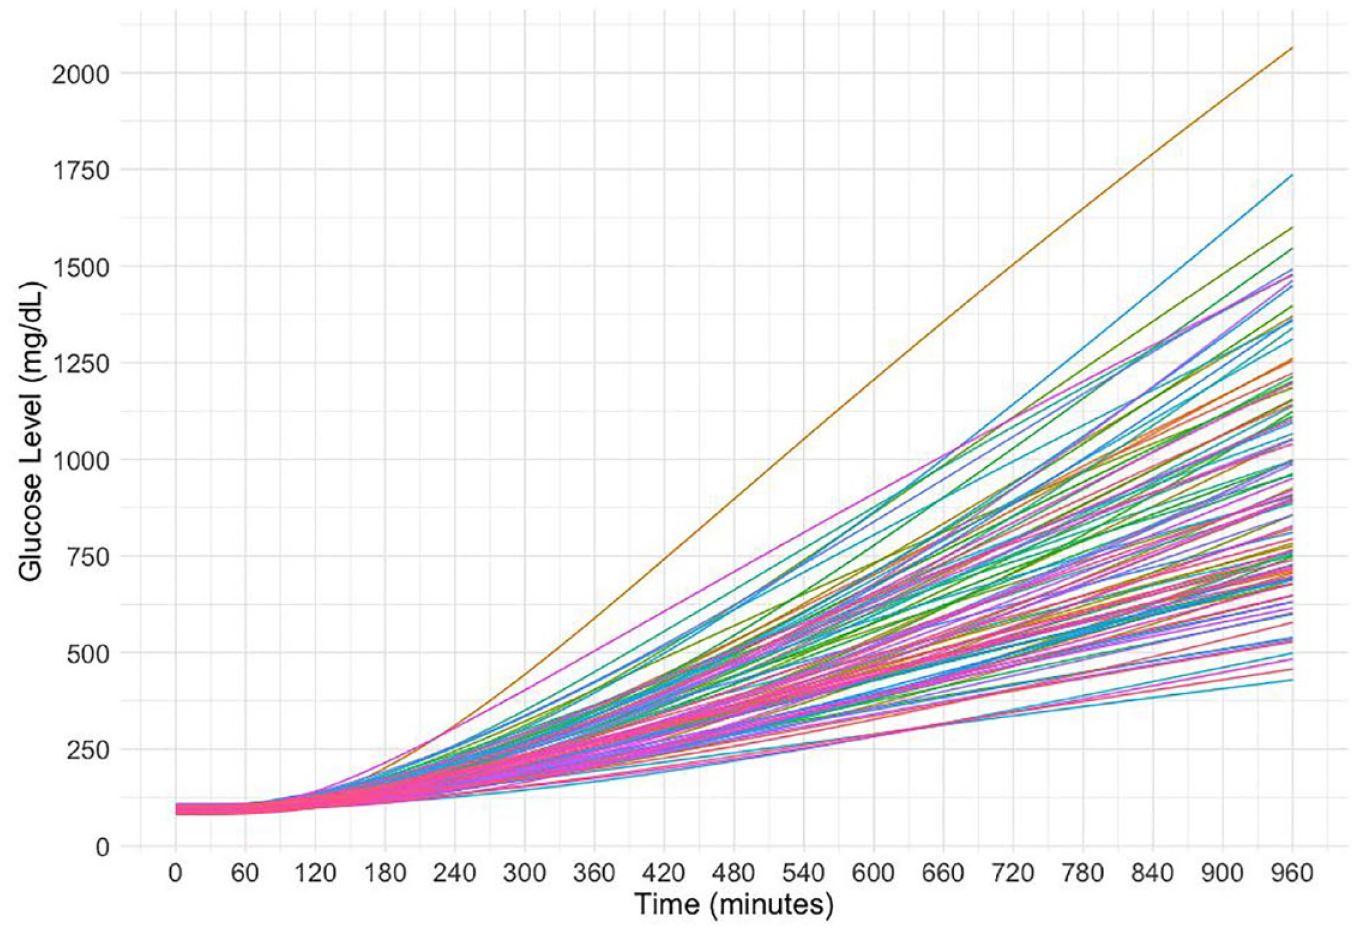
Simulated BG responses to interruption of insulin infusion in 100 virtual PwT1D. This figure was generated from the UVA/Padova Type 1 Diabetes Simulator. For this simulation, basal insulin was completely suspended at time 0 (when pump delivery failed) and maintained at 0 U/h over the remaining course of the simulations. Colors are assigned at random.
Discussion
In this study, we reviewed the literature to identify the effects of investigational suspension of continuous insulin delivery on glycemia and ketonemia. We also simulated the metabolic effects of the occlusion of insulin infusion. The simulation results agreed reasonably well with those extracted from the eight clinical studies that were in our literature review. Following the interruption of a subcutaneous insulin infusion, the time to moderate or severe elevations of BG ranged from 4.7 to 14.0 hours. The time to moderate or severe elevations of BHB was from 5.6 to 21.0 hours. This indicates that an adult who experiences an occlusion at night could possibly develop severe hyperglycemia (with BG 400 mg/dL) by the following morning or severe ketonemia (with BHB 3.0 mmol/L) by the following day. For patients with T1D who are using a sodium-glucose cotransporter-2 (SGLT2) inhibitor, if there is a suspension of continuous subcutaneous insulin infusion (CSII), then the rate of increase in BG (but not BHB) is lower than without the SGLT2 inhibitor.13,17
Causes of Occlusion
An impediment to effective insulin delivery is an occlusion of insulin flow. Disrupted insulin delivery can also occur because of kinking of tubing, a bent cannula, precipitation of insulin within the cannula, air bubbles in the tubing, or leakage from the reservoir, the cannula, or the connection between the reservoir and the cannula. 25 Insulin delivery might also be impeded because of skin problems at the infusion site, such as scarring, lipohypertrophy, or infections.
In a study with older generations of insulin pumps, case reports of insulin pump failure were gathered from 40 pediatric centers in the Diabetes Study Group of the Italian Society of Pediatric Endocrinology and Diabetes in 2013. 26 At that time, the prevalence of insulin pump use was only 13.9% with a pump replacement incidence of 0.21 events per person-year; insulin pump failure or malfunction was responsible for 56% of pump replacements. Prolonged suspension, if not recognized by an occlusion alarm, could result in moderate to severe risk of metabolic consequences.
Air Bubbles
A common cause of occlusion is the presence of air bubbles in the pump or tubing, which block insulin delivery from the pump to the subcutaneous tissue via the infusion set. Generally, these were found to occur more often in adolescent pump users than younger pediatric pump users 27 and also to occur more frequently at the end of a pump’s reservoir. 28 Some pumps now have technology available to sequester air bubbles and prevent the delivery of air boluses masquerading as insulin. 29 Occlusions may occur when traditional three-day infusion sets are used longer than this amount of time. 30
Limitations
We did not identify any studies with children that met our inclusion criteria. This could be important because children, especially younger children four to nine years old, are particularly sensitive to interruption of insulin infusion. 24 None of the clinical studies followed participants until they developed severe hyperglycemia or severe ketonemia, so our times to these metabolic abnormalities are the result of extrapolating average rates of increase. The rise in glucose and ketones could be influenced by the size of the subcutaneous insulin depot. The articles that we selected for extraction ended up being limited to studies using insulin analogs (insulin lispro and insulin aspart), and faster-acting or slower-acting insulins might produce different results.
Conclusion
Calculations from clinical studies and a simulation model predicted similar times to moderate and severe metabolic complications subsequent to interruption of insulin infusion. Following a CSII occlusion, moderate/severe metabolic complications can typically occur within 6 to 12 hours.
Supplemental Material
sj-docx-1-dst-10.1177_19322968241280386 – Supplemental material for Time to Moderate and Severe Hyperglycemia and Ketonemia Following an Insulin Pump Occlusion
Supplemental material, sj-docx-1-dst-10.1177_19322968241280386 for Time to Moderate and Severe Hyperglycemia and Ketonemia Following an Insulin Pump Occlusion by David C. Klonoff, Alessandra T. Ayers, Cindy N. Ho, Chiara Fabris, María Fernanda Villa-Tamayo, Eleanor Allen, Eda Cengiz, Laya Ekhlaspour, Jenise C. Wong, Lutz Heineman and Michael A. Kohn in Journal of Diabetes Science and Technology
Footnotes
Acknowledgements
The authors acknowledge Annamarie Sucher-Jones for her editorial expertise.
Abbreviations
BG, blood glucose; BHB, beta-hydroxybutyrate; CGM, continuous glucose monitor; CSII, continuous subcutaneous insulin infusion; PwT1D, persons with type 1 diabetes; T1D, type 1 diabetes.
Declaration of Conflicting Interests
The author(s) declared the following potential conflicts of interest with respect to the research, authorship, and/or publication of this article: D.C.K. is a consultant for Afon, Embecta, GlucoTrack, Lifecare, Novo, Samsung, and Thirdwayv. C. N. H. has nothing to disclose. A.T.A. has nothing to disclose. C.F. reports receiving research support from Novo Nordisk A/S and Dexcom, Inc handled by the University of Virginia, and patent royalties from Novo Nordisk A/S and Dexcom, Inc handled by the University of Virginia’s Licensing and Ventures Group. M.F.V.-T. reports receiving patent royalties from Dexcom, Inc handled by the University of Virginia’s Licensing and Ventures Group. E.A. has nothing to disclose. E.C. has served on the scientific advisory board of Novo Nordisk, Eli Lilly, MannKind, Arecor, Portal Insulin, Provention Bio, Tandem, and Ypsomed. L.E. receives salary support from NIDDK; has received research support from JDRF, Medtronic, MannKind, and Abbot and has served on the advisory board of Diabetes Center Berne, Sequel, and Medtronic. She has received consulting fees from Jaeb, Tandem Diabetes Care, and Ypsomed and has received honorarium fees from Medtronic and Insulet. J.C.W. has received research support from Dexcom, Inc and Tandem Diabetes Care. L.H. is a shareholder of the Profil Institut für Stoffwechselforschung GmbH, Neuss, Germany, Science Consulting in Diabetes GmbH Düsseldorf, and diateam GmbH, Bad Mergentheim, and Düsseldorf. L.H. is a consultant for several companies that are developing novel diagnostic and therapeutic options for diabetes treatment. M.A.K. has nothing to disclose.
Funding
The author(s) disclosed receipt of the following financial support for the research, authorship, and/or publication of this article: This article was supported by a grant from Sequel.
ORCID iDs
Supplemental Material
Supplemental material for this article is available online.
References
Supplementary Material
Please find the following supplemental material available below.
For Open Access articles published under a Creative Commons License, all supplemental material carries the same license as the article it is associated with.
For non-Open Access articles published, all supplemental material carries a non-exclusive license, and permission requests for re-use of supplemental material or any part of supplemental material shall be sent directly to the copyright owner as specified in the copyright notice associated with the article.