
Abstract
Background:
Despite abundant evidence demonstrating the benefits of continuous glucose monitoring (CGM) in diabetes management, a significant proportion of people using this technology still struggle to achieve glycemic targets. To address this challenge, we propose the Accu-Chek® SmartGuide Predict app, an innovative CGM digital companion that incorporates a suite of advanced glucose predictive functionalities aiming to inform users earlier about acute glycemic situations.
Methods:
The app’s functionalities, powered by three machine learning models, include a two-hour glucose forecast, a 30-minute low glucose detection, and a nighttime low glucose prediction for bedtime interventions. Evaluation of the models’ performance included three data sets, comprising subjects with T1D on MDI (n = 21), subjects with type 2 diabetes (T2D) on MDI (n = 59), and subjects with T1D on insulin pump therapy (n = 226).
Results:
On an aggregated data set, the two-hour glucose prediction model, at a forecasting horizon of 30, 45, 60, and 120 minutes, achieved a percentage of data points in zones A and B of Consensus Error Grid of: 99.8%, 99.3%, 98.7%, and 96.3%, respectively. The 30-minute low glucose prediction model achieved an accuracy, sensitivity, specificity, mean lead time, and area under the receiver operating characteristic curve (ROC AUC) of: 98.9%, 95.2%, 98.9%, 16.2 minutes, and 0.958, respectively. The nighttime low glucose prediction model achieved an accuracy, sensitivity, specificity, and ROC AUC of: 86.5%, 55.3%, 91.6%, and 0.859, respectively.
Conclusions:
The consistency of the performance of the three predictive models when evaluated on different cohorts of subjects with T1D and T2D on different insulin therapies, including real-world data, offers reassurance for real-world efficacy.
Keywords
Introduction
Diabetes Technology
Despite increased utilization of technology in diabetes care,1,2 and in particular of continuous glucose monitoring (CGM), where extensive evidence showcasing its effectiveness is available, 3 a significant proportion of individuals still fail to meet glycemic targets. 4 While automated insulin delivery (AID) has shown promise in bridging this gap to some extent, 5 it is widely acknowledged that this solution is not suitable for everyone. 6 Therefore, it is crucial to alleviate the burden of diabetes self-management and empower people with diabetes (PwDs) in their daily diabetes management, providing them with user-friendly and intelligent technology that instills confidence in superior glucose control. 7
Diabetes Self-Management Digital Tools
Currently, there is a wide range of digital mobile platforms available that offer various solutions for managing nutrition, physical activity, glucose monitoring, and insulin titration, among other aspects.8,9 However, many of these solutions lack sufficient scientific evidence to support their efficacy, have issues with interoperability and standardization, suffer from inadequate data security measures, possess poor usability, and may not offer the needed level of personalization. 10 A step toward addressing these challenges is exemplified by a recently published white paper aiming to establish a framework for the development of quality standards and measures for diabetes digital technologies. 11
Significant progress has been made in research on advanced diabetes self-management tools utilizing CGM technology and artificial intelligence.12-14 These advancements cover areas such as glucose level prediction,15-17 particularly adverse glycemic events,18,19 and insulin dose recommendations.20-25
It is worth highlighting the importance of considering human factors in the development of diabetes self-management applications, which is widely acknowledged in scientific discourse.26-29 Maximizing user acceptance is crucial for the successful implementation of such tools; hence, usability engineering plays a pivotal role in meeting this objective while ensuring compliance with design control requirements (eg, IEC 62366-1:2015).
Glucose Prediction
The prediction of future glucose levels, or glycemic events such as hypoglycemia and hyperglycemia, is commonly achieved through the utilization of CGM-driven glucose prediction models. 30 The scientific literature encompasses a wide range of glucose prediction models, which can be categorized based on various criteria.
The majority of proposed models adopt a data-driven approach, particularly relying on machine learning (ML) techniques. 31 There is evidence suggesting that data-driven approaches may outperform traditional approaches based on physiological principles, albeit at the cost of reducing interpretability. 32
In terms of the prediction horizon, the majority of existing works focus on short-term predictions, typically within a timeframe of less than 60 minutes.33,18 Regression-based approaches are commonly employed in this context. Models that consider a mid-term horizon, ranging from 60 to 240 minutes, are relatively less prevalent.34,16,17 Regression remains the preferred approach for this timeframe. For both short-term and mid-term horizons, the detection of hypoglycemia is the most commonly addressed application. 35
Finally, there are works that focus on long-term glucose prediction, specifically targeting the detection of overnight hypoglycemia. These approaches primarily employ a classification-based approach.36,37,19
In addition to CGM data, insulin and carbohydrates are the most frequently employed input signals in glucose prediction models. The inclusion of exercise and stress-associated signals, such as accelerometry, skin temperature, heart rate, and skin conductance, is relatively limited due to the scarcity of data sets containing this type of information.38,39,18,24
Finally, when deciding between population-based models and individual-based models, it is important to consider their respective advantages and challenges. Population-based models usually benefit from being trained off-line on a larger data set that includes multiple subjects, potentially improving their ability to generalize. Individual-based models have the potential for performance enhancements, 40 but they are more susceptible to the “cold-start” problem, which occurs when there is insufficient data during system initialization. Additionally, these models usually require training while in the production environment, leading to additional technical and regulatory complexities. A promising approach is the utilization of transfer learning or meta-learning, where new users are initially provided with a population-based model which is subsequently fine-tuned with individual data as it becomes available.41,17
Despite extensive research efforts in developing CGM-driven glucose prediction models, the availability of commercial solutions incorporating these functionalities remains limited. Challenges include establishing agreements with CGM manufacturers and meeting rigorous regulatory requirements. 10 Some commercialized solutions offer short-term prediction capabilities,42-44 while others are no longer accessible. 45 Other existing solutions, some of them open-source, may lack regulatory oversight and scientific evidence.46-48
This manuscript presents the Accu-Chek® SmartGuide Predict app, an innovative digital companion app that empowers individuals using the Accu-Chek® SmartGuide CGM sensor in effectively managing their diabetes. The app utilizes advanced glucose prediction and pattern detection technology, with a user-friendly interface. Specifically, we present a detailed description of the app’s functionalities while providing evidence regarding the validation of the glucose predictive models powering such functionalities. By doing so, we aim to equip the readers with the necessary information needed to discern the potential value of the app for PwDs as discussed in the works by Ehrmann et al, 49 and Glatzer et al, 50 both published within the same special issue as this article.
Methods
The Accu-Chek® SmartGuide Predict App
The Accu-Chek® SmartGuide Predict app, hereafter referred to as the Predict app, serves as a CGM digital companion specifically designed for adult PwDs who are utilizing the Accu-Chek®c< SmartGuide sensor on a flexible insulin regimen (Figure 1).
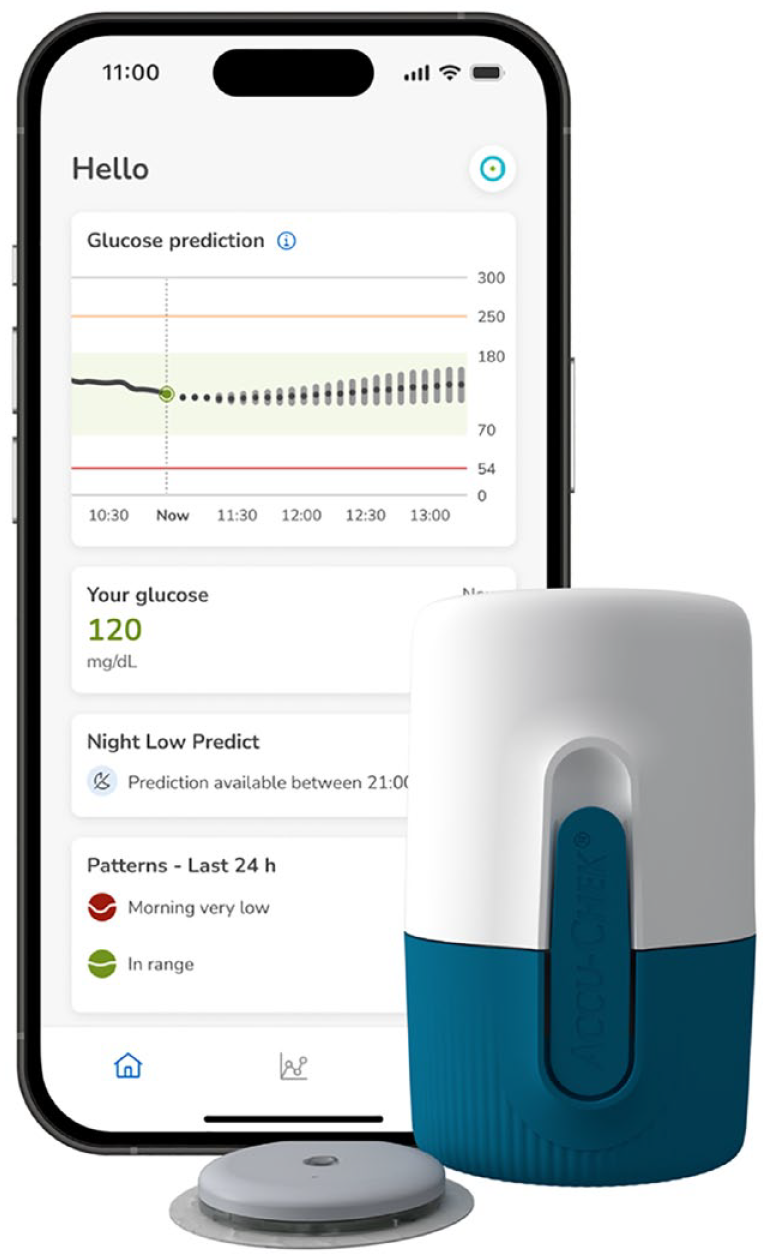
The Accu-Chek SmartGuide Predict app along with the Accu-Chek SmartGuide sensor.
Unlike most CGM digital companions that visualize current and historical CGM values with contextual information, like insulin injections or meals, the Predict app aims to go beyond reactive usage and establish a proactive, data-driven daily diabetes management system.
To achieve this objective, the app integrates state-of-the-art glucose predictive and pattern recognition capabilities while maintaining an intuitive user interface that effectively communicates the user’s past, current, and future glycemic status. In particular, the app provides a two-hour glucose forecast, alerts for low glucose within 30 minutes, alerts for overnight hypoglycemia for proactive interventions at bedtime, and automatically detects and visualizes daily and weekly glucose patterns.
The development of the app followed a user-centered design approach throughout the design and development stages which relied on collecting objective user feedback through a series of usability studies.
The app combines on-device and cloud components, providing several advantages. Notably, this setup enhances maintainability, scalability, and safety, albeit with the requirement of an internet connection for the predictive components. Additionally, easy updates to the app’s functionalities are allowed without requiring users to update their smartphone applications.
The Predict app receives various data sources through the Accu-Chek SmartGuide app, including real-time CGM readings, insulin bolus, meal carbohydrate information, and user settings.
In terms of compliance, the Predict app has the CE label under Medical Device Regulation class 2a and has been designed, implemented, tested, and validated in accordance with current medical software device regulations and standards, such as IEC 62304 and directives 95/46/EC and 2002/58/EC. Furthermore, the app fully complies with all requirements outlined by the General Data Protection Regulation (GDPR).
To cater to a wide range of users, both Android (Google LLC, Mountain View, CA, USA) and iOS (Apple, Cupertino, CA, USA) versions of the app have been developed.
It is worth mentioning that the Predict app aligns with the quality assessment considerations as recently published by the NCQA and ADA. 11
Glucose Predict functionality
The Glucose Predict (GP) functionality within the Predict app offers continuous and real-time two-hour glucose level predictions for the user in five-minute intervals. Alongside the predicted glucose values, the app also provides uncertainty estimates, known as error bounds (Figure 2).
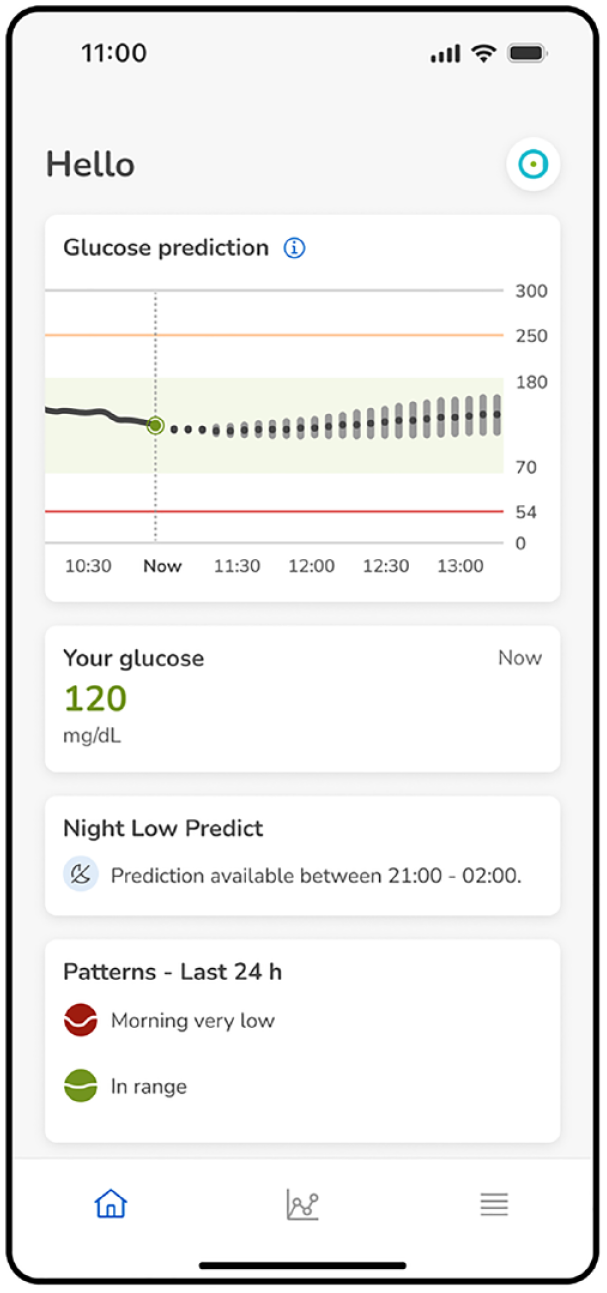
Main Predict app screen displaying the GP functionality (top graph) including the predicted glucose values (dotted line) accompanied by their corresponding error bounds (gray error bars). The solid line corresponds to the past CGM excursion, the vertical dashed line indicates the current time, and the green dot indicates the current CGM value.
By providing users with real-time glucose predictions and their corresponding uncertainty estimates, the GP functionality aims to empower users to make informed decisions and take proactive measures to effectively manage their glycemic control. While the specific ways in which users interpret and utilize the information provided by GP may vary, some general recommendations for utilizing this information are being summarized in an article by Glatzer et al, 50 published in the same special issue of this journal.
The GP functionality is powered by a regression model utilizing a gated recurrent unit (GRU)-based neural network architecture. 51 The input data used by the GP model comprises a set of eight features, which are derived from recent CGM measurements, bolus insulin on board estimates, unabsorbed carbohydrate estimates, historical CGM averages, and time of day. The selection of the feature vector was determined through a recursive feature addition method applied to a set of 125 features. Of the selected model inputs, the recent CGM measurements were among the most important inputs in relation to the predictive performance of the GP model.
Error bounds were computed for each of the five-minute intervals. The methodology used for calculating these bounds was based on the accuracy metric outlined in the ISO 15197:2013 standard. The size of the error bounds was selected to provide a coverage of 50%. This decision was based on an evaluation of both medical and usability aspects, which incorporated valuable insights from the user feedback gathered during the usability studies.
Low Glucose Predict functionality
The Low Glucose Predict (LGP) functionality within the Predict app provides continuous estimations of the risk of experiencing a low glucose event within the next 30 minutes. When the predicted risk of a low glucose event is high, the user is notified through a push notification (Figure 3a). The purpose of this notification is to enable the user to take proactive measures, such as consuming a snack, to prevent critical situations and reduce the time spent below their customized glucose threshold, selected from the range 60 to 100 mg/dL. By clicking on the push notification, the Predict app displays possible actions to address hypoglycemia, following the guidelines set forth by the American Diabetes Association (ADA) (Figure 3b) 52 . Finally, pressing at the “X” on the top left corner takes the user to the home screen where a dedicated card also indicates the high risk of low glucose (Figure 3c).
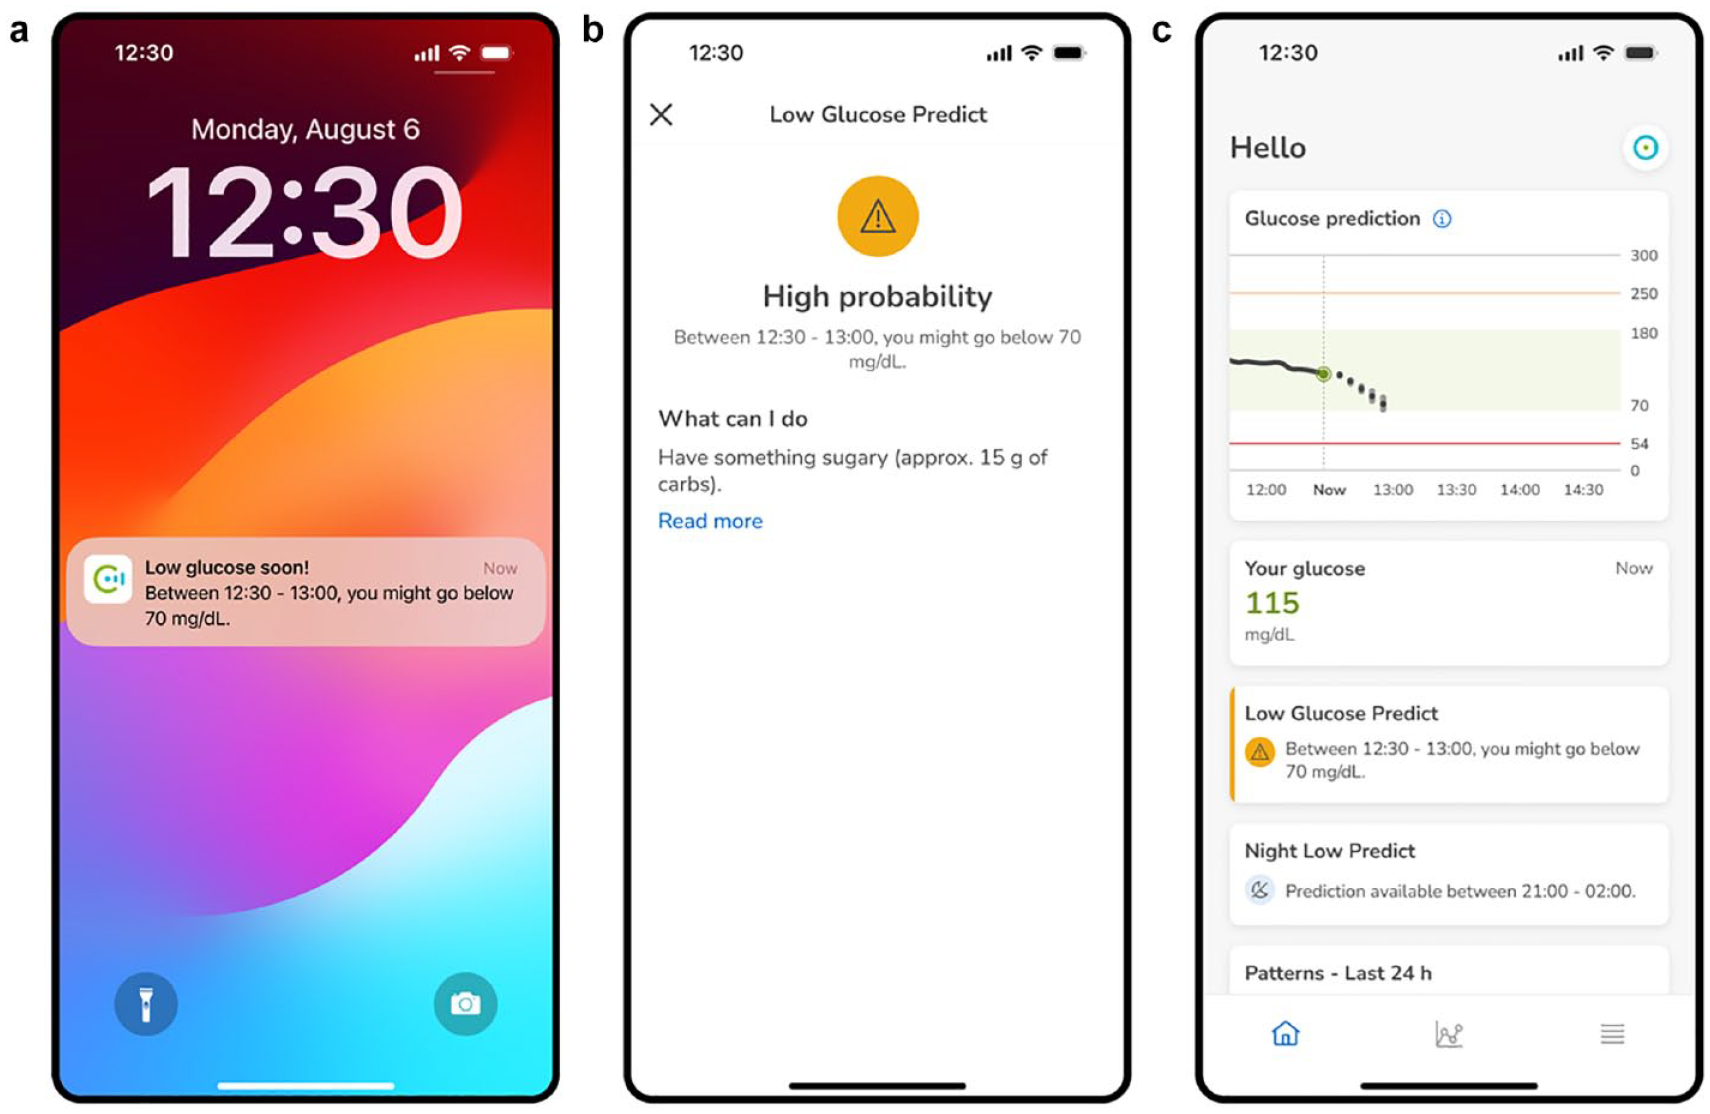
Predict app screenshots of the LGP functionality, featuring: (a) push notification indicating a risk of low glucose within the next 30 minutes. (b) Screen indicating possible actions to minimize the risk of low glucose within the next 30 minutes. (c) Main Predict app screen showcasing a card indicating a risk of low glucose within 30 minutes.
The LGP functionality utilizes a binary classification model to assess the probability of a low glucose event occurring within the subsequent 30 minutes. This binary classifier is constructed using the XGBoost algorithm, which employs a gradient-boosting tree-based approach. 53
The LGP model takes into account a set of five features as inputs, which are derived from the current CGM level, CGM trends at different time windows, and time. The selection of these specific features was determined through a recursive feature addition process, conducted on a larger set of 34 features. Of the selected features, the recent CGM measurements and the CGM trends were the most important inputs in relation to the predictive performance of the LGP model.
Night Low Predict functionality
The Night Low Predict (NLP) functionality within the Predict app offers users an estimated risk and approximate timing of experiencing hypoglycemia during the night, empowering them to take preventive measures before falling asleep. Hypoglycemia is defined as three consecutive CGM measurements below 70 mg/dL.
54
NLP calculates the risk for the first and second half of the night, with a night being defined as the seven hours after triggering the prediction. If the confidence on the calculated risks is not high enough for the first (0-3.5 hours) or second half of the night (3.5-7 hours), the risk corresponding to the full night period is provided to the user. High estimated risk leads to NLP displaying possible actions for minimizing the risk of overnight hypoglycemia. The user can actively request the triggering of the NLP model at bedtime or schedule a push notification if the estimated risk is high (Figure 4a), with either option available from 9
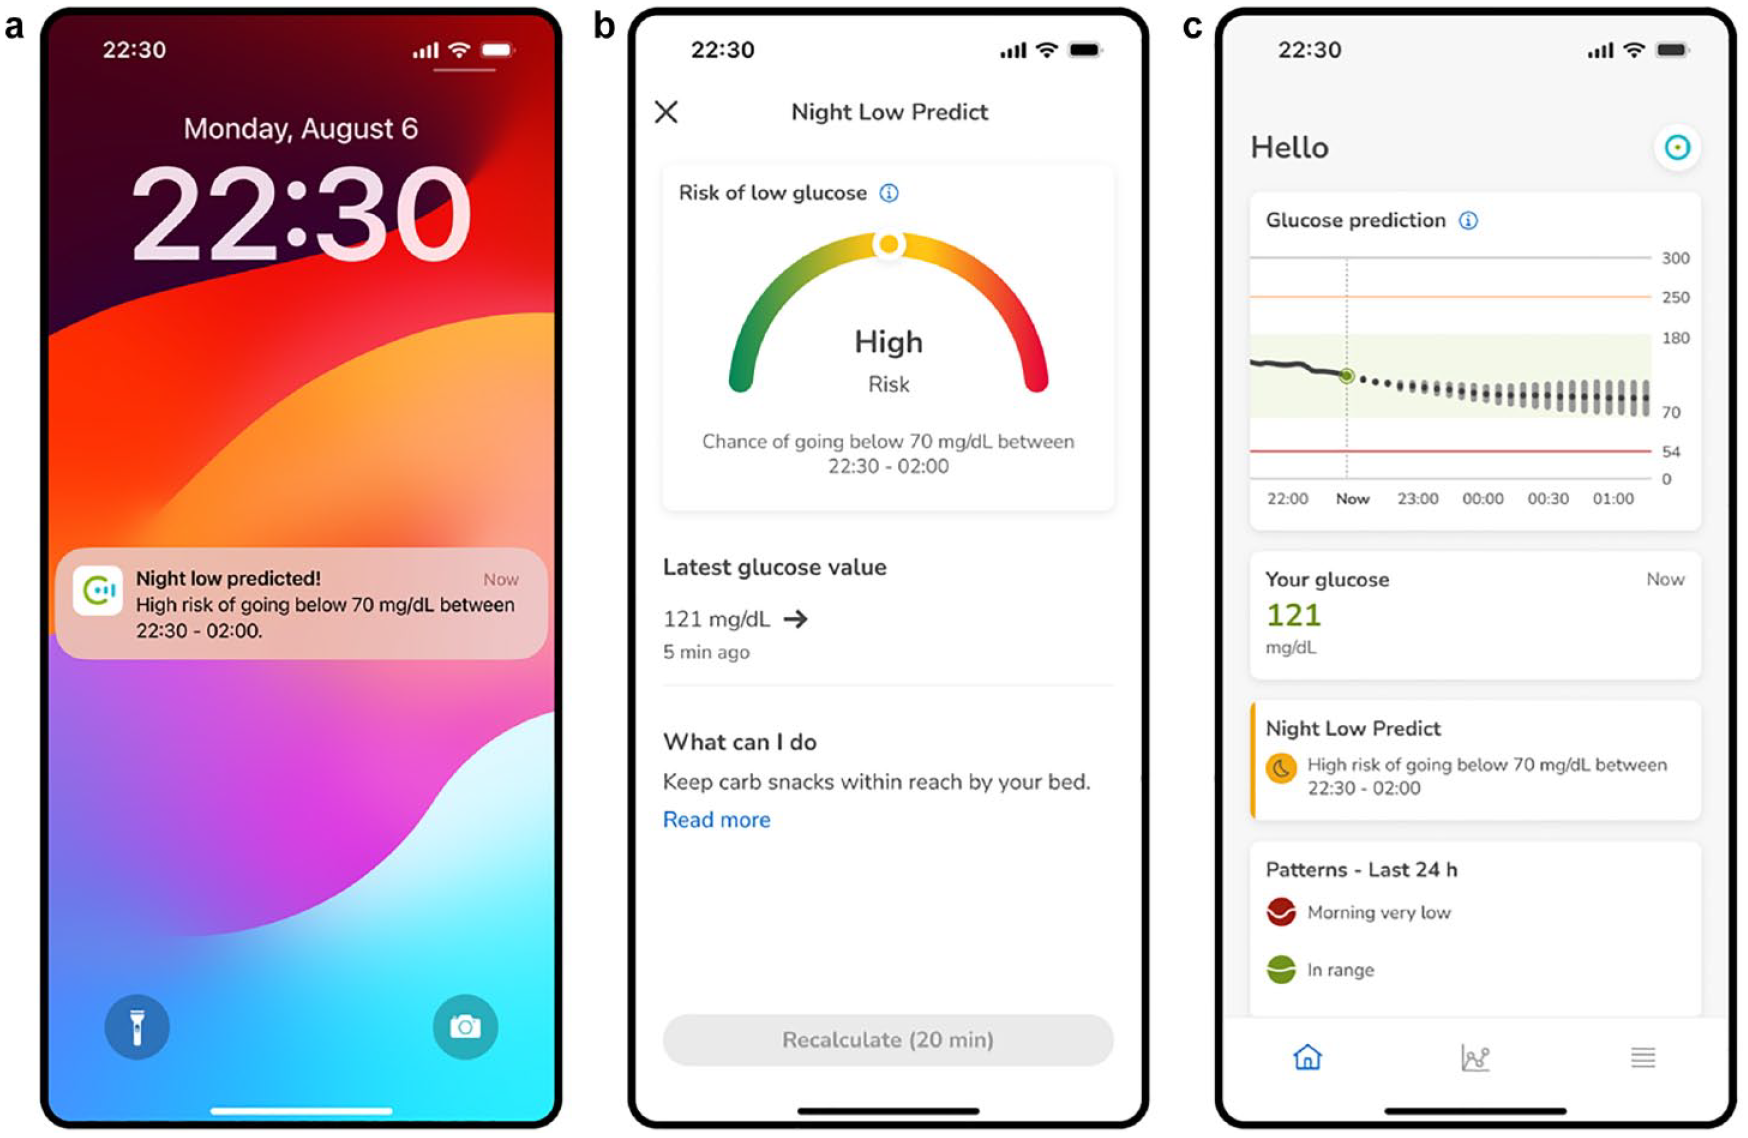
Predict app screenshots of the NLP functionality, featuring: (a) Push notification indicating a high risk of glucose levels dropping below 70 mg/dL between 22:30 and 02:00. (b) Dedicated screen presenting the predicted risk in a gauge format that is displayed when requesting the triggering of the NLP functionality or pressing at the push notification. (c) Main Predict app screen showcasing a card indicating a high risk of a night low glucose.
The NLP functionality employs a multi-class classifier model to predict the risk of experiencing hypoglycemia. This risk estimator is constructed using an XGBoost decision-tree-based classification model. 53 The NLP model takes into account a set of nine features as inputs, which are derived from current and past CGM, CGM trends, bolus insulin on board, and time. The selection of these specific features was determined through a recursive feature addition process, conducted on a set of 174 features. Of the selected features, the recent CGM measurements, the CGM trends, and insulin on board were among the most important inputs in relation to the predictive performance of the NLP model.
Glucose Patterns functionality
For an overview of the Glucose Pattern functionality, the reader is referred to Section B of the Supplementary Material.
Data, Model Training, and Evaluation
Data sets
The three glucose predictive functionalities were developed using a proprietary data set from a clinical study which we refer to as the PREDICT study (“Study of Advanced Analytics for Blood Glucose PREDICTion,” 2017). The PREDICT study included 221 adult subjects with T1D on multiple daily injections (MDI) therapy. They all wore a real-time CGM sensor and an activity tracker device over two months and were asked to log insulin, other medication, mood, and nutrition data via a dedicated app. In particular, 200 subjects were randomly selected for training the models (PREDICT-TRAIN), while the remaining 21 subjects were left for testing the performance of the models on unseen data (PREDICT-TEST). Table S2 in the Supplementary Material shows the demographic information corresponding to the PREDICT study.
To further evaluate the performance of the predictive models, a selection of data sets including individuals with both T1D and T2D receiving MDI and insulin pump therapy was utilized. For subjects with T1D, the publicly available REPLACE-BG data set (NCT02258373) was employed (n = 226). 55 It is important to note that the subjects in the REPLACE-BG data set wore insulin pumps that did not include any automatic hypoglycemia management based on CGM. For subjects with T2D, a proprietary data set was utilized, which represents real-world data collected through the mySugr app (mySugr GmbH, Vienna, Austria) (n = 59). This data set is referred to as the MYSUGR-T2D data set. Table S3 in the Supplementary Material displays the demographic characteristics of the MYSUGR-T2D data set. Tables S4 and S5 in the Supplementary Material present the data characteristics of the data sets utilized for training and evaluation purposes.
The predictive models were evaluated on both individual data sets and a pooled data set created from the combination of the three data sets. The pooling process involved the following steps: (1) loading the three data sets, (2) identifying the data set with the lowest number of samples as the baseline data set, (3) downsampling the data from the remaining data sets to match the number of samples in the baseline data set, and (4) combining the baseline data set and the downsampled data sets to create the pooled data set.
Data processing
To process the input data for each predictive model, the required input features were computed based on the available CGM, carbohydrates, bolus insulin information, and time of the day. This includes standardizing the data frequency to fixed five-minute intervals, handling outliers (eg, clipping insulin bolus and carbohydrate entries), calculating the input features, imputing missing features, and scaling the input features.
Data imputation was solely necessary for the neural network-based GP model as the decision tree-based LGP and NLP models inherently possess the ability to handle missing features.
For the GP model, during evaluation, missing CGM-derived features were imputed by substituting them with population means, while missing bolus insulin and carbohydrate derived features were replaced with zero. GP training was conducted only on samples where all the features were available.
Note that for the two decision-tree based models (LGP and NLP), scaling was not needed as they are insensitive to the variance of the data.
Model training
The GP model, which is based on an encoder-decoder sequence-to-sequence architecture, was trained with the TensorFlow library. 56 For the optimization of its hyperparameters, the Optuna library 57 was used. The goal of the optimization process was to maximize the average ISO accuracy over a threefold cross-validation. 58 Specifically, the following hyperparameters were optimized: the number of units in the encoder and decoder layers; the L2 lambda regularizer; the learning rate; the number of samples per batch; and the number of epochs to train the model.
Both the LGP and NLP tree-based models were trained with the XGBoost library. 53 For the optimization of the hyperparameters of the two models, the Optuna library 57 was used. The goal of the optimization process was to maximize the average ROC AUC over a 20-fold cross-validation. Specifically, the following hyperparameters were optimized: learning rate, L1 and L2 regularizers, gamma, subsample size, by-tree subsample size, number of trees, maximum depth of trees, minimum child node weight, maximum step, and booster type.
The hyperparameter search to optimize the three models was based on a random search algorithm and a multivariate Tree-structured Parzen Estimator (TPE) algorithm. 59 The evaluation of the three models on the training data set was done using a 20-fold cross-validation.
Performance metrics
The performance of the GP functionality was evaluated using the Consensus Error Grid (CEG), also known as the Parkes Error Grid, 60 which is commonly used to evaluate glucose prediction algorithms. 61 In particular, the selected metric was the percentage of data points in zones A and B on the grid. Additional metrics frequently used in scientific literature, namely, root mean square error (RMSE) and mean absolute relative deviation (MARD), were also computed. 61
The evaluation metrics for the LGP and NLP functionalities included the area under the receiver operating characteristic curve (ROC AUC), a commonly used metric for assessing the performance of classifiers. 61 In addition, metrics including sensitivity, specificity, and accuracy were evaluated. These metrics were calculated using a classification threshold of 0.3, which was selected through empirical experiments and chosen based on a benefit-risk analysis. The LGP performance was evaluated across a range of customizable low glucose thresholds, spanning from 60 to 100 mg/dL with a step increment of 5 mg/dL. Furthermore, for LGP, the detection lead time, which represents the time elapsed between hypoglycemia detection and its actual occurrence as measured by the CGM, was also calculated.
The NLP performance was evaluated across a range of customizable notification times spanning from 9
To assess the performance of LGP as perceived by the user, we calculated sensitivity, specificity, accuracy, and lead time after limiting to one positive sample per hypoglycemic event only (either the earliest true positive prediction within 30 minutes before the event, or the latest false negative one, whichever is applicable). Furthermore, 30-minute notification freezes described in Section C of the Supplementary Material were considered to reflect actual product use. For simplicity, ROC AUC was calculated by accounting for all true positives and false negatives, and without notification freezes.
If not explicitly stated otherwise, the performance metrics were evaluated across the entire data set, with equal weightage given to each sample.
Baseline models
For comparison purposes, we selected a baseline for each of the predictive models, aiming to emulate, albeit with inherent limitations, the cognitive process of a CGM user when predicting future glycemic outcomes using available CGM information (ie, glucose level and glucose trend). For a description of the baseline algorithms, the reader is referred to Section D of the Supplementary Material.
The statistical significance of the models’ performance compared with their respective baselines was determined using the Student’s t-test. For GP and LGP, performance metrics were computed independently for each subject of the pooled data set, and these results were compared using a paired two-tailed t-test. This approach was, however, not directly feasible for NLP, where the limited amount of data per subject (up to 45 nights in the pooled data) implies few nightly hypos only, leading to very unreliable metrics, especially for ROC AUC. To mitigate this issue, we performed cluster bootstrapping 62 instead for NLP, generating 9999 bootstrapped data sets (selecting subjects randomly with replacement for each), and computed the metrics for each of these. These bootstrapped data set metrics were then supplied for a paired two-tailed t-test.
Performance analysis of proposed and existing methods
For an evaluation of the performance of the proposed glucose predictive models against peer-reviewed studies in the scientific literature, the reader is referred to Section E of the Supplementary Material.
Results
Glucose Predict Evaluation
Figure 5 and Table 1 include the GP performance, at prediction horizons of 30, 45, 60, and 120 minutes, and evaluated on the three selected test data sets and the pooled data set. Similarly, Figure 6 and Table 2 include a performance comparison of GP and its baseline evaluated subject-wise on the pooled data set.
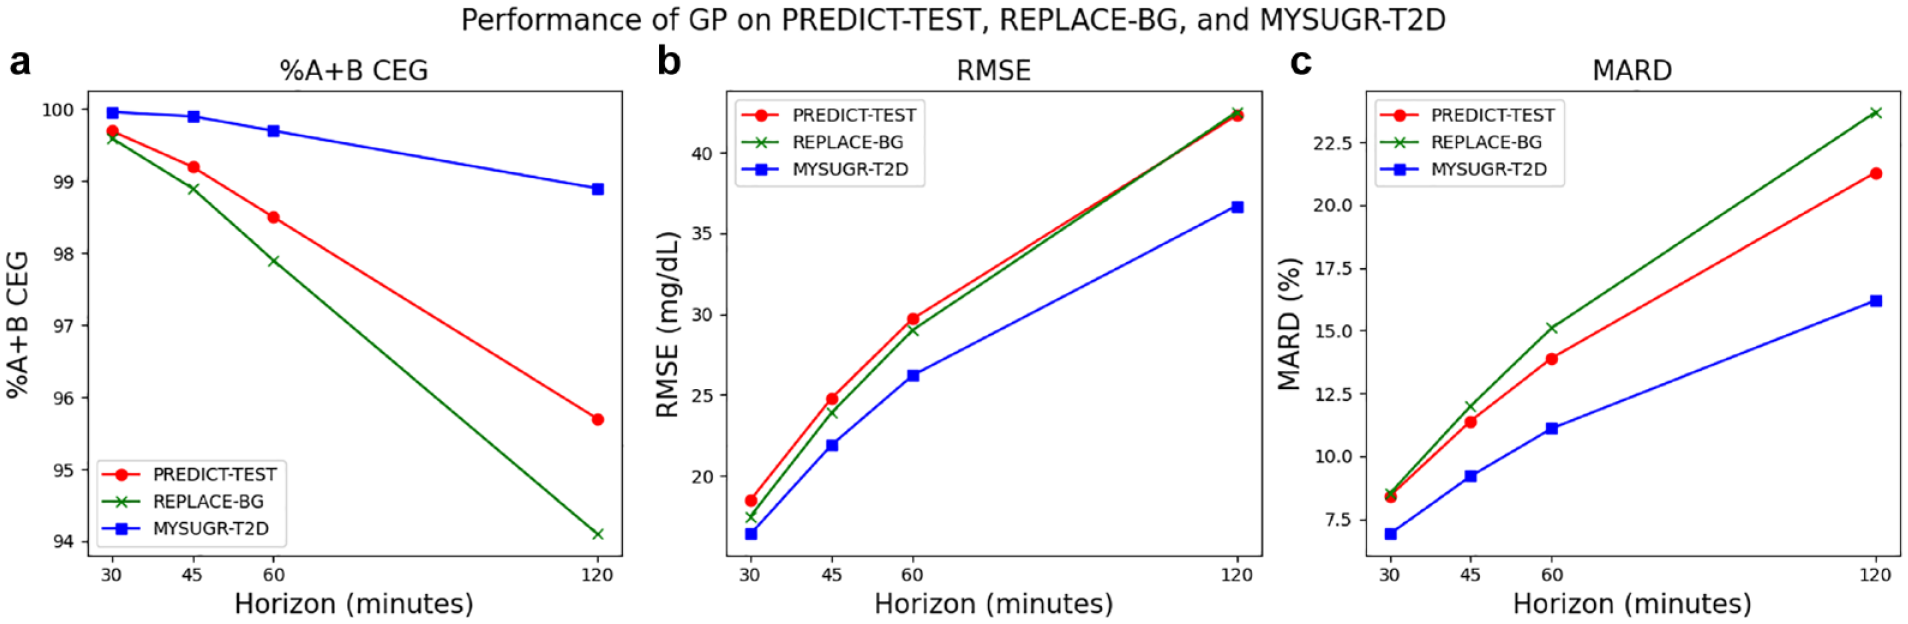
Performance of GP when evaluated on the three test data sets (PREDICT-TEST, REPLACE-BG, and MYSUGR-T2D) for prediction horizons of 30, 45, 60, and 120 minutes. (a) Percentage of data points in zones A and B of the CEG, (b) RMSE, and (c) MARD.
Performance of GP When Evaluated on the Three Test Data Sets (PREDICT-TEST, REPLACE-BG, and MYSUGR-T2D) and Pooled Data Set for the Selected Prediction Horizons of 30, 45, 60, and 120 Minutes.
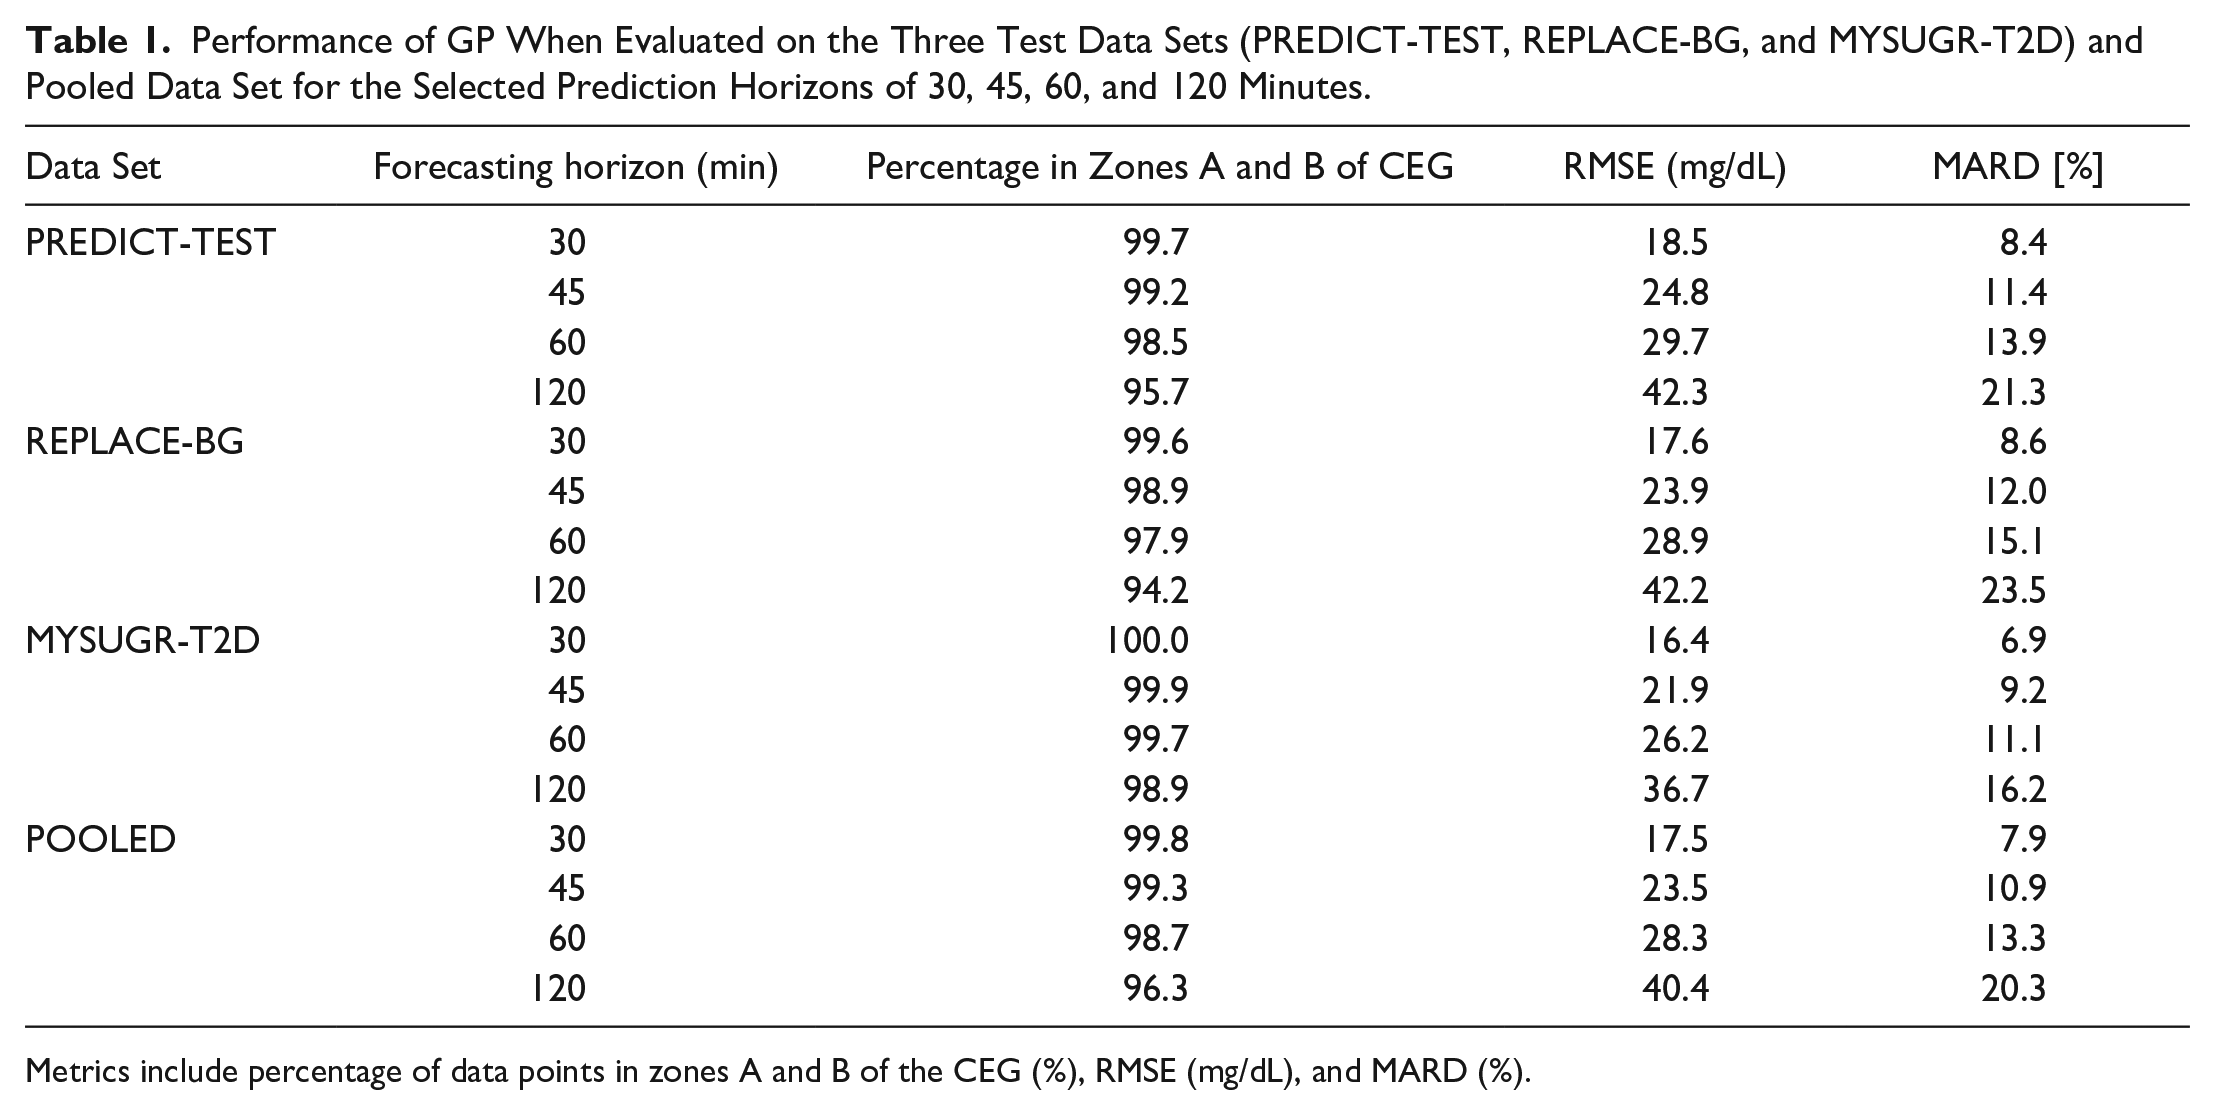
Metrics include percentage of data points in zones A and B of the CEG (%), RMSE (mg/dL), and MARD (%).
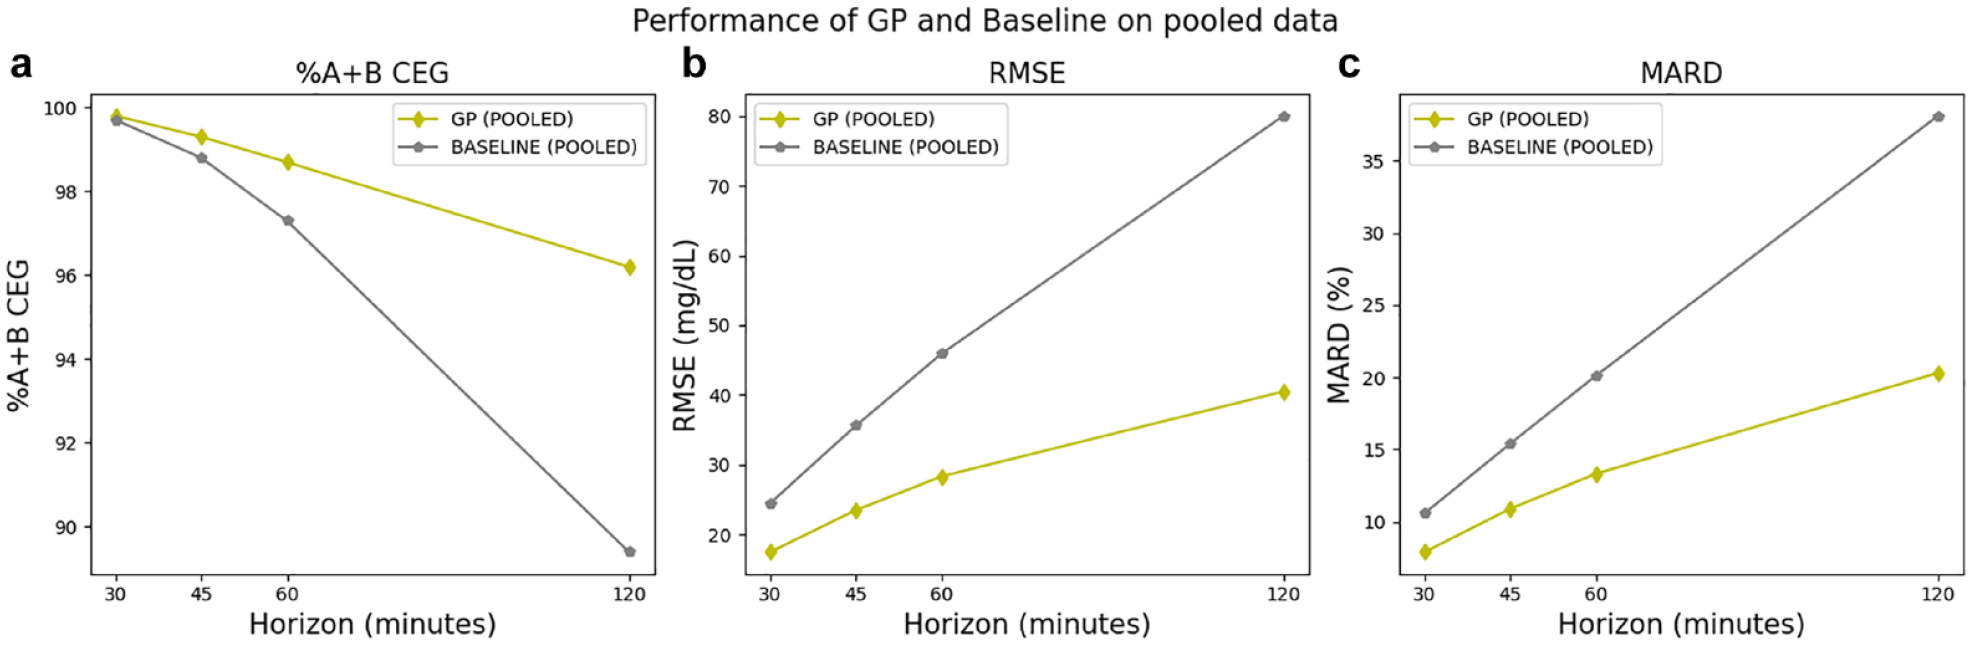
Performance of GP and the baseline model when evaluated subject-wise on the pooled data set for prediction horizons of 30, 60, and 120 minutes. (a) Percentage of data points in zones A and B of the CEG, (b) RMSE, and (c) MARD.
Performance of GP and the Baseline Model When Evaluated Subject-Wise on the Pooled Data Set for Prediction Horizons of 30, 45, 60, and 120 Minutes.
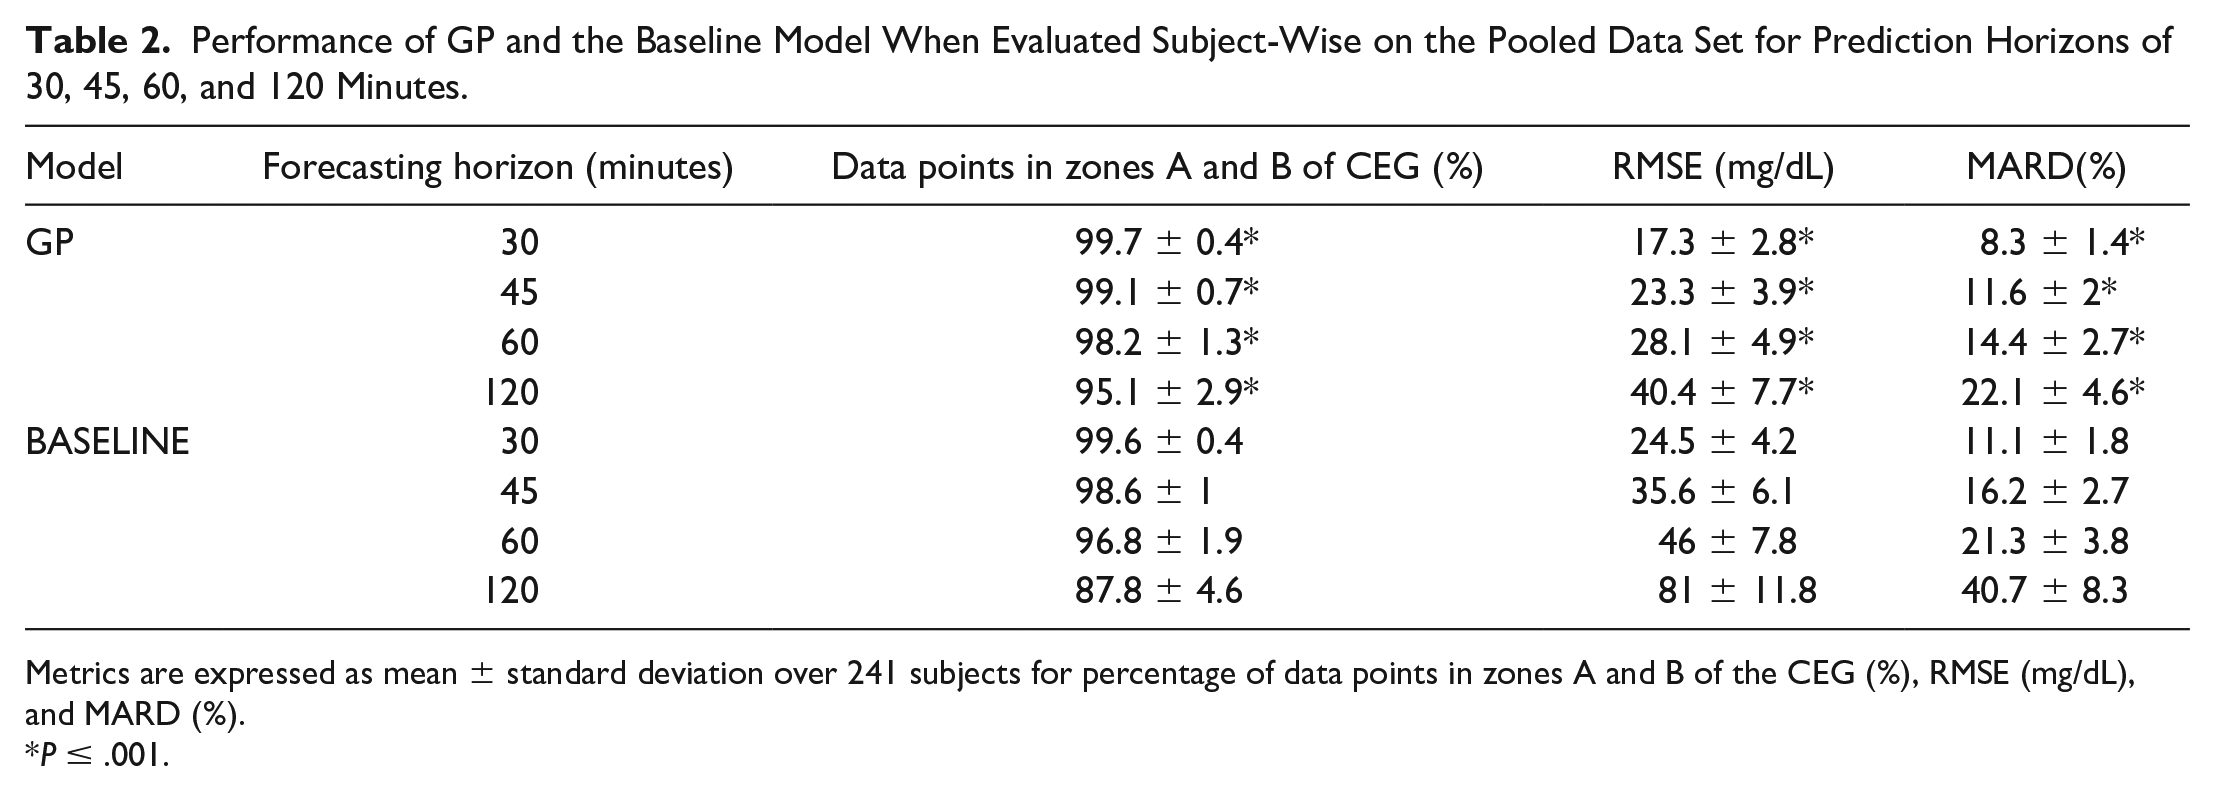
Metrics are expressed as mean ± standard deviation over 241 subjects for percentage of data points in zones A and B of the CEG (%), RMSE (mg/dL), and MARD (%).
P ≤ .001.
Across the three selected test sets, the GP model achieves a similar performance for each of the evaluated prediction horizons. This indicates that the GP model has the ability to generalize to other data sets that utilize different CGM sensors, study designs (REPLACE-BG), real-world data (MYSUGR-T2D), and subject cohorts including individuals with T2D (MYSUGR-T2D) and pump users (REPLACE-BG).
Across the three selected prediction horizons, GP significantly outperforms the baseline model when evaluated on the pooled data set, with the greatest improvement observed for the 120-minute horizon.
LGP Evaluation
Table 3 presents the LGP model’s performance evaluated on the three test sets and pooled data set, while Table 4 showcases the performance comparison of both the LGP model and its baseline when evaluated subject-wise on the pooled data set. ROC AUC results for the LGP model showcase minimal variation across the test data sets.
Performance of the LGP Model When Evaluated on the Three Individual Test Data Sets (PREDICT-TEST, REPLACE-BG, and MYSUGR-T2D) and the Pooled Data Set.
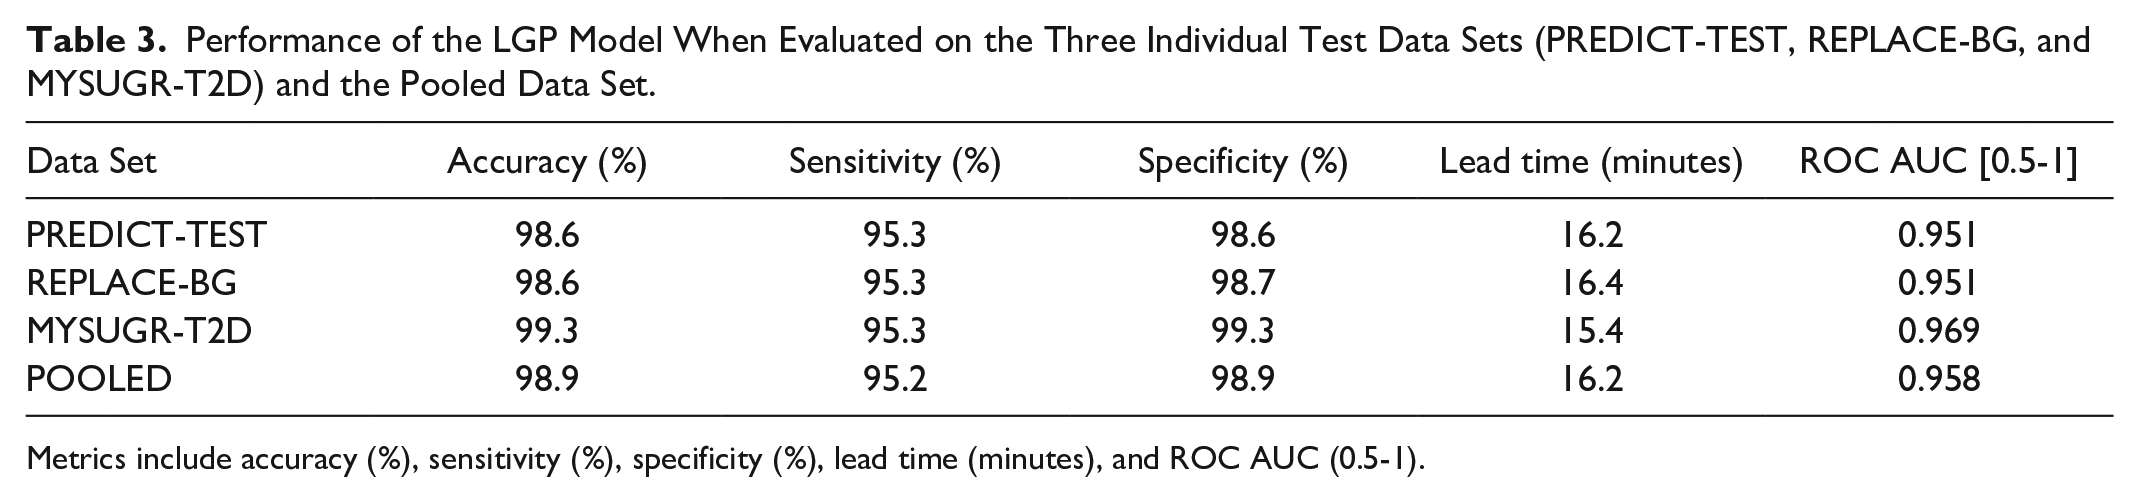
Metrics include accuracy (%), sensitivity (%), specificity (%), lead time (minutes), and ROC AUC (0.5-1).
Performance of the LGP Model and Baseline Model When Evaluated Subject-Wise on the Pooled Data Set.
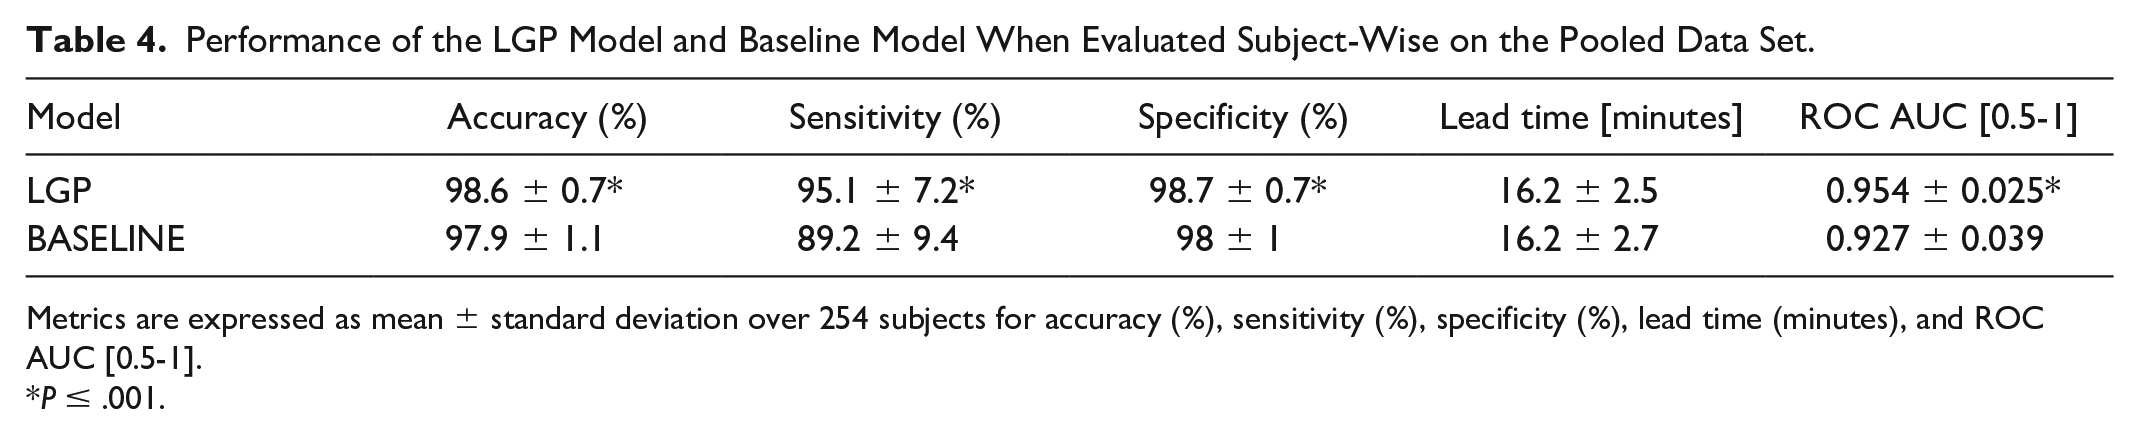
Metrics are expressed as mean ± standard deviation over 254 subjects for accuracy (%), sensitivity (%), specificity (%), lead time (minutes), and ROC AUC [0.5-1].
P ≤ .001.
The MYSUGR-T2D data set, which includes real-world data from individuals with T2D, demonstrated the highest performance level, possibly attributed to the lower glycemic variability observed in this data set (Table S3 of Supplementary Material). This highlights the applicability of the LGP model in real-world settings for individuals with T2D.
Sensitivity and specificity were near-identical across all the test sets. Finally, LGP significantly outperforms the baseline algorithm when evaluated on the pooled data.
NLP Evaluation
The performance of the NLP model in predicting the overall risk of overnight hypoglycemia is presented in Table 5 when evaluated on the three test data sets and the pooled data set. Table 6 showcases the performance of both the NLP model and the baseline model in predicting the overall risk of overnight hypoglycemia when evaluated subject-wise on the pooled data set. Finally, Table 7 demonstrates the performance of the NLP model in predicting the risk of hypoglycemia during the different time intervals of the night (full 7 hours, first half 0-3.5 hours, and second half 3.5-7 hours) when evaluated on the three individual test data sets.
Performance of the NLP Model at Predicting the Overall Risk of Overnight Hypoglycemia When Evaluated on the Three Individual Test Data Sets (PREDICT-TEST, REPLACE-BG, and MYSUGR-T2D) and the Pooled Data Set.
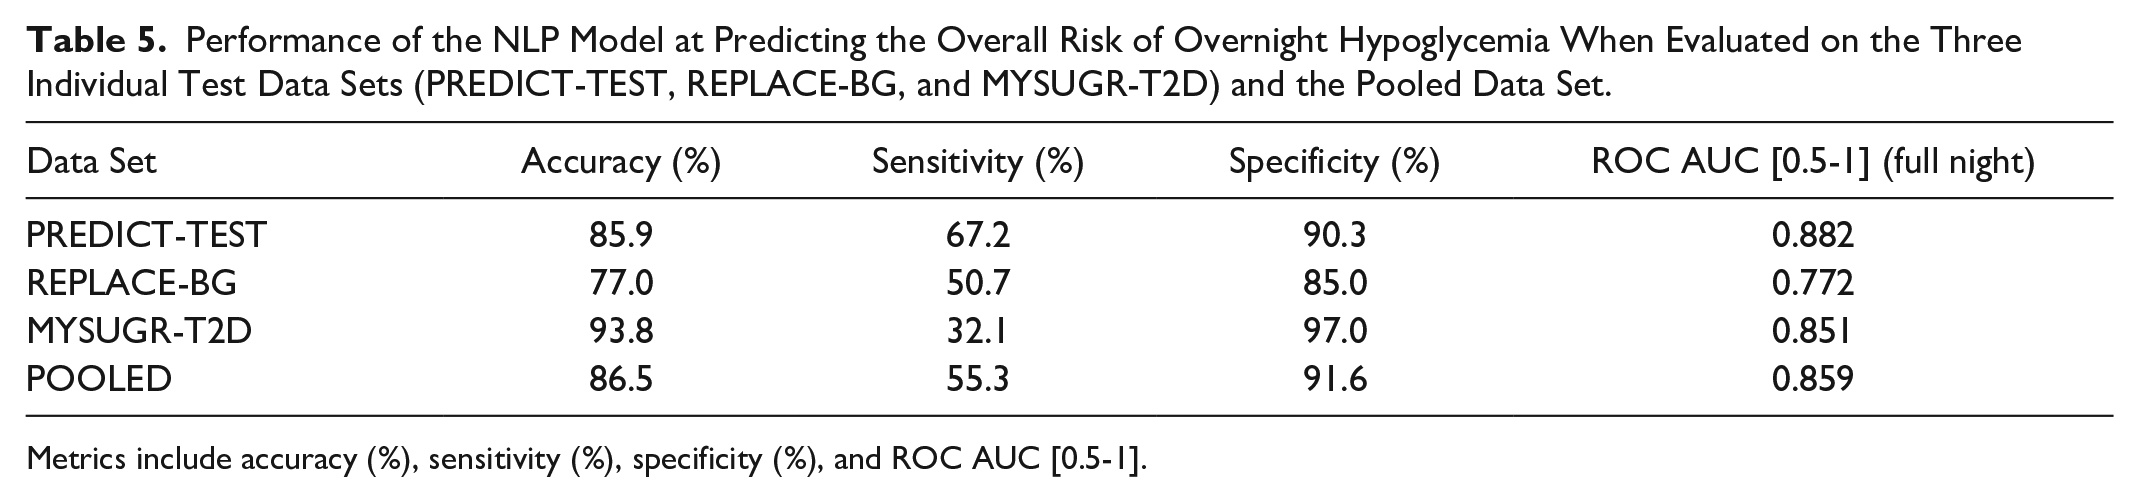
Metrics include accuracy (%), sensitivity (%), specificity (%), and ROC AUC [0.5-1].
Performance of the NLP Model and Baseline Model at Predicting the Overall Risk of Overnight Hypoglycemia When Evaluated on the Pooled Data Set With Subject-Wise Bootstrapping.
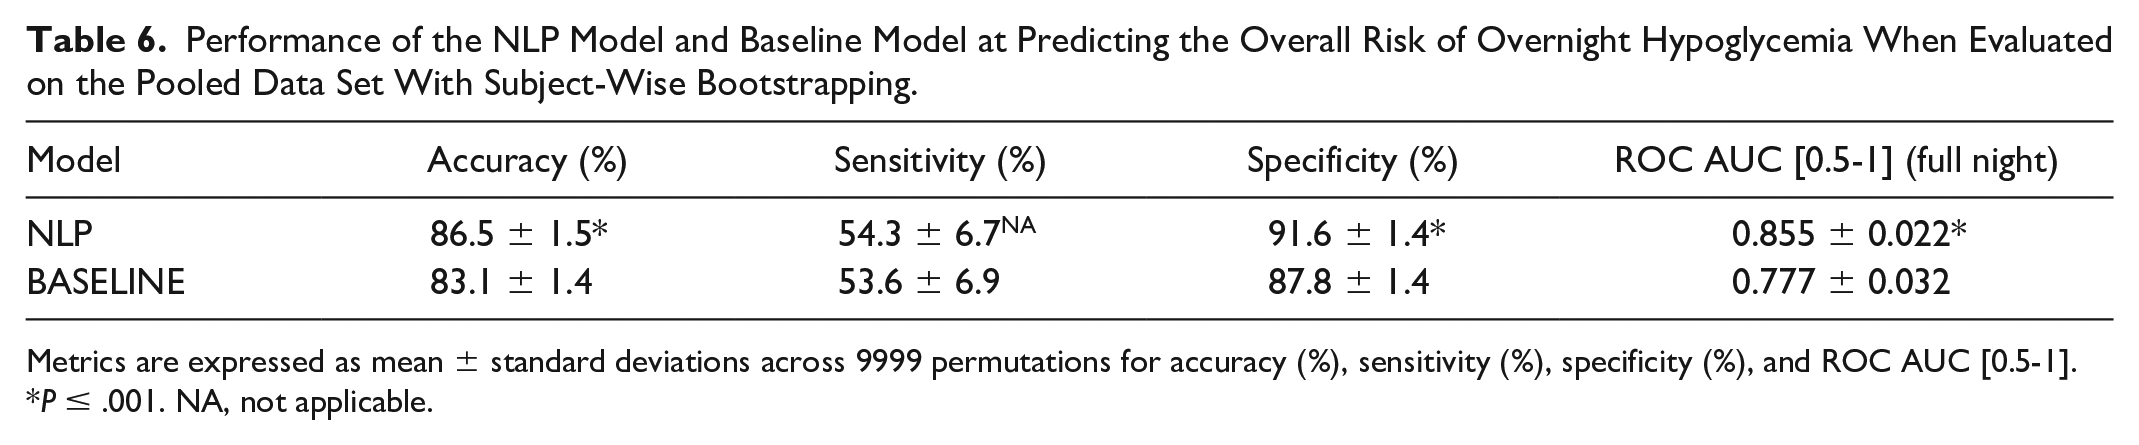
Metrics are expressed as mean ± standard deviations across 9999 permutations for accuracy (%), sensitivity (%), specificity (%), and ROC AUC [0.5-1].
P ≤ .001. NA, not applicable.
Performance, Expressed as ROC AUC [0.5-1], of the NLP Model at Predicting the Risk of Hypoglycemia During the Full (7 hours), First Half (0-3.5 Hours), and Second Half (3.5-7 Hours) of the Night When Evaluated on the Three Individual Test Data Sets (PREDICT-TEST, REPLACE-BG, and MYSUGR-T2D) and the Pooled Data Set.
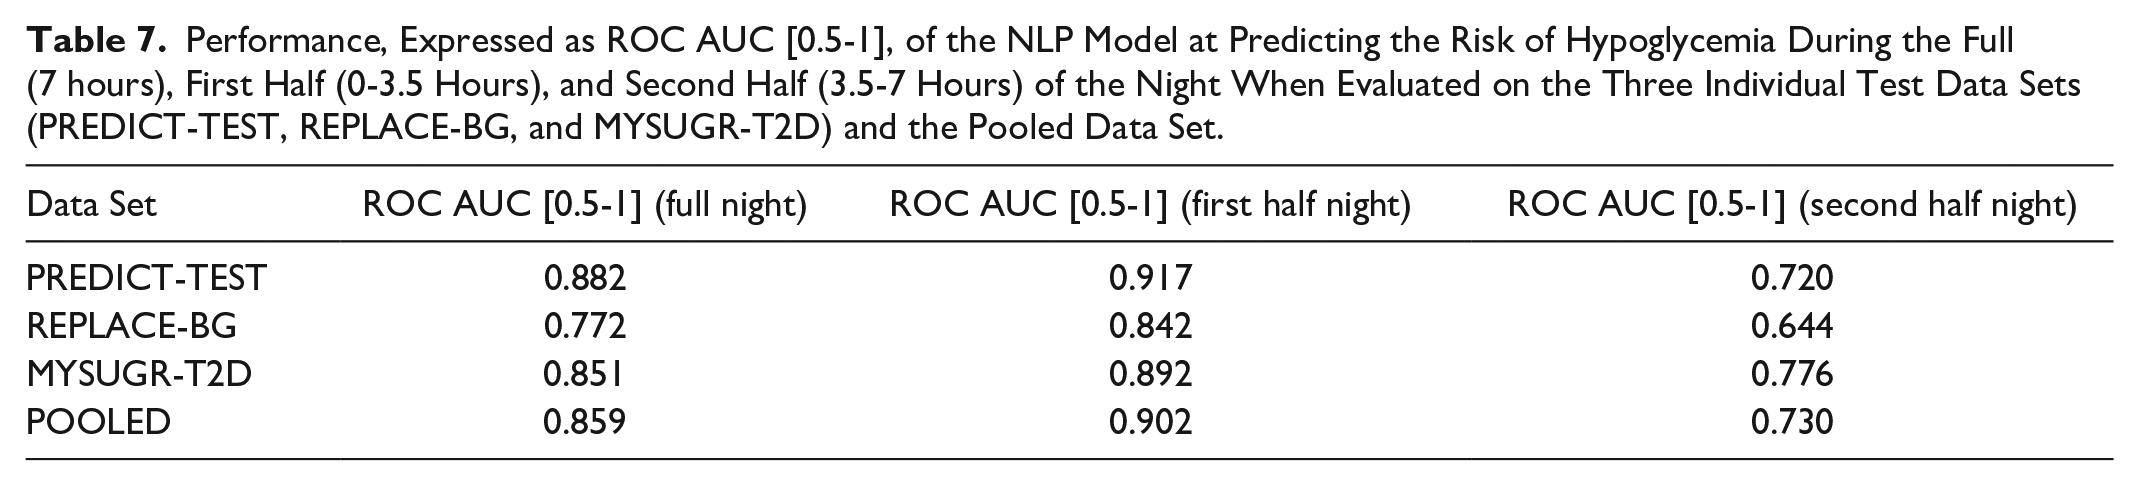
When examining the results for the REPLACE-BG data set, which is an interventional clinical trial data set for T1D, a slight decrease in performance compared with the PREDICT-TEST set is observed. It is worth noting that in REPLACE-BG, an older generation of the CGM sensor (Dexcom G4 Platinum, Dexcom Inc., San Diego, CA, USA) with higher signal noise, and two calibrations per day, was utilized.
In terms of prediction performance measured by ROC AUC on MYSUGR-T2D, it is close to that of the PREDICT-TEST data. However, for this specific data set, the sensitivity was lower and the specificity and accuracy were higher compared with the PREDICT-TEST data. These differences could be reduced by adjusting the classification threshold. The model exhibits significantly better performance during the first half of the night, as expected, since predicting the second half of the night poses a more challenging forecasting problem due to increased uncertainty. Finally, NLP significantly outperforms the baseline model when evaluated on the pooled data. It is important to note that to allow such comparison, the sensitivity of the NLP model and its baseline were aligned, hence the statistical test on this particular metric was not applied. For details on the rationale behind this decision, the reader is referred to Section D of the Supplementary Material.
Discussion
The ML models powering the three predictive functionalities within the Predict app underwent extensive testing using various clinical and real-world data sets, including data from individuals with T1D and T2D on MDI or insulin pump therapy. The results from such evaluation provide reassurance that the demonstrated performance should translate into valuable real-world usage of the Predict app, benefiting PwDs in their daily diabetes management. Such a real-world evaluation should be a focus of future research, offering further insights also on how the models perform collectively.
The performance evaluation of the proposed predictive glucose models demonstrates their superiority when compared with the selected baseline models. This showcases that the proposed ML models go beyond applying simple heuristics based on CGM information, such as glucose level and glucose trend.
A comparison of the three predictive models within the Predict app, against relevant studies from the scientific literature, suggests that the achieved performance is similar to the state-of-the-art. However, it is important to note that the experimental conditions in the selected studies may vary from those employed in this work.
It is worth noting that the Predict app does not explicitly gather contextual information regarding events among others such as physical activity, alcohol consumption, or illness, all of which are recognized as factors influencing glycemic control. Consequently, the performance of the predictive models may deviate from optimal outcomes under certain circumstances. Additionally, it is essential to emphasize that the predictive models do not take into account future user actions that may affect glucose levels. For example, the models cannot anticipate the consumption of a meal in an hour. Therefore, it is crucial for users to be aware of this aspect in order to interpret the predictions accurately. Furthermore, predictions are generally less accurate at mealtime and immediately after it. This matches expectations, as postprandial curves can vary greatly, even if the reported meal sizes are similar. 63
The Predict app’s predictive functionalities are driven by ML models that have undergone training using population data. However, it is important to remark that these models generate personalized predictions by leveraging both current and historical individual data, spanning a period of up to 28 days, as inputs to the model.
The excessive occurrence of glucose notifications (or alerts) and glucose alarms is acknowledged to contribute to desensitization and overwhelm, leading to notification and alarm fatigue. 64
Unlike glucose threshold alarms that demand immediate attention, notifications provided by the Predict app informing of future adverse glucose events are expected to be less stressful for individuals. These notifications require a lesser degree of immediacy while allowing for superior glycemic control. 65 Furthermore, the Predict app offers users the ability to personalize some notification settings, including glucose threshold and timing, and provides the option to deactivate notifications if preferred. This empowers users with enhanced control over their notification preferences, allowing them to tailor their level of engagement. To further alleviate any potential burden, the LGP feature includes a notification freeze of 30 minutes where no further notification is being triggered. Users can also make informed decisions and take preventive actions based on the two-hour prediction provided by the GP feature, thereby potentially mitigating the frequency of notifications. In addition, users can receive notifications by the NLP feature, allowing them to take proactive measures to minimize overnight alarms. This not only helps in avoiding disruptive overnight alarms but also aids in promoting uninterrupted sleep and overall well-being. 7
Finally, while clinical trials are needed to provide evidence on the medical value of the Predict app, previous research indicates that it is likely that PwDs appreciate the opportunity to avoid unfavorable glucose excursions in a timely manner, rather than having to respond to traditional glucose threshold alarms. 49
Supplemental Material
sj-docx-1-dst-10.1177_19322968241267818 – Supplemental material for Enhancing the Capabilities of Continuous Glucose Monitoring With a Predictive App
Supplemental material, sj-docx-1-dst-10.1177_19322968241267818 for Enhancing the Capabilities of Continuous Glucose Monitoring With a Predictive App by Pau Herrero, Magí Andorrà, Nils Babion, Dipl Ing, Hendericus Bos, Dipl Ing, Matthias Koehler, Dipl Ing, Yannick Klopfenstein, Eemeli Leppäaho, Patrick Lustenberger, Ajandek Peak, Christian Ringemann and Timor Glatzer in Journal of Diabetes Science and Technology
Footnotes
Acknowledgements
Dr Daniel Militz, Dr Bernd Schneidinger, and Sergio Moreiras for their helpful comments; Dr Michael Mitter for reviewing the manuscript; Andres Felipe Salazar Barrera and Leandro de Oliveira for the help with the figures; and several other colleagues are fully acknowledged. The authors are grateful to Dr Guido Freckmann, Professor Lutz Heinemann, Professor Bernhard Kulzer, Professor Oliver Schnell, and Dr Ralph Ziegler for giving advice in the course of writing the manuscript. The authors thank Dr Daniel Militz, Dr Sandra Moceri, and Christine Zepezauer for the careful review of the manuscript. The authors thank all the researchers and participants of the PREDICT and REPLACE-BG studies for their valuable time and commitment. The authors also thank the mySugr app users for consenting to use their data for research purposes.
Abbreviations
AID, automated insulin delivery; CGM, continuous glucose monitoring; PwDs, people with diabetes; HCPs, health care professionals; T1D, type 1 diabetes; T2D, type 2 diabetes; MDI, multiple daily injections; ROC AUC, area under the receiver operating characteristic curve; GP, Glucose Predict; LGP, Low Glucose Predict; NLP, Night Low Predict; CEG, Consensus Error Grid; RMSE, root mean squared error; MARD, mean absolute relative difference; AI, artificial intelligence; ML, machine learning.
Declaration of Conflicting Interests
The author(s) declared the following potential conflicts of interest with respect to the research, authorship, and/or publication of this article: PH, MA, NB, MK, CR, and TG are employees of Roche Diabetes Care. HB, YK, EL, PL, and AP are employees of IBM. PH, MA, NB, HB, MK, CR, TG, YK, EL, PL, and AP are stockholders of Roche Holding AG.
Funding
The author(s) disclosed receipt of the following financial support for the research, authorship, and/or publication of this article: The research was funded by Roche Diabetes Care.
Data Availability
The source of the REPLACE-BG data set (NCT02258373) is Jaeb Center of Health Research. Title of data set: REPLACE-BG: A Randomized Trial Comparing Continuous Glucose Monitoring with and Without Routine Blood Glucose Monitoring in Adults with Type 1 Diabetes. Retrieved from ![]() . The analyses, content, and conclusions presented herein are solely the responsibility of the authors and have not been reviewed or approved by Jaeb Center of Health Research.
. The analyses, content, and conclusions presented herein are solely the responsibility of the authors and have not been reviewed or approved by Jaeb Center of Health Research.
Supplemental Material
Supplemental material for this article is available online.
References
Supplementary Material
Please find the following supplemental material available below.
For Open Access articles published under a Creative Commons License, all supplemental material carries the same license as the article it is associated with.
For non-Open Access articles published, all supplemental material carries a non-exclusive license, and permission requests for re-use of supplemental material or any part of supplemental material shall be sent directly to the copyright owner as specified in the copyright notice associated with the article.