
Abstract

Keywords
Glycemia risk index (GRI) was introduced in a 2022 article in Journal of Diabetes Science and Technology (JDST), with David Klonoff, MD as the principal author. Although the GRI algorithm strongly correlates to risk assessment as determined by a cohort of highly experienced diabetes clinicians, GRI as an additional metric to assess glycemic control has gained little traction within the diabetes care community, despite its potential to provide insight beyond glycated hemoglobin (A1c) and time in range (TIR).
We hypothesize that the main obstacle to broader adoption of GRI and other useful metrics, and of the technology (e.g. continuous glucose monitors (CGMs)) that provides the data for those metrics, is the lack of practical, daily provider access to glucose data. Specifically, there is lacking a solution that can automate the current manual gathering, integration, assessment, and triage of data from all available CGMs and insulin delivery devices on a single, simple dashboard that includes relevant metrics such as GRI.
In our practice at diabetes and endocrinology specialists (DES) in St. Louis, Missouri, we have been using such a solution for over a year, a software service called SweetSpot. To our knowledge, it is unique in the industry, supporting all major devices and calculating GRI along with the usual ambulatory glucose profile (AGP) metrics.
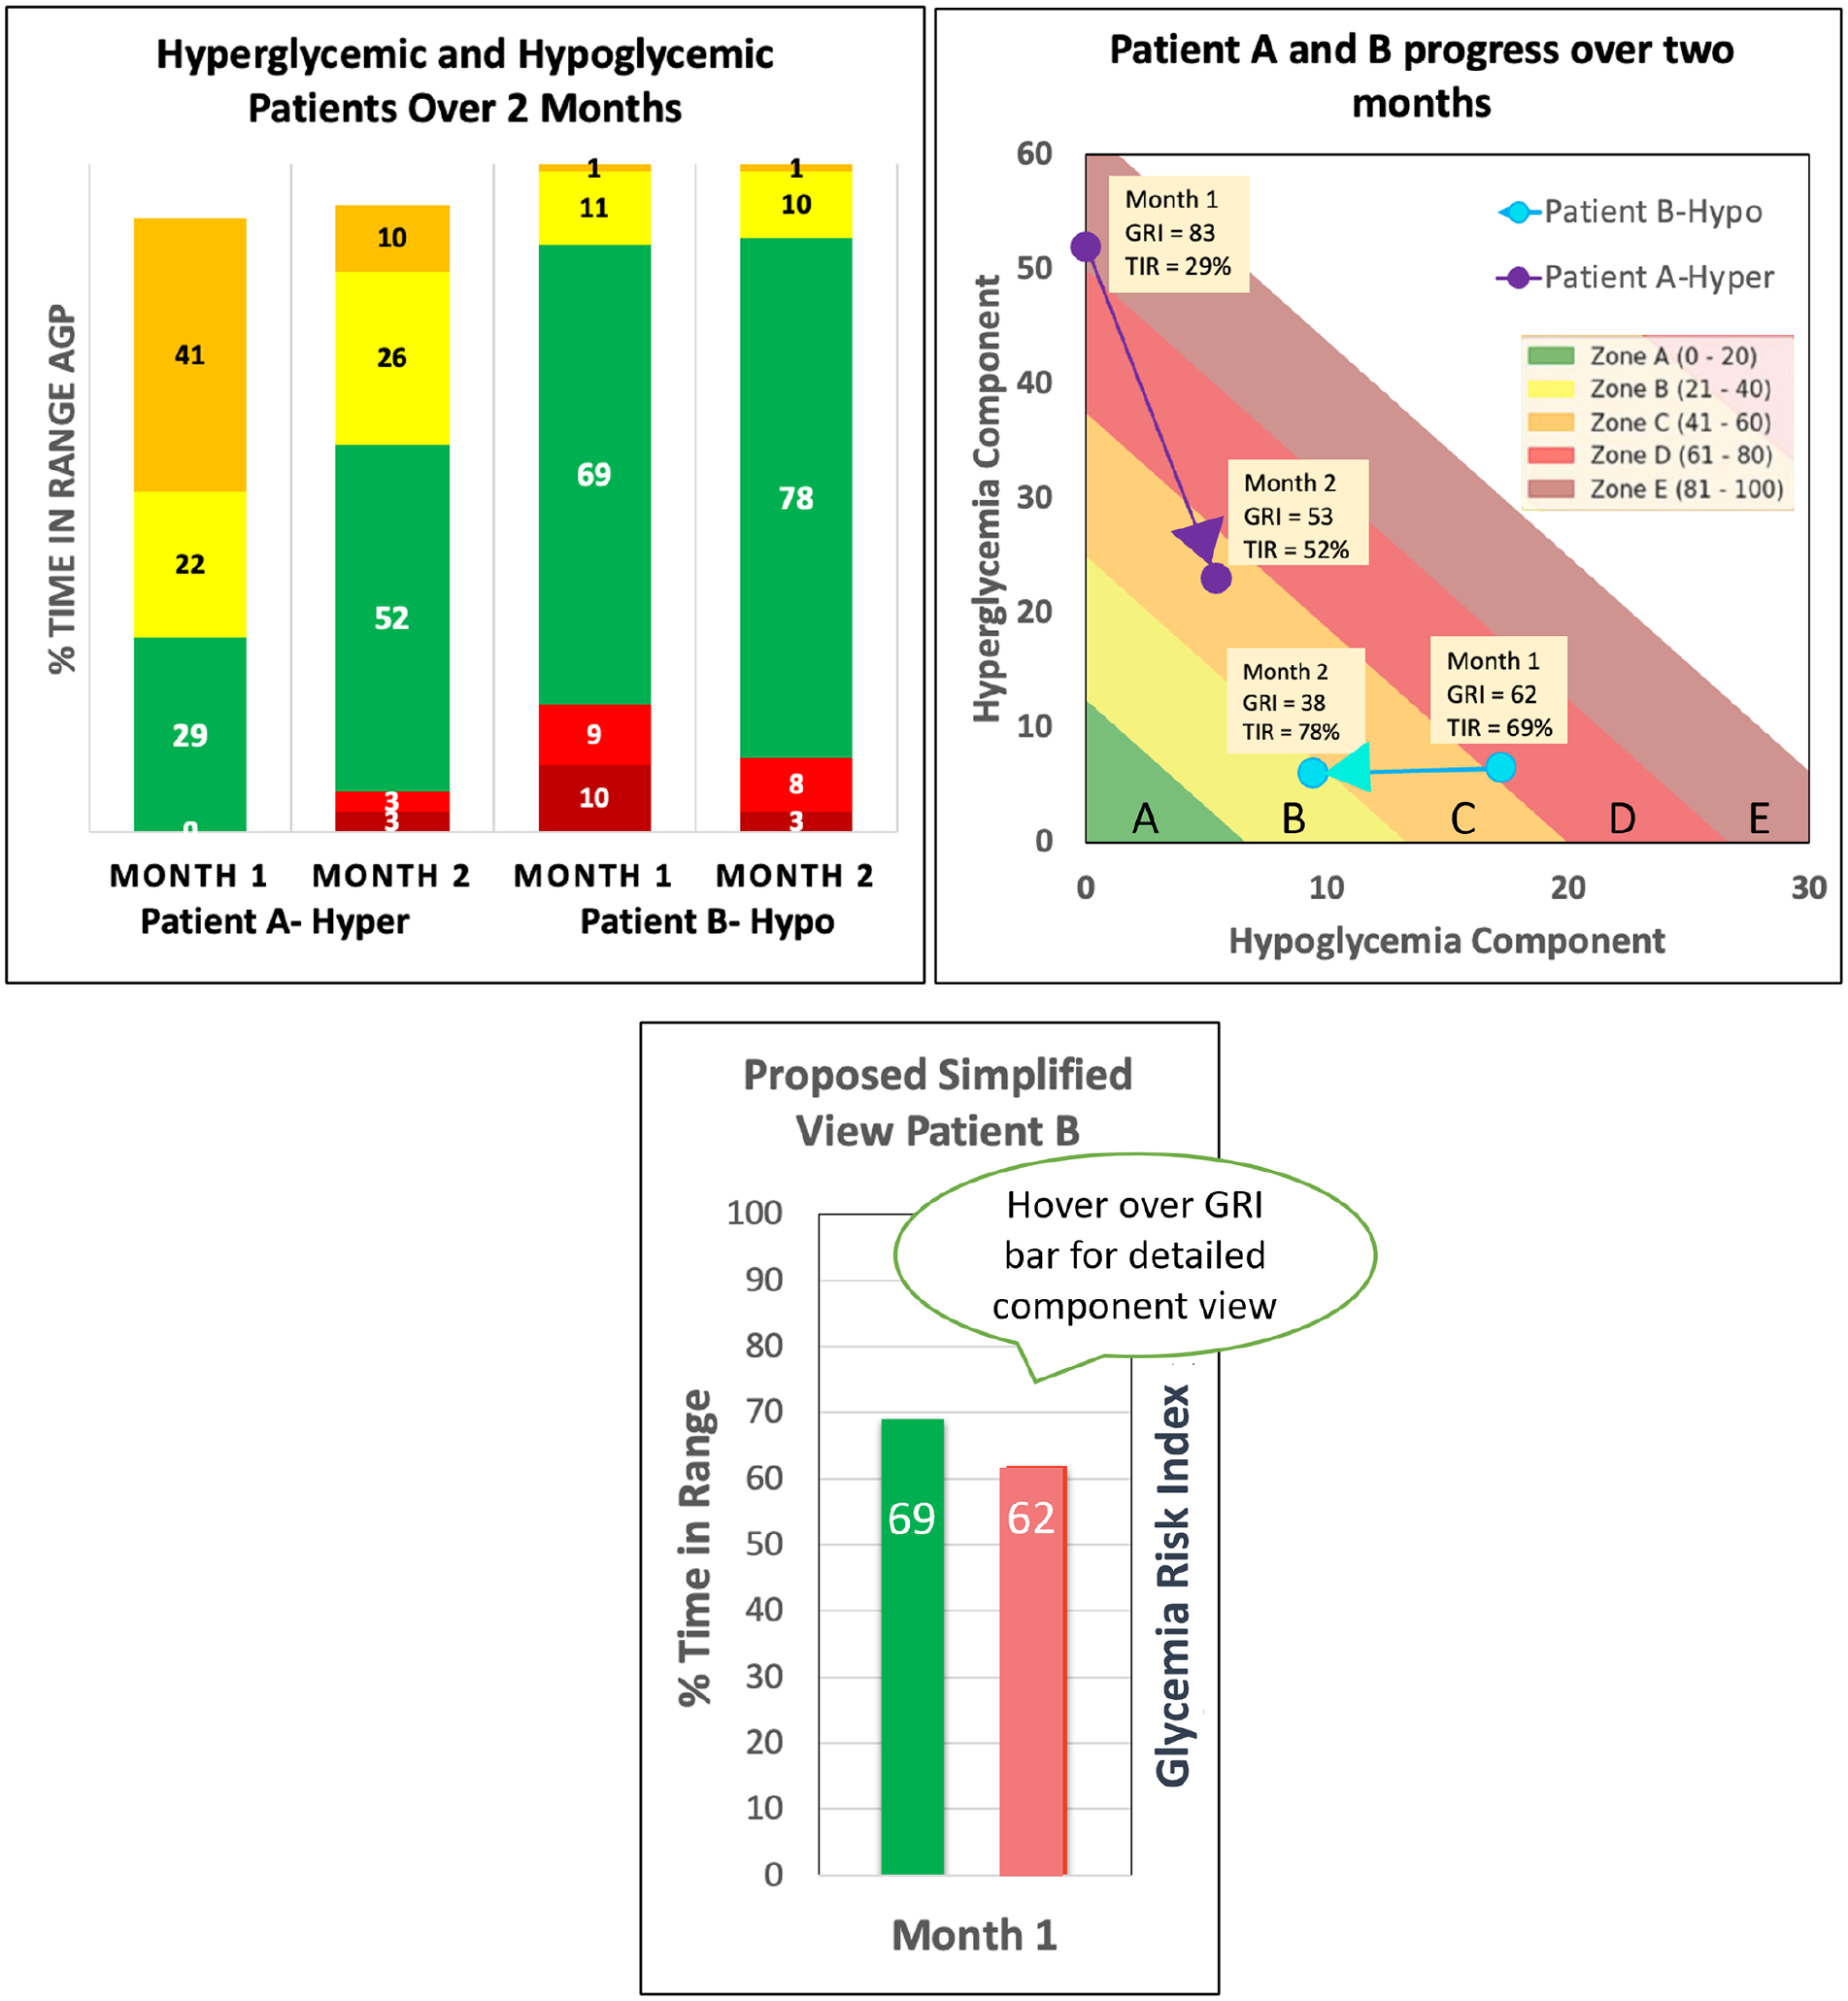
When reviewing the AGP report with patients, we traditionally started the conversation around TIR. However, it becomes quickly clear that two patients with a TIR on target at 70% may have completely different glycemic issues to address, depending upon whether the remaining 30% of time was spent, eg, in severe hyperglycemia in one case and hypoglycemia in the other case. We now start the conversation with GRI as a composite metric because we can quickly see that additional detail. Specifically, the GRI graphic is an intuitive visual indicating the direction of hypoglycemic and hyperglycemic components and is an ideal starting place to engage the patient. We can also triage patients on GRI to quickly prioritize those most in need of review and attention. We then complete the glucose assessment by turning to glucose management indicator (GMI) and glucose variability.
We propose adding GRI to the standard AGP report. It would enhance the conversation with patients—which used to be mostly about A1c and TIR—and enhance understanding of the seven AGP metrics, which today are reported to be “intimidating” to both patients and providers. In Figure 1, the traditional AGP TIR diagram (left panel) is augmented by the GRI visual representation (middle panel), along with a single GRI number comparing it to TIR (right panel). We believe this will help providers better engage with their patients, as we have experienced in our practice.
Diabetes technology has reduced the burden for patients, but for the providers, it has made access to the data impractical, increased workload and overhead, and contributed to provider burnout. The use of a centralized platform has helped alleviate these issues, and with GRI as a composite metric, we are able to provide more personalized, precision diabetes care while enhancing our position of expertise within our diabetes community.
Footnotes
Abbreviations
GRI, glycemia risk index; JDST, Journal of Diabetes Science and Technology; A1c, glycated hemoglobin; TIR, time in range; CGM, continuous glucose monitor; DES, diabetes and endocrinology specialists; AGP, ambulatory glucose profile; GMI, glucose management indicator.
Declaration of Conflicting Interests
The author(s) declared the following potential conflicts of interest with respect to the research, authorship, and/or publication of this article: RO and KB are the contractors at Aegis Digital Health and SVR is a full-time employee of Aegis Digital Health.
Funding
The author(s) received no financial support for the research, authorship, and/or publication of this article.