
Abstract
Background:
Continuous subcutaneous insulin infusion (CSII) is a common treatment option for people with diabetes (PWD), but insulin infusion failures pose a significant challenge, leading to hyperglycemia, diabetes burnout, and increased hospitalizations. Current CSII pumps’ occlusion alarm systems are limited in detecting infusion failures; therefore, a more effective detection method is needed.
Methods:
We conducted five preclinical animal studies to collect data on infusion failures, utilizing both insulin and non-insulin boluses. Data were captured using in-line pressure and flow rate sensors, with additional force data from CSII pumps’ onboard sensors in one study. A novel classifier model was developed using this dataset, aimed at detecting different types of infusion failures through direct utilization of force sensor data. Performance was compared against various occlusion alarm thresholds from commercially available CSII pumps.
Results:
The testing dataset included 251 boluses. The Bagging classifier model showed the highest performance metrics among the models tested, exhibiting high accuracy (96%), sensitivity (94%), and specificity (98%), with lower false-positive and false-negative rate compared with traditional occlusion alarm pressure thresholds.
Conclusions:
Our study developed a novel non-threshold classifier that outperforms current occlusion alarm systems in CSII pumps in detecting infusion failures. This advancement has the potential to reduce the risk of hyperglycemia and hospitalizations due to undetected infusion failures, offering a more reliable and effective CSII therapy for PWD. Further studies involving human participants are recommended to validate these findings and assess the classifier’s performance in a real-world setting.
Introduction
Despite the clinical benefits of continuous subcutaneous insulin infusion (CSII), insulin infusion failures remain a significant challenge and limitation for people with diabetes (PWD).1,2 Infusion failures are associated with reduced insulin delivery, prolonged hyperglycemia, and increased likelihoods of diabetes burnout and pump discontinuation.3-5 The primary causes of infusion failures include malfunctions of the disposable infusion set and reactions to either the subcutaneously inserted cannula or the insulin itself.6,7 Notably, infusion failures are the leading cause of hospitalizations for diabetes-related ketoacidosis (DKA) hospitalization among PWD who use CSII therapy, in some cases resulting in fatal outcomes.8,9
Current CSII pumps have limited capabilities to detect infusion failures. The majority of commercially available pumps have occlusion-only alarm systems, which rely on an onboard sensor and algorithm to alert a user when the pressure in the infusion line exceeds a programmed threshold.10-14 However, these detection thresholds are not standardized across manufacturers and cannot detect other types of infusion failures such as leakages, dislodged cannulas, and “silent” (ie, no alert) occlusions.15,16 Reliance on a single threshold places systems at risk for false-positive alarms if the threshold is too low (eg, when a large volume bolus is successfully delivered but exceeds the threshold) or false-negative alarms if the threshold is too high (eg, a leaking infusion set or when a small-volume bolus does not exceed the threshold but still fails to deliver into the subcutaneous space). Furthermore, occlusion alarms can take time to trigger depending on the pump’s infusion rate, with delays up to 40 hours post-failure. 17 Delayed detection can lead to substantial increases in glycemia in the setting of repeatedly failing correction boluses, causing confusion and concern for users when glucose levels remain persistently high.3,18
Algorithms designed to detect infusion failure using continuous glucose monitoring (CGM) and historical insulin infusion data have been developed but not implemented commercially.19-21 Yet, the efficacy of these systems is reliant on the accuracy and connectivity of external CGM sensors. These models also require an elevation of glucose levels over time, which may produce false alarms if hyperglycemia develops that is not related to an infusion failure. Alternatively, the testing of retrofitted pressure sensors in CSII pumps suggests that the incorporation of more precise fluid monitoring could improve the infusion failure detection. 15
To address the limitations of detecting infusion failures with existing occlusion alarm systems and CGM-based algorithms, which also lack the capability to characterize the nature of delivery failure, we developed a novel non-threshold-based binary machine learning classifier designed to detect dysfunctional versus functional infusions by directly using data from a CSII pump’s onboard force sensor. The aims of this research were:
To train and test a force-based classifier using an in vivo preclinical study dataset that includes infusion failures.
To compare the performance of the classifier retrospectively against various occlusion alarm thresholds used in commercially available CSII pumps.
Methods
Study Design
Between November 2020 and August 2023, a series of infusion site tests were performed across five individual studies. Data from these studies were aggregated and normalized to create a set of training and testing data to develop and test a model for detection of infusion malfunction.
Included Studies
Five preclinical studies were conducted (Table 1), using nine healthy swine without diabetes and three with streptozotocin-induced diabetes. 22 Each study received prior approval from either the Medical Education & Research Institute (MERI) or University of Tennessee Health Science Center (UTHSC) Institutional Animal Care and Use Committee (Memphis, Tennessee). Veterinary staff were onsite throughout all studies to oversee animal welfare.
Summary of Animal Experiments.
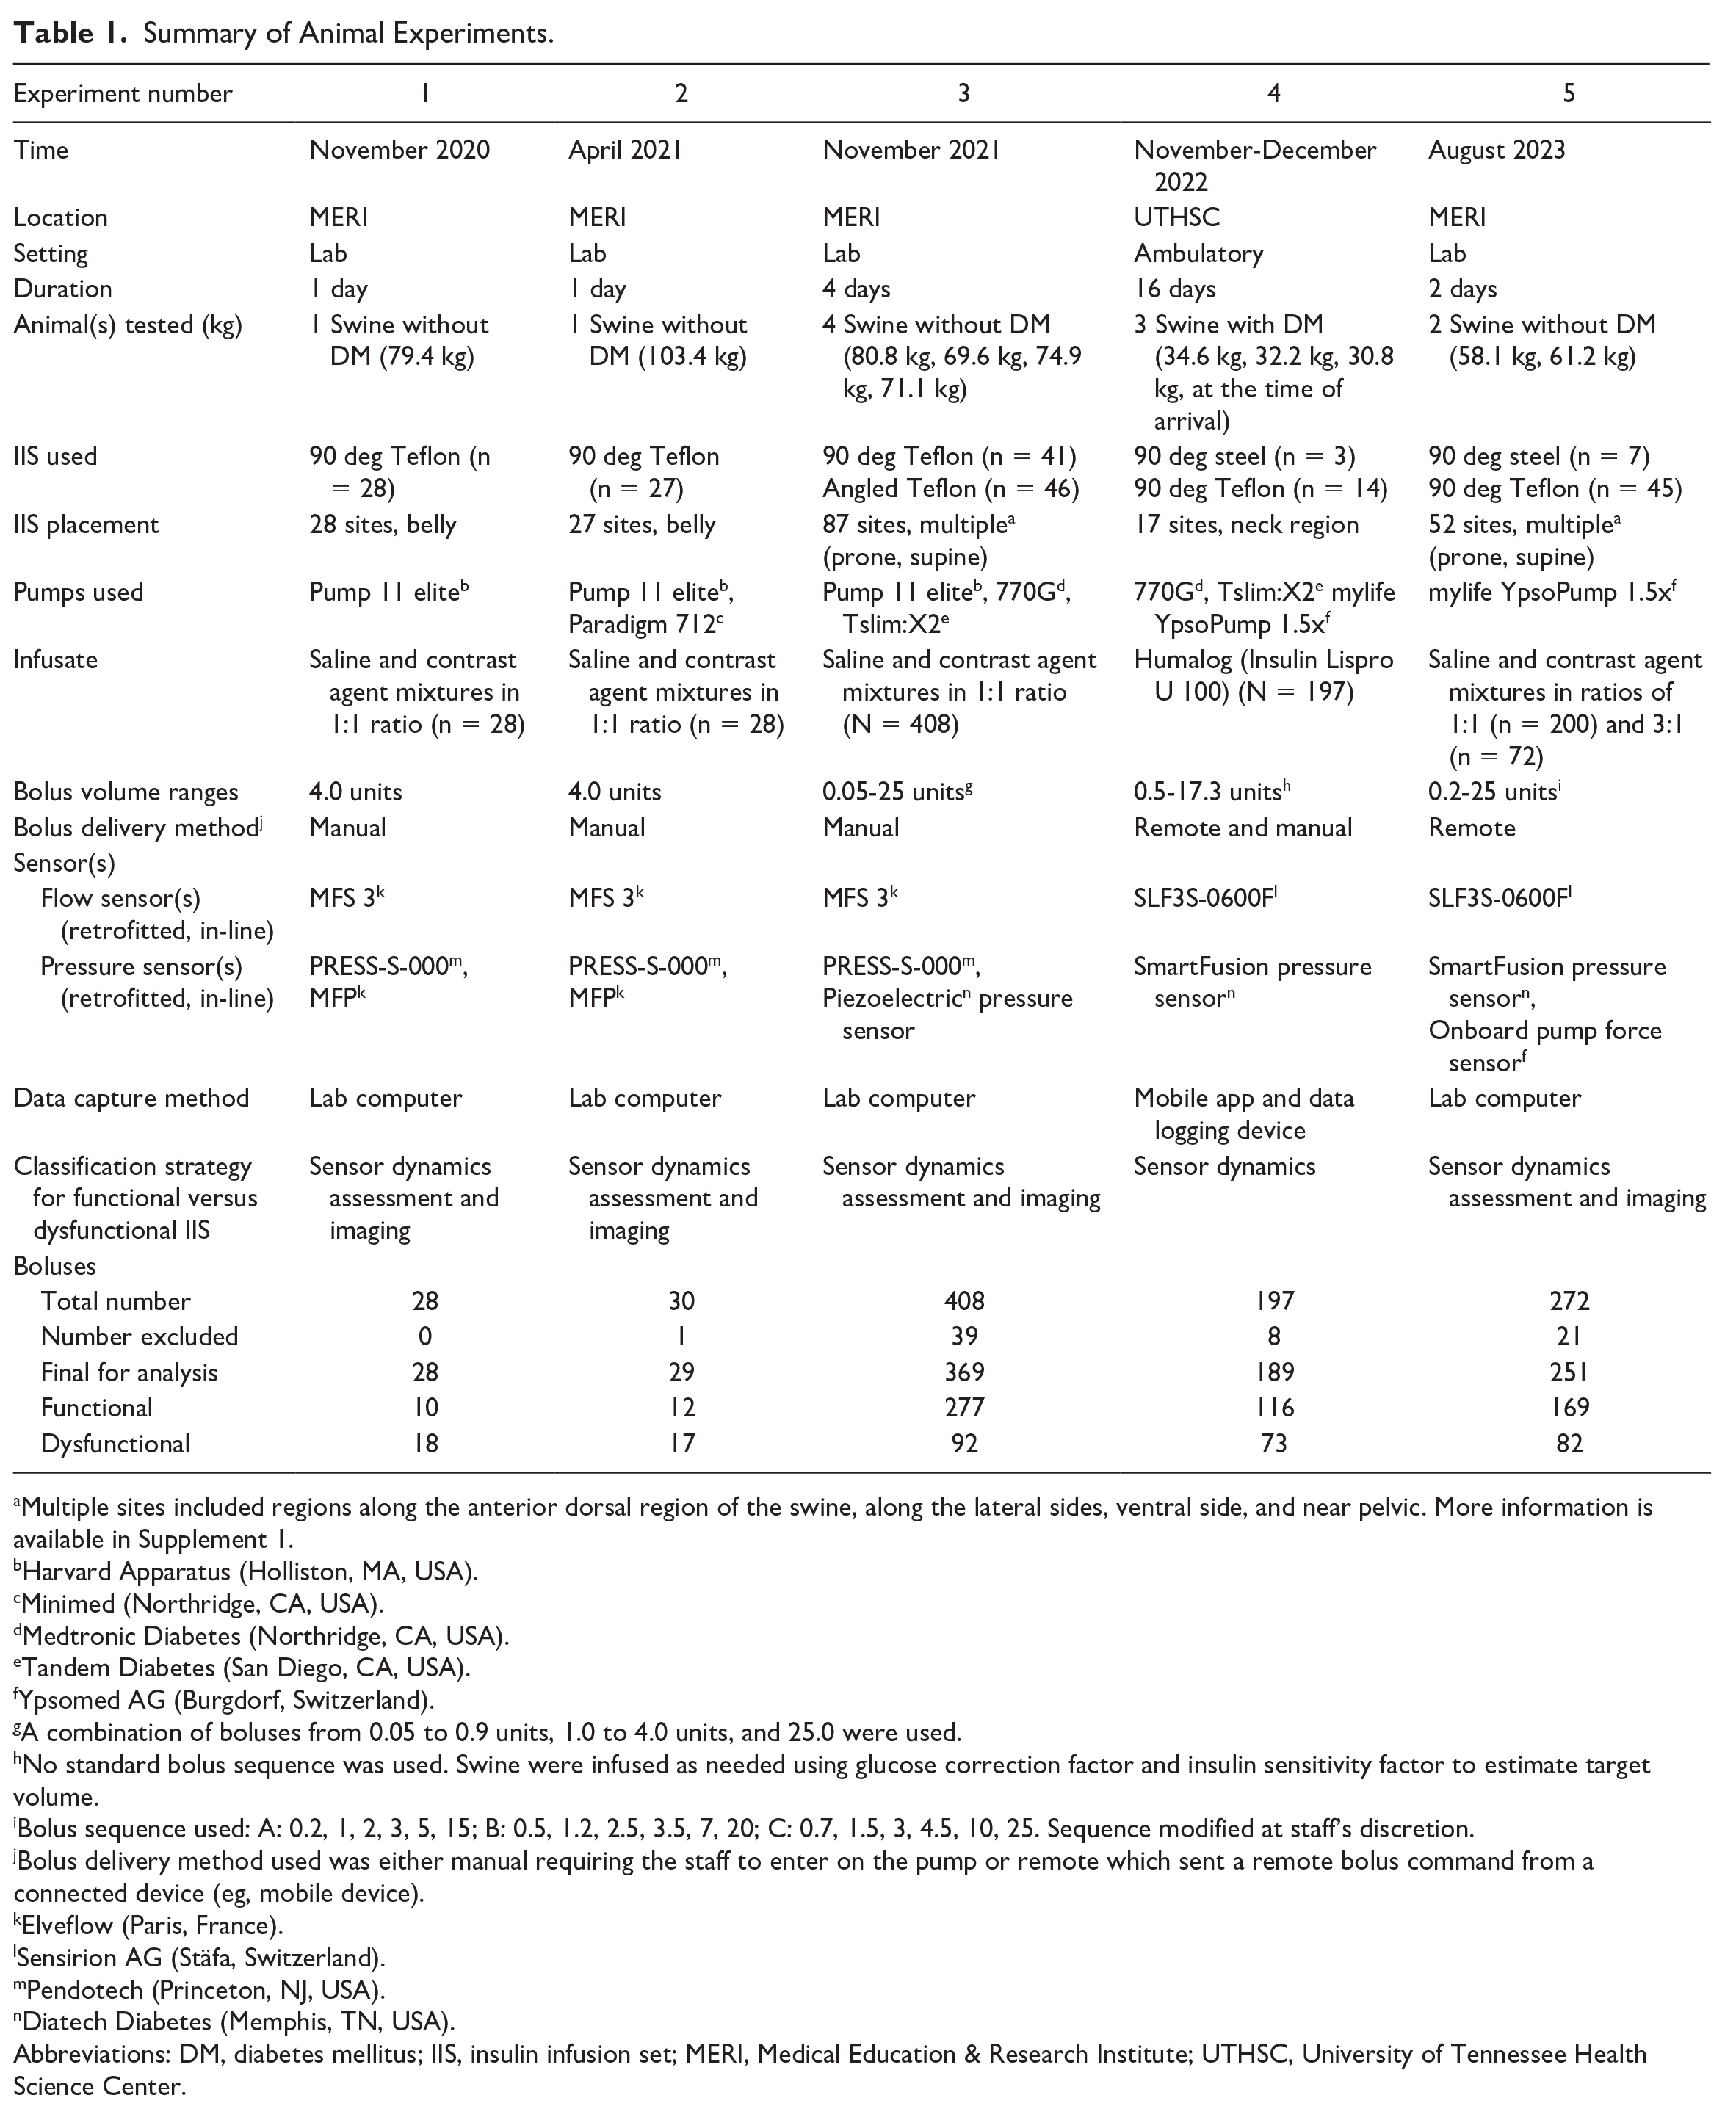
Multiple sites included regions along the anterior dorsal region of the swine, along the lateral sides, ventral side, and near pelvic. More information is available in Supplement 1.
Harvard Apparatus (Holliston, MA, USA).
Minimed (Northridge, CA, USA).
Medtronic Diabetes (Northridge, CA, USA).
Tandem Diabetes (San Diego, CA, USA).
Ypsomed AG (Burgdorf, Switzerland).
A combination of boluses from 0.05 to 0.9 units, 1.0 to 4.0 units, and 25.0 were used.
No standard bolus sequence was used. Swine were infused as needed using glucose correction factor and insulin sensitivity factor to estimate target volume.
Bolus sequence used: A: 0.2, 1, 2, 3, 5, 15; B: 0.5, 1.2, 2.5, 3.5, 7, 20; C: 0.7, 1.5, 3, 4.5, 10, 25. Sequence modified at staff’s discretion.
Bolus delivery method used was either manual requiring the staff to enter on the pump or remote which sent a remote bolus command from a connected device (eg, mobile device).
Elveflow (Paris, France).
Sensirion AG (Stäfa, Switzerland).
Pendotech (Princeton, NJ, USA).
Diatech Diabetes (Memphis, TN, USA).
Abbreviations: DM, diabetes mellitus; IIS, insulin infusion set; MERI, Medical Education & Research Institute; UTHSC, University of Tennessee Health Science Center.
In animal studies 1 to 3 and 5, swine were under general anesthesia and positioned prone or supine within an ARTIS pheno fluoroscopy unit (Siemens, Munich, Germany) for two-dimensional (2D) and three-dimensional (3D) imaging of infusion sites. Commercially available infusion sets were inserted into multiple body regions and were connected to a CSII pump (Figure 1).
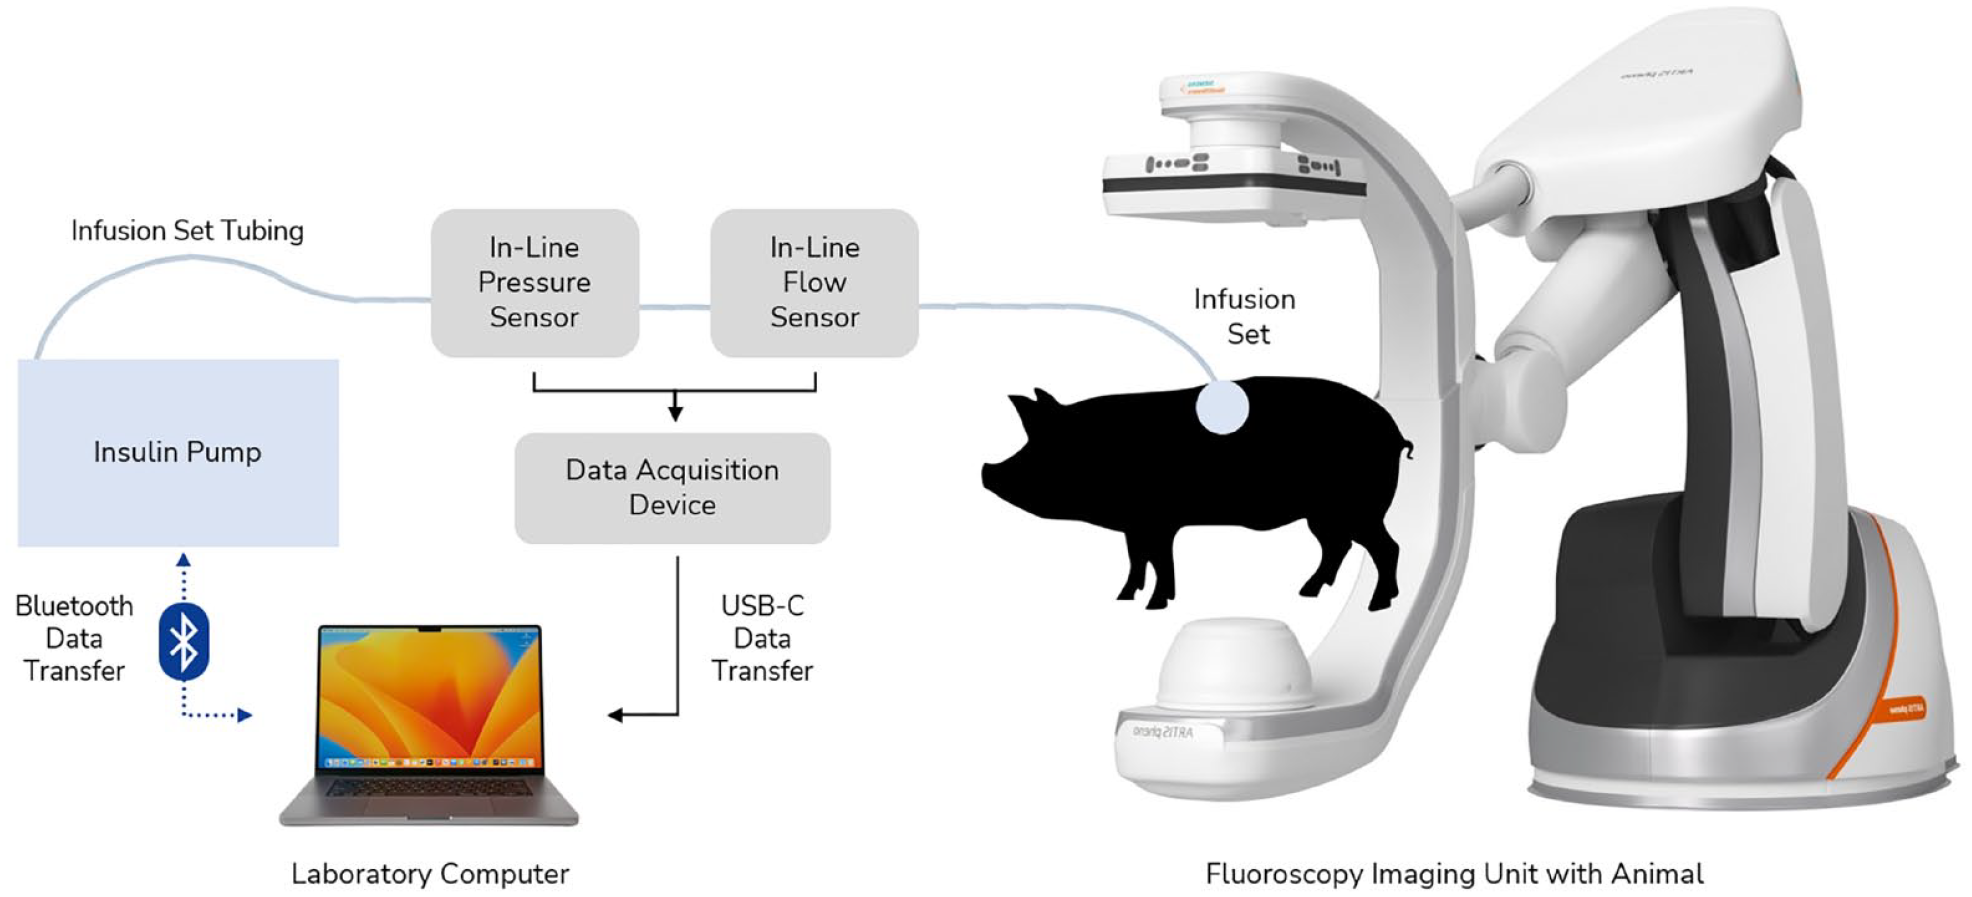
Experimental hardware setup with CSII pump, in-line sensors, infusion set, and fluoroscopy unit. Study design for studies 1 to 3 and 5. In-line sensors were placed approximately 6.3 cm from the proximal end of the infusion set tubing. The force sensor (not shown) is located within the pump hardware itself. Abbreviation: CSII, continuous subcutaneous insulin infusion.
In animal study 4, ambulatory swine were cared for during a 16-day period. Swine were fitted with commercially available CSII pumps using U-100 insulin. Blood glucose was monitored via Dexcom G6 CGM sensors and AlphaTRAK 2 meters. Swine were fed two to three times daily following a pre-meal BG check. Infusion sets and CGM sensors were inserted around the neck region with manual BG checks performed via ear pricks (Figure 2).
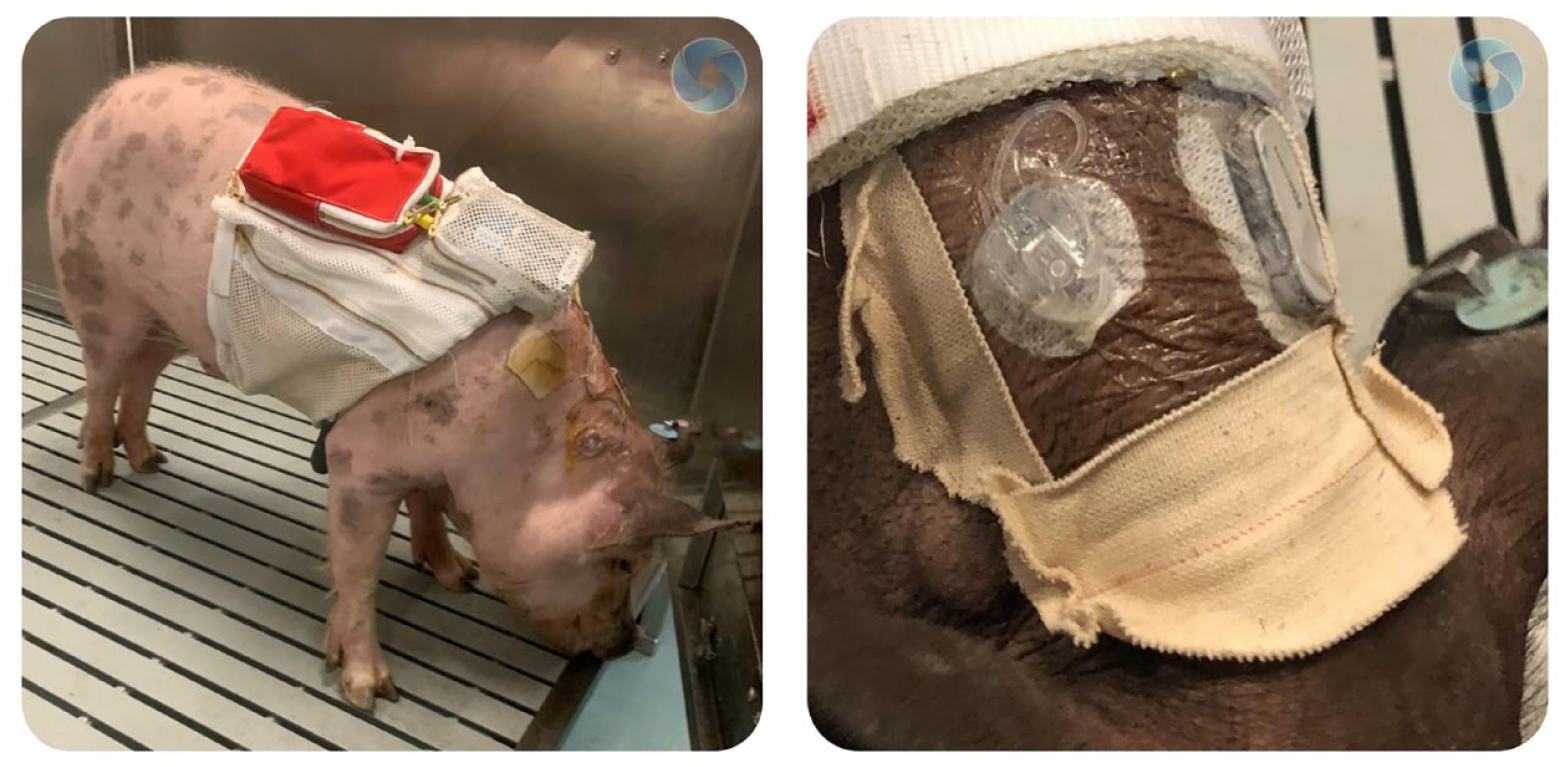
Experimental hardware setup with CSII pump, in-line sensors, infusion set, and data acquisition device placed on swine using a specialty vest. Study design for studies 4. Tegaderm and tape are used to help prevent the infusion set and CGM from being removed by swine. Abbreviation: CSII, continuous subcutaneous insulin infusion.
Across the five different studies, boluses were performed using saline and contrast mixture for swine without diabetes, or insulin for those with streptozotocin-induced diabetes. Infusion data was captured using a combination of off-the-shelf and custom in-line pressure and flow rate sensors retrofitted onto infusion sets. Retrofitted in-line sensors were connected to either a proprietary data acquisition device (DAC) (studies 4 and 5) or commercially available DAC (studies 1-3) which transferred data via USB to a laboratory computer. The force exerted during each bolus infusion was also measured directly by the pump’s onboard sensor and transmitted to the laboratory computer via Bluetooth connection during study 5. Images of the infusion site were taken by 2D and 3D fluoroscopy and were later evaluated using 3D Slicer in animal studies 1 to 3 and 5. 23 Finally, the study pump’s occlusion threshold is 13 000 mN, but for study 5, it was changed to 20 000 mN to evaluate performance at higher forces.
In animal studies 1 to 3 and 5, a new infusion set was inserted at a new site after a preplanned series of boluses was completed. In animal study 4, a new infusion set was placed at the researcher’s discretion, after 2 days of wear, or if the CSII pump occlusion alarm was triggered repeatedly. For all studies, new infusion sets were placed ≥4 cm from the prior. After completion of each study, swine were humanely euthanized by veterinary staff.
Definition of Functional and Dysfunctional Boluses
All study boluses were analyzed simultaneously by two trained individuals and manually assigned a binary label: “Functional” or “Dysfunctional.” Labeling was based on analysis of the fluid dynamics data from the pump for each infusion, including flow rate, pressure, and force (Supplement 2). Volume delivered was estimated by integrating flow rate over time and a 70% volume delivery threshold (%VD = [volume delivered ÷ volume intended] × 100%) was used as a cutoff to distinguish “Functional” from “Dysfunctional” boluses. Labels were overwritten by trained staff in the event that estimated volume delivered was skewed due to a large release (eg, flow rate during infusion was minimal but flow path was cleared triggering a large flow rate) or fluoroscopic imaging identified fluid leaking from the infusion set. Overwriting of %VD occurred in six instances in the testing set. Site leakage was not separately identified or quantified.
Dataset Overview and Preprocessing
Data from 866 boluses were obtained from all studies using pressure and force sensors. A total of 615 (71%) boluses (studies 1-4) were used as the training set and only contained pressure data. A total of 251 (29%) boluses (study 5) were used for the testing set and had data from both the study pump’s onboard force sensor and the in-line pressure sensor.
To achieve a unified force only dataset, we developed a pressure-to-force scaling function. This was done by using the raw pressure and force data from study 5, synchronizing the time series data, and fitting a model on the time-shifted dataset. The output of this preprocessing step was a third-order polynomial function that we could use to transform the training set’s pressure data to force (Supplement 3).
Model Development
A systematic test harness was established in Python for model training and evaluation that involved base model testing, feature elimination, hyperparameter tuning, and final validation. For model training and final validation, features were scaled using standardization with a mean of 0 and standard deviation of 1. A 70/30 train test split was used for any step requiring data partitioning. During training, model performance was evaluated using 10-fold, 3-repeats stratified k-fold cross-validation and F2-score (ie, instead of F1-score) as it penalizes false negatives.24,25
Base Model Assessment
For base model testing, we explored logistic regression (LR), support vector machine (SVM), random forest (RF), linear discriminant analysis (LDA), Gaussian Naive-Bayes (GNB), Gaussian process classifier (GPC), Bagging Classifier with Decision Tree Classifier as base estimator (BAG), and gradient boosting classifier (GBM).24-28 These models were assessed using cross-validation on 211 features created using expert domain knowledge derived solely from estimated force values. Logistic regression, SVM, RF, BAG, and GBM showed similar performance with Recall > 0.86, Precision > 0.80, and F2-score > 0.86 so LDA, GNB, and GPC were not considered for further testing (Figure 3, Table 2).
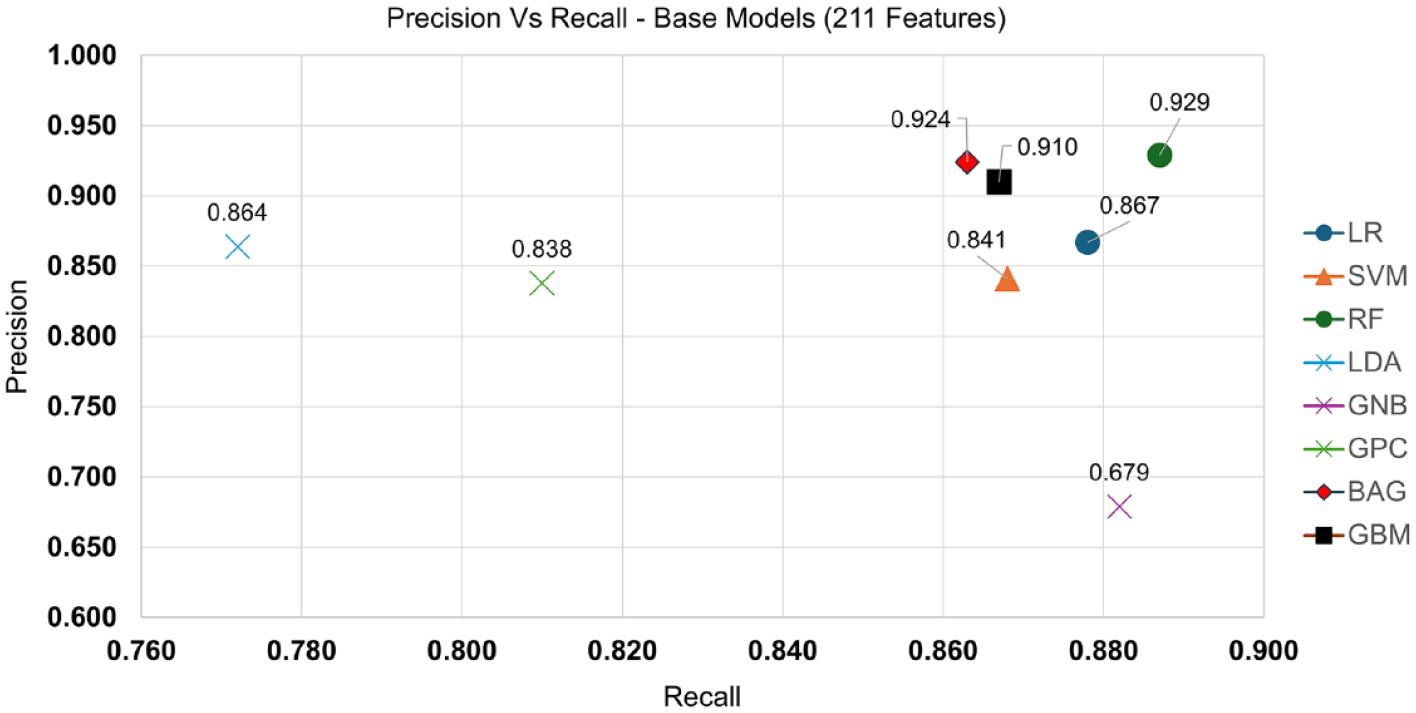
Precision versus Recall graphed for each base model. Here, we see that LDA, GNB, and GPC are not clustered with the other 5 models (Recall > 0.86, Precision > 0.80) and can be eliminated going forward. Abbreviations: LR, logistic regression; SVM, support vector machine; RF, random forest; LDA, linear discriminant analysis; GNB, Gaussian Naive-Bayes; GPC, Gaussian process classifier; BAG, Bagging classifier; GBM, gradient boosting classifier.
Summary of Model Performance During Base Model Selection Process on All Features and Initially Reduced Feature Set.
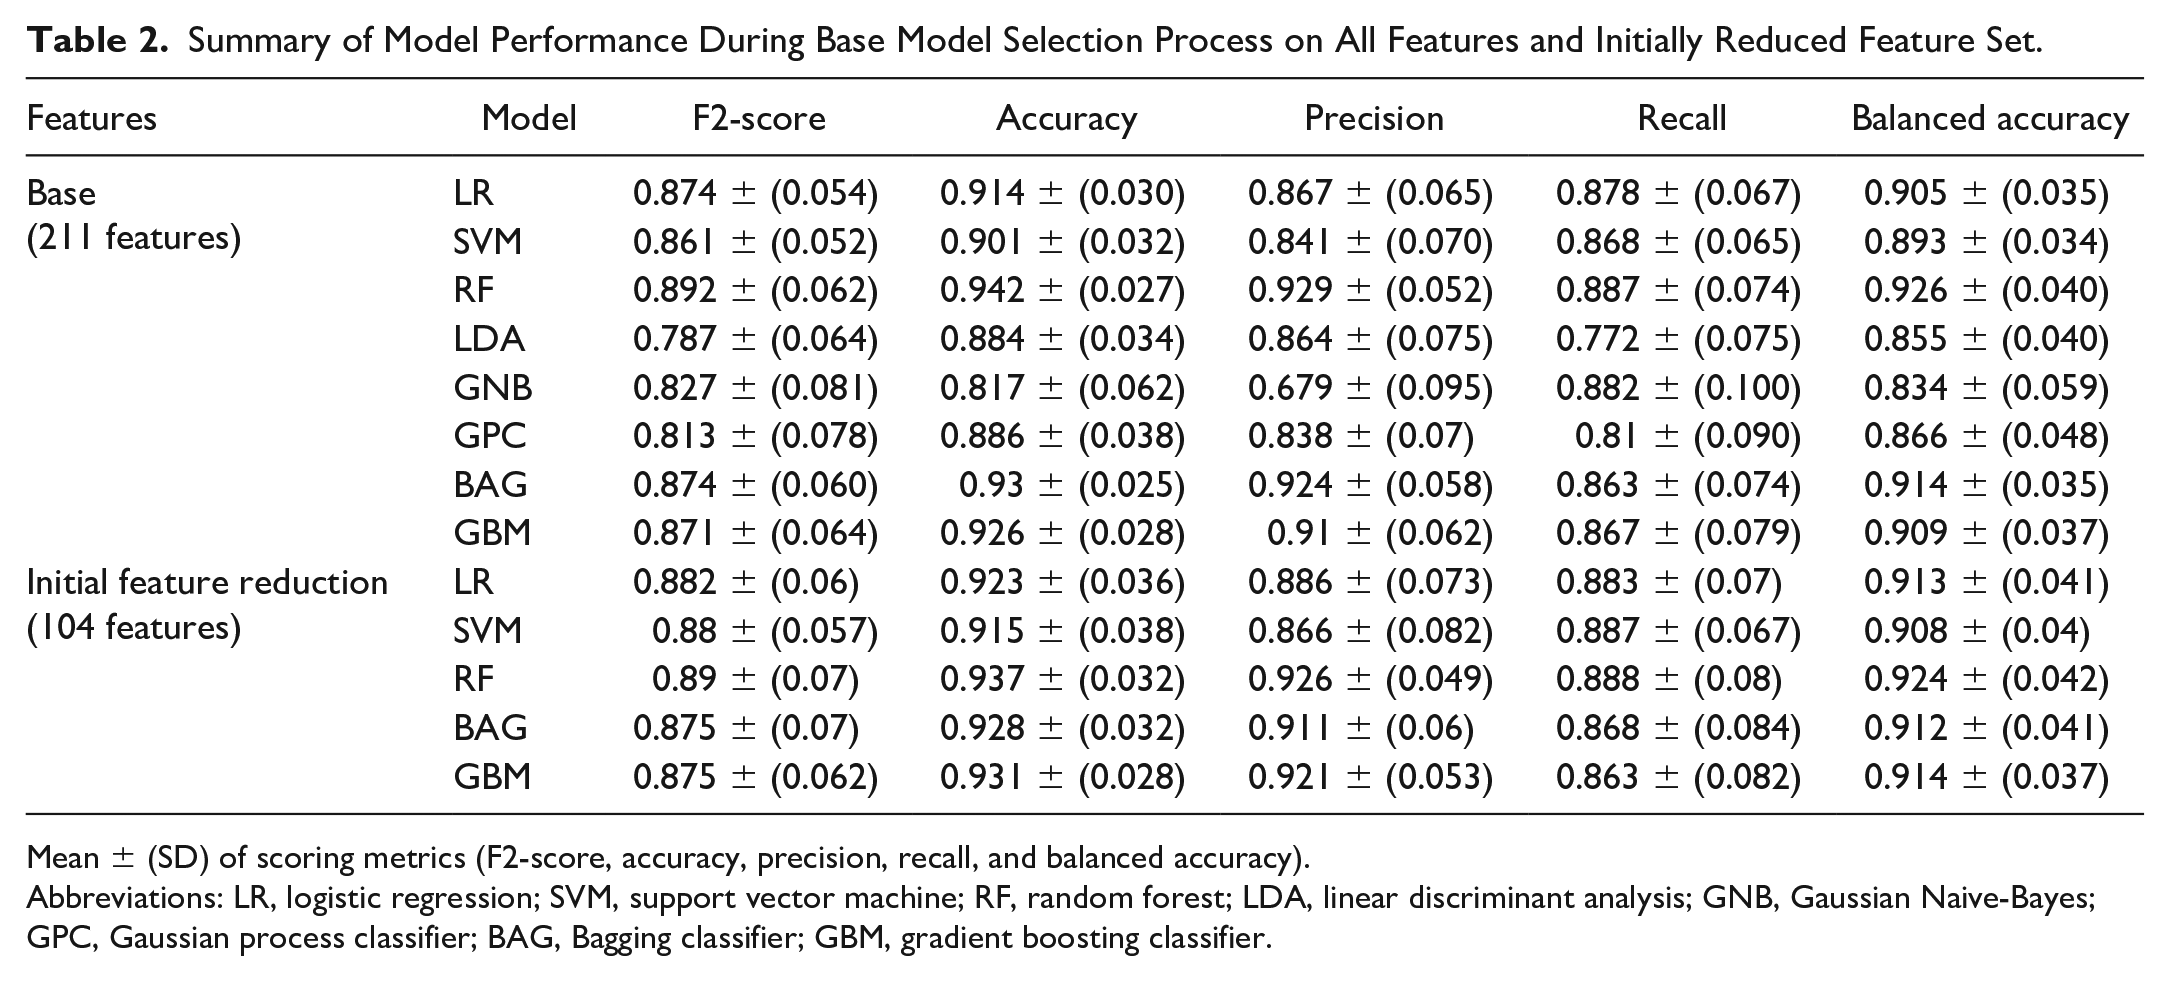
Mean ± (SD) of scoring metrics (F2-score, accuracy, precision, recall, and balanced accuracy).
Abbreviations: LR, logistic regression; SVM, support vector machine; RF, random forest; LDA, linear discriminant analysis; GNB, Gaussian Naive-Bayes; GPC, Gaussian process classifier; BAG, Bagging classifier; GBM, gradient boosting classifier.
Feature Elimination/Reduction
Feature elimination was performed in two steps. First, continuous features (eg, max force) were assessed by analysis of variance (ANOVA) and categorical features (eg, final force > initial force) were assessed by a chi-square test. Using a 99.5% confidence interval (P < .005), 104 features were identified to be statistically significant. Recursive feature elimination (RFE) was subsequently performed across five base models (LR, SVM, RF, BAG, and GBM) using a LR estimator on a feature space of size 2 to 104. 24 The optimal feature subset per model was identified using cross-validation with the F2-score as the scoring criterion.
The identified optimal subsets included 33, 27, 98, 44, and 29 features for LR, SVM, RF, BAG, and GBM, respectively, achieving F2-scores of 0.930, 0.923, 0.940, 0.934, and 0.932 (Figure 4).
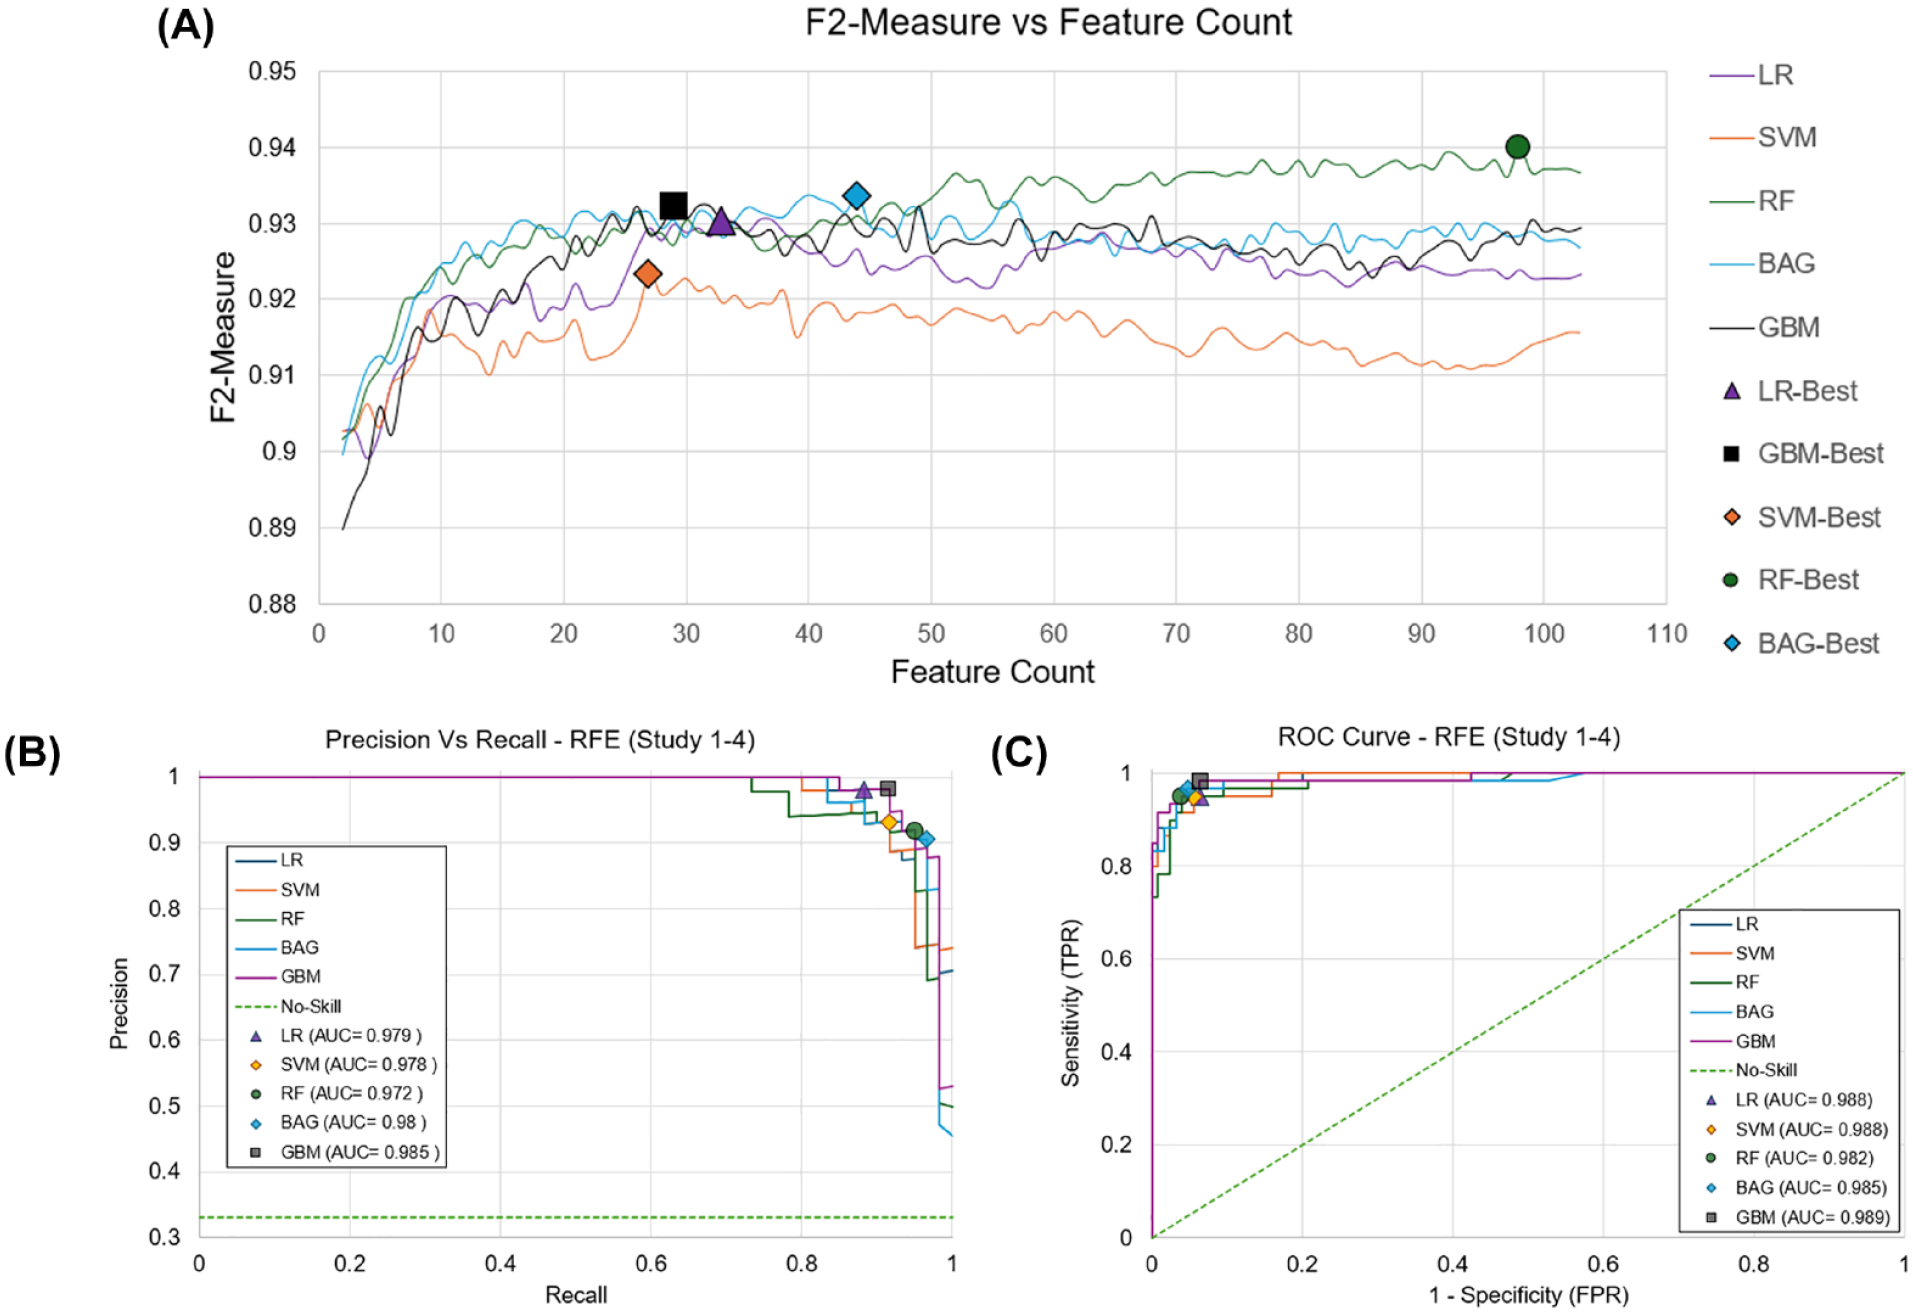
(A) RFE curves for 5 base models. The number of features required to achieve the highest F2-Score is denoted by a marker. Best performance was achieved at 33 (0.93) for LR, 27 (0.92) for SVM, 98 (0.94) for RF, 44 (0.934) for BAG, and 29 (0.932) for GBM identified with the marker. ROC and PR curves are also shown for best performance after RFE. (B) PR AUC highlights minimal difference between models, 0.013 difference between best (GBM) and worst model (RF). (C) ROC AUC also shows a 0.006 difference between best (GBM) and worst model (RF). Abbreviations: AUC, area under the curve; BAG, Bagging classifier; GBM, gradient boosting classifier; LR, logistic regression; PR, precision and recall; RF, random forest; RFE, recursive feature elimination; ROC, receiver operating characteristic curve; SVM, support vector machine; TNR, true negative rate; TPR, true positive rate.
Tuning Hyperparameters
The Scikit-learn module in Python was used to implement the proposed classification models. 29 Hyperparameter tuning was performed for each model individually using RandomizedSearchCV, a common technique for exploring model parameters from a specified distribution using a partitioned training set and cross-validation. 29 Synthetic Minority Oversampling Technique (SMOTE) was used to increase the minority class in the training set which helps mitigate overfitting on the majority class (“Functional”). 26 Anticipating the computational burden of using too many features for the model, we opted to use 18, 27, 29, and 33 as the target max feature set during final tuning. During tuning, all models showcased strong PR-AUC and ROC-AUC which speaks to the model’s robustness and ability to generalize past the training set (Figure 5). 24
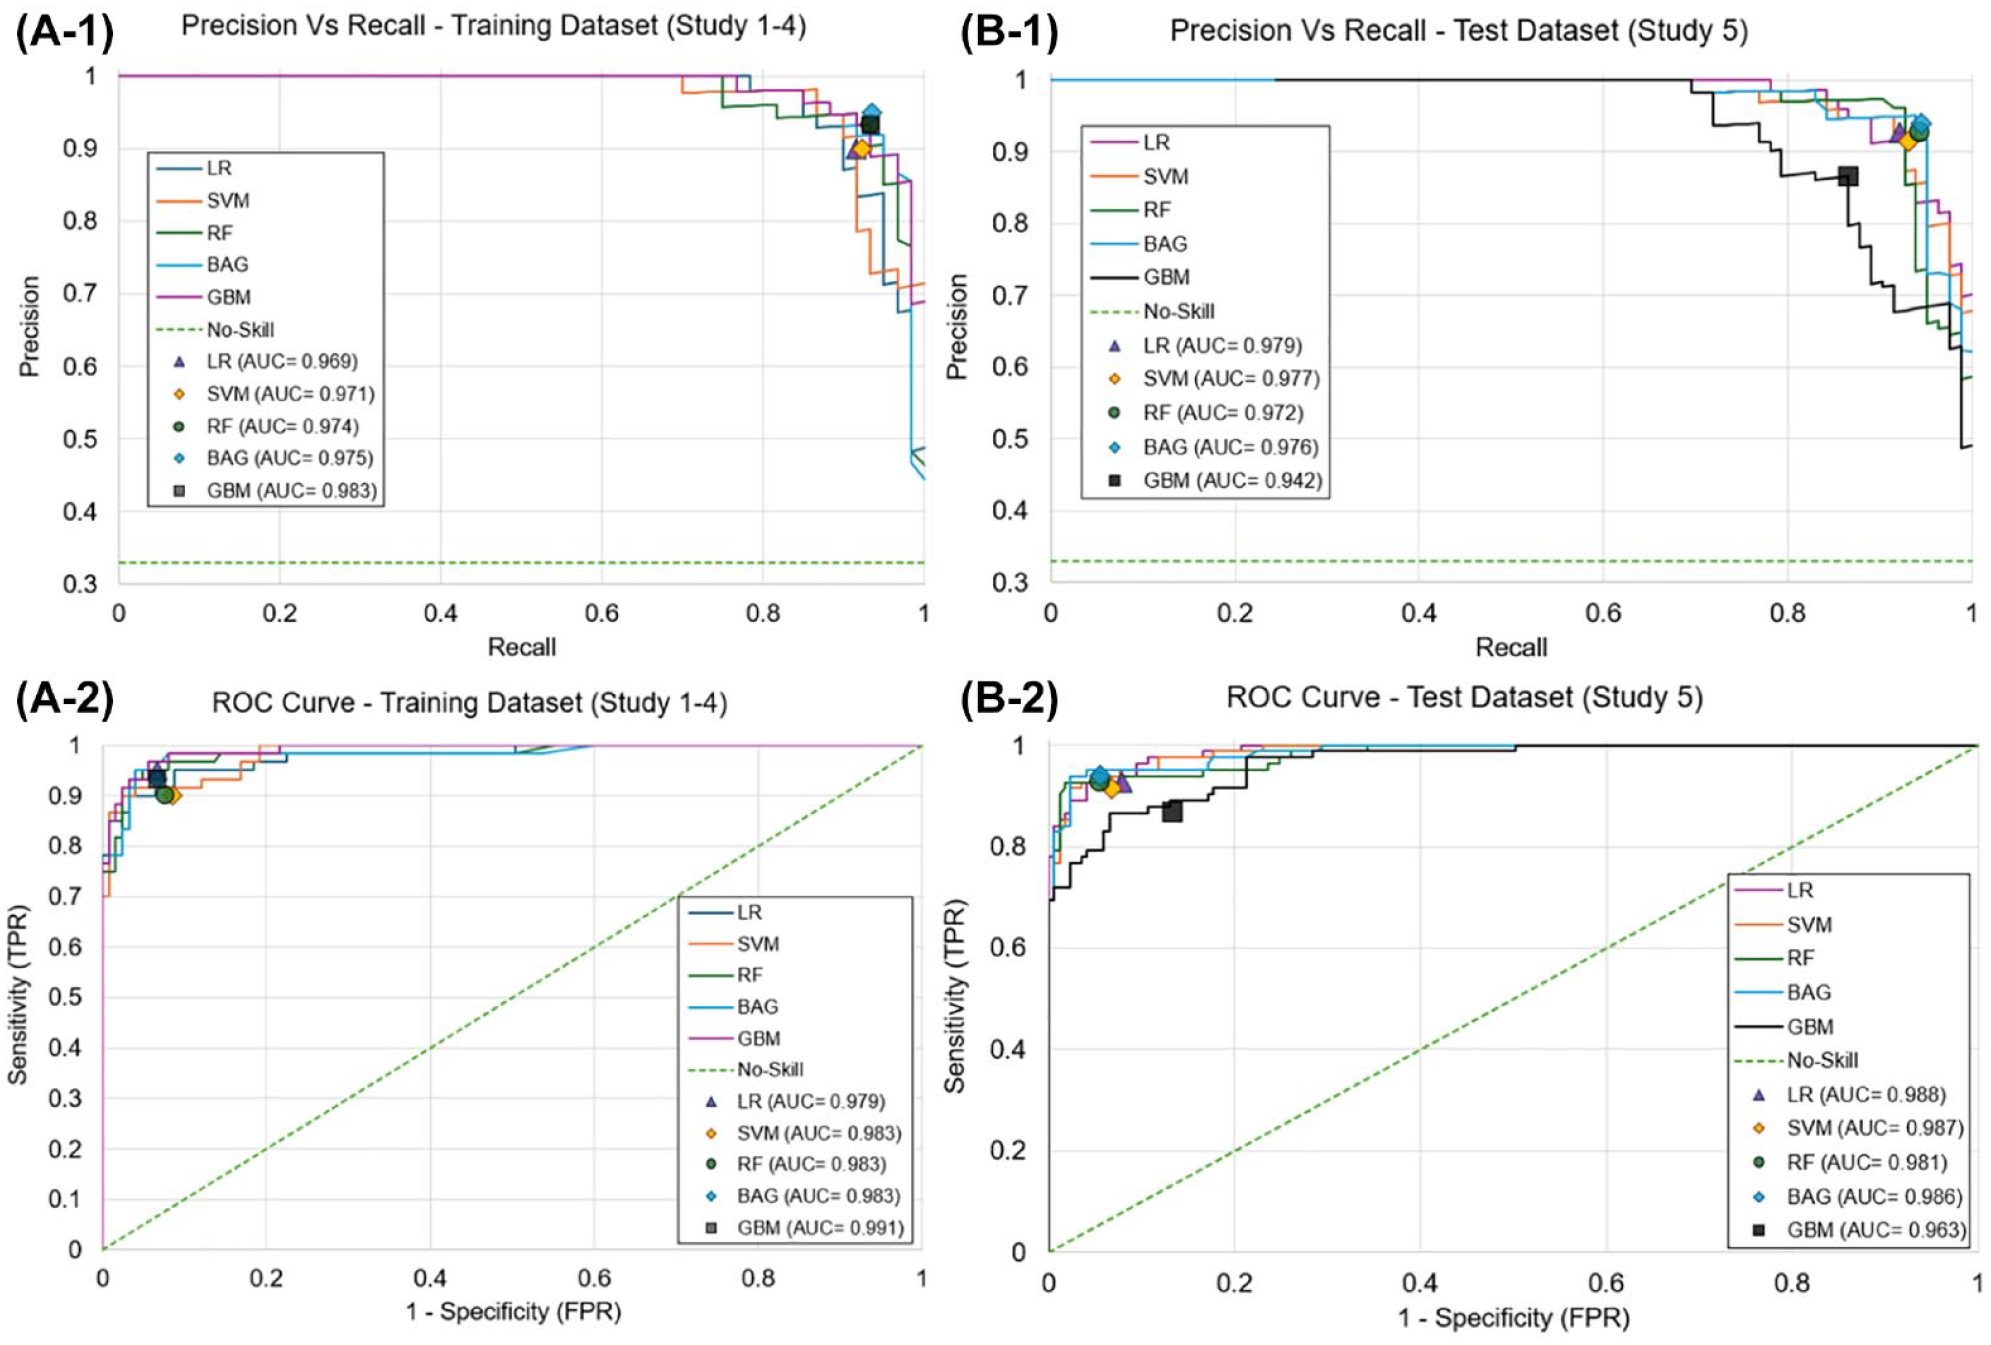
ROC and PR curves for best identified model during hyperparameter tuning and subsequent results during model testing. Best performance per model identified with marker. A-1: GBM had the best PR AUC (0.983) during tuning; A-2: BGM had best ROC AUC of (0.991) during tuning. B-1: LR has the best PR AUC (0.979) during testing; B-2: LR had the best ROC AUC (0.988) during testing. Abbreviations: AUC, area under the curve; BAG, Bagging classifier; GBM, gradient boosting classifier; LR, logistic regression; PR, precision and recall; RF, random forest; RFE, recursive feature elimination; ROC, receiver operating characteristic curve; SVM, support vector machine; TNR, true negative rate; TPR, true positive rate.
Model Testing/Final Evaluation
After tuning, each model was tested on the unused force dataset from study 5. In each scenario, the model’s classification was compared directly to the manually assigned infusion labels and was then rated as: true positive (TP) (correctly identified dysfunctional delivery), true negative (TN) (correctly identified functional delivery), false positive (FP) (incorrectly identified a functional delivery as dysfunctional), or false negative (FN) (incorrectly identified a dysfunctional delivery as functional).
The performance of the model’s classification system was subsequently compared against the hypothetical performance of the built-in occlusion alarm threshold system from existing commercially available pump systems. Each infusion was labeled as either “Functional” or “Dysfunctional” based on whether or not the force value collected by the study pump (study 5) exceeded each pump system’s specified threshold for occlusion detection after being scaled to force: 13.15 PSI (10 885 mN), 21.75 PSI (14 979 mN), 30.00 PSI (19 084 mN), and 35.00 PSI (21 783 mN) for Medtronic, Roche, Tandem/Beta Bionics, and Insulet, respectively.10-14 Mirroring the approach taken to assess the performance of our model, each scenario was compared to the manually determined labels and rated as TP, TN, FP, and FN. Accuracy, sensitivity (true positive rate, TPR), specificity (true negative rate, TNR), false positive rate (FPR), false negative rate (FNR), and Matthew’s correlation coefficient (MCC) were determined to evaluate performance of both the classifier and each of the occlusion pressure thresholds. 30
Results
Of the 251 values included in the testing dataset, 169 (67.3%) were labeled as “Functional” and 82 (32.7%) were “Dysfunctional.” All five trained models were evaluated on the testing set. A summary of the different model performances is described in Table 3. Of the five, BAG (29 features) had the highest accuracy (96%), MCC (0.909), sensitivity (94%), specificity (97%), FPR (3.0%), and FNR (6.0%). This was followed by LR, SVM, RF, and finally GBM. Overall, all models showed accuracies ≥0.9, but only BAG had an MCC ≥0.9. All models showcased strong PR-AUC and ROC-AUC scores during testing with LR having the highest in both instances with 0.979 and 0.988, respectively, followed by SVM, BAG, RF, and GBM (Figure 5). All classifications were observed within 13 to 120 seconds following bolus completion and were dependent on bolus size and injection speed.
Performance of the Models and Occlusion Alarm Thresholds on the Testing Dataset (Total N = 251, 169 Functional, 82 Dysfunctional).
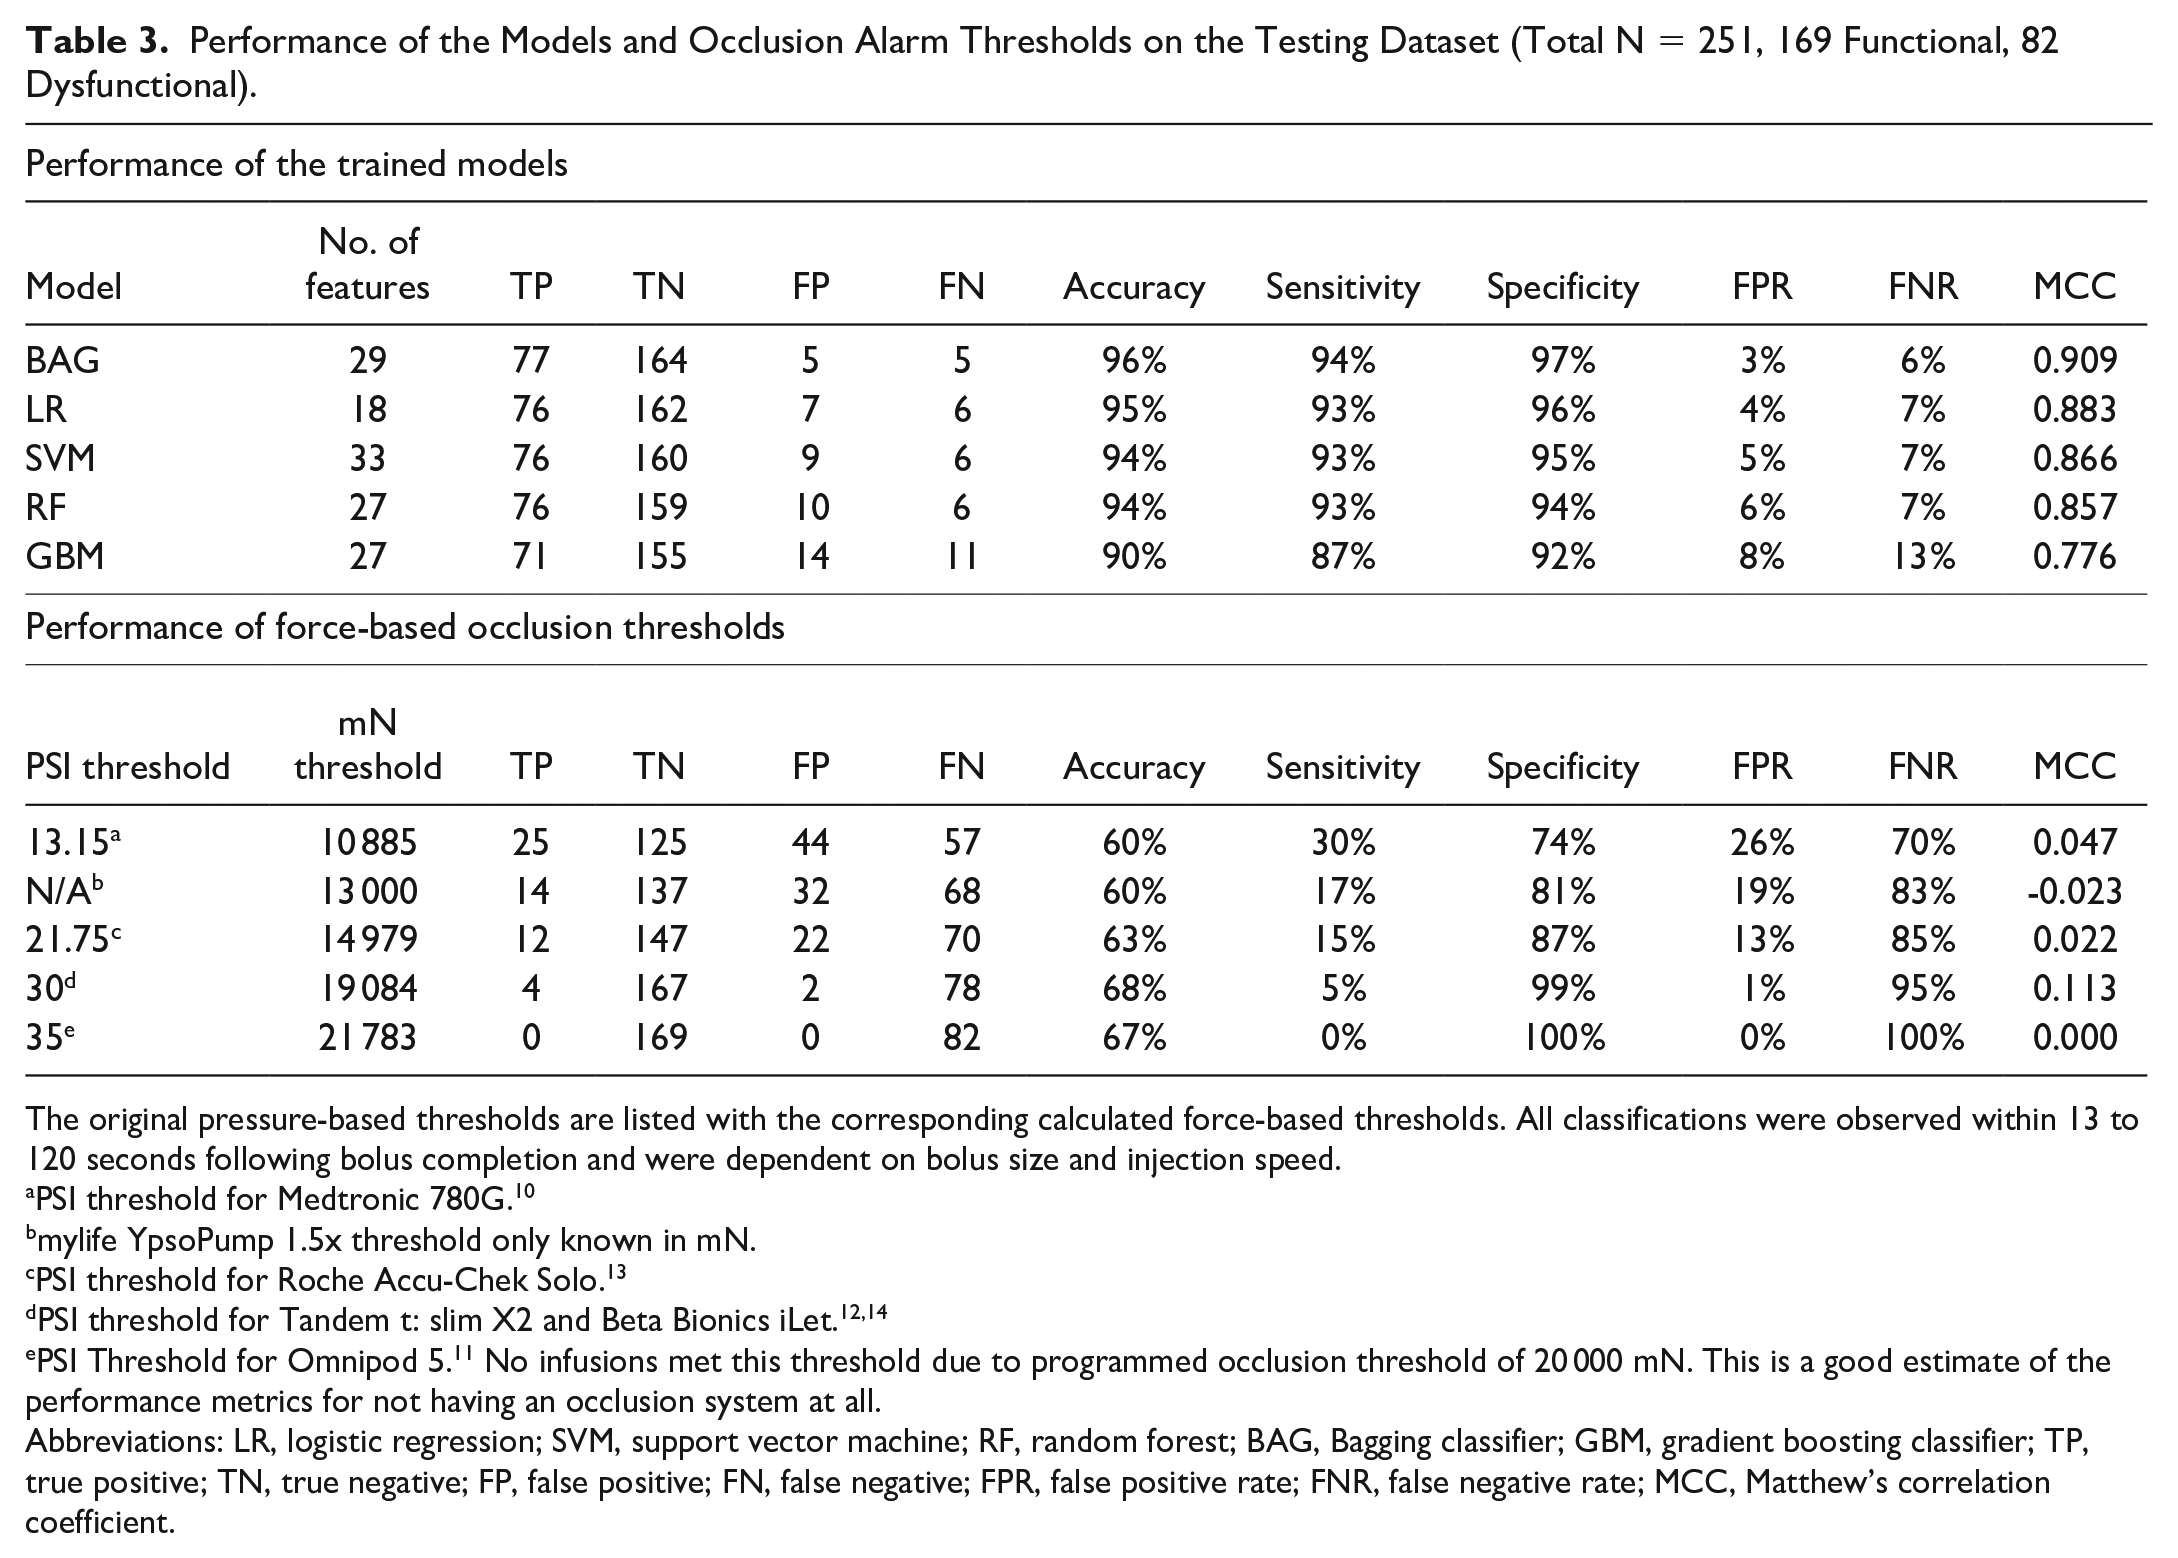
The original pressure-based thresholds are listed with the corresponding calculated force-based thresholds. All classifications were observed within 13 to 120 seconds following bolus completion and were dependent on bolus size and injection speed.
PSI threshold for Medtronic 780G. 10
mylife YpsoPump 1.5x threshold only known in mN.
PSI threshold for Roche Accu-Chek Solo. 13
PSI Threshold for Omnipod 5. 11 No infusions met this threshold due to programmed occlusion threshold of 20 000 mN. This is a good estimate of the performance metrics for not having an occlusion system at all.
Abbreviations: LR, logistic regression; SVM, support vector machine; RF, random forest; BAG, Bagging classifier; GBM, gradient boosting classifier; TP, true positive; TN, true negative; FP, false positive; FN, false negative; FPR, false positive rate; FNR, false negative rate; MCC, Matthew’s correlation coefficient.
The hypothetical performances of the built-in occlusion alarm threshold systems across the testing dataset from existing commercially available pump systems (Table 3). Figure 6 illustrates the comparative rates of correctively versus incorrectly identified functional and dysfunctional sites between the BAG model and the various pressure-based occlusion thresholds.
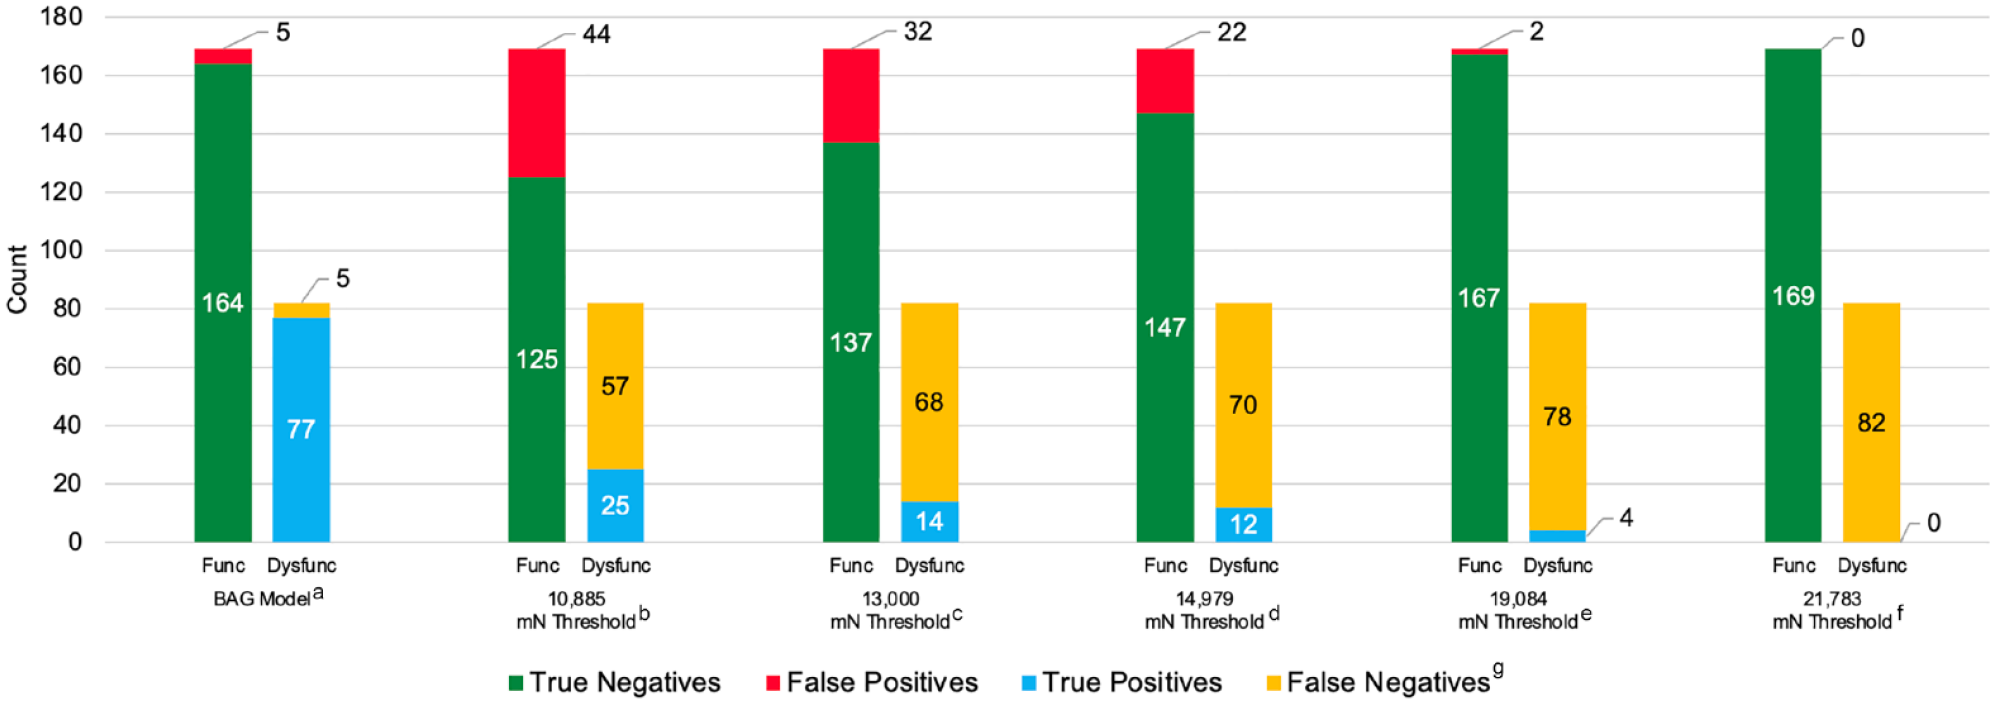
Performance of the BAG classifier and occlusion alarm thresholds on the testing dataset. aBAG classification model. b13.15 PSI threshold for Medtronic 780G converted to 10 885 mN. cYpsomed mylife YpsoPump 1.5x threshold reported in mN. d21.75 PSI threshold for Roche Accu-Chek Solo converted to 14 979 mN. e30 PSI threshold for Tandem t:slim X2 and Beta Bionics iLet converted to 19 084 mN. f35 PSI Threshold for Omnipod 5 converted to 21 783. No infusions met this threshold due to the study pump occlusion threshold being set at 20 000 mN for study 5. This is a good estimate of the performance metrics for not having an occlusion system at all. gTrue Negative (correctly identified functional delivery), False Positive (incorrectly identified a functional delivery as dysfunctional), True Positive (correctly identified dysfunctional delivery), False Negative (incorrectly identified a dysfunctional delivery as functional). Abbreviations: Func, functional; Dysfunc, dysfunctional; BAG, Bagging classifier.
Discussion
This study demonstrates that the dynamic models trained on our animal data effectively detects infusion set failures using data from an insulin pump’s onboard force sensor. Compared to standard commercial pump occlusion detection thresholds, we achieve higher accuracy, sensitivity, specificity, and MCC with fewer FPs and FNs. These improvements are primarily attributable to the reductions in both FPs and FNs. Of the models, BAG yielded the highest performance; however, even LR (the least complex model) performed nearly as well. Given the robustness of the models showcased, we believe this methodology serves as a suitable foundation for training future iterations of the models. This work may also be expanded to investigate multiclass classification to target detection of partial occlusions and leaks in future work.
Standard threshold methods are limited by an inverse trade-off between either increasing FPR or FNR as the threshold is increased or decreased, respectively. These trade-offs present challenges. On one hand, reducing FPs is beneficial because it lowers the risk of alarm fatigue and reduces user burden by minimizing unnecessary alerts. On the other hand, an increase in FNs leaves users to rely on hyperglycemia to detect failures. This reliance can be problematic, as evidenced by data showing that only 25% of PWD report being alerted of a failure via their pump’s alarm system. 5
A limitation of this study is the reliance on non-human animal data used for both training and testing the algorithm. While swine models offer a reasonable approximation of human tissue and the use of imaging data allows for confirmation of bolus infusion, the ideal validation scenario would involve testing the classifier on human data. Incorporating human glucose data could provide a better understanding of the algorithm’s potential effect on glycemic management. A substantial portion of the training data originated from insulin infusion sets used in an ambulatory setting with insulin over more extended periods up to 2.02 (± 0.84) days, which we consider a strength. However, the lack of inclusion of these data in the testing set is a limitation that opens avenues for future research. In addition, our testing included small-volume boluses, but did not test more extended basal delivery scenarios (this type of data was collected during study 4 and will be examined in later work).
Another notable limitation was the need to translate pressure measurements into force values in our preclinical training dataset. Despite effective dataset training, as evidenced by a strong MCC, the conversion means training itself was conducted on processed rather than raw data, potentially introducing model bias.
Finally, while the model effectively identifies individual bolus failures, there is an important need to take a step further, developing a more sophisticated system that translates into a more comprehensive assessment of current infusion functionality. This should extend to providing actionable recommendations to the user about when to replace the infusion site. We envision the development of a system that evaluates the health of the infusion site on a gradient scale, offering a nuanced understanding of its condition and clearer guidance for users.
To address these limitations and fully assess the algorithm’s effectiveness and applicability in a real-world context, we recommend conducting a future clinical trial. This trial should involve multi-day, or extended wear infusion sets being worn until failure and incorporating the algorithm into the pump’s functioning. Such a study would not only validate the algorithm’s performance in managing insulin delivery but also explore its potential benefits for glycemic control in a clinical setting.
The algorithm offers considerable potential advantages for detecting failures in insulin delivery systems, marking a substantial advancement. Its primary advantage lies in its ability to identify site failures immediately, without the need for glucose data or hyperglycemia to trigger an alert. This capability could empower individuals to address issues with their infusion sites as soon as they occur, thereby reducing the risk of hyperglycemia and preventing more severe complications, such as DKA. In addition, because the algorithm operates based on data from onboard force sensors, its implementation could be possible across a variety of systems and infusion set types. This potential universal compatibility could allow board adoption, offering all users, regardless of their specific devices, the opportunity to enhance the safety and efficacy of their insulin therapy.
Conclusion
We have developed an innovative model for detecting infusion failures that outperforms traditional onboard occlusion pump alarms. This model provides immediate detection of failures without requiring glucose or other external input, making it a robust tool that could be applied across a variety of system configurations and subcutaneous infusion set types. As insulin pump systems increasingly evolve toward greater automation, reducing the need for user inputs and expanding into applications such as inpatient care, 31 our model marks an important advancement toward ensuring the reliability and integrity of insulin delivery. While automation will eventually eliminate the need for meal boluses and perhaps even exercise announcements, the person living with diabetes still needs to ensure hardware attached to the body is functioning. This innovation is also particularly timely, given the recent introduction of extended wear infusion sets, 32 which present a wider timeframe for infusion failure, making them prime candidates for the benefits of an active monitoring system. Moving forward, we aim to take the next steps in refining our approach to develop a comprehensive model that monitors the overall health of the infusion, providing a foundation for safer and more reliable CSII therapy and ultimately allowing users to truly visualize the health of their insulin delivery devices.
Supplemental Material
sj-docx-1-dst-10.1177_19322968241247530 – Supplemental material for Development of a Real-time Force-based Algorithm for Infusion Failure Detection
Supplemental material, sj-docx-1-dst-10.1177_19322968241247530 for Development of a Real-time Force-based Algorithm for Infusion Failure Detection by Luis E. Blanco, John H. Wilcox, Michael S. Hughes and Rayhan A. Lal in Journal of Diabetes Science and Technology
Supplemental Material
sj-docx-2-dst-10.1177_19322968241247530 – Supplemental material for Development of a Real-time Force-based Algorithm for Infusion Failure Detection
Supplemental material, sj-docx-2-dst-10.1177_19322968241247530 for Development of a Real-time Force-based Algorithm for Infusion Failure Detection by Luis E. Blanco, John H. Wilcox, Michael S. Hughes and Rayhan A. Lal in Journal of Diabetes Science and Technology
Supplemental Material
sj-docx-3-dst-10.1177_19322968241247530 – Supplemental material for Development of a Real-time Force-based Algorithm for Infusion Failure Detection
Supplemental material, sj-docx-3-dst-10.1177_19322968241247530 for Development of a Real-time Force-based Algorithm for Infusion Failure Detection by Luis E. Blanco, John H. Wilcox, Michael S. Hughes and Rayhan A. Lal in Journal of Diabetes Science and Technology
Footnotes
Acknowledgements
We thank Dr Marzia Cescon for assistance in algorithm development and data review. We thank Dr Jasmin Kastner for reviewing this manuscript and for assisting in data analysis. We thank John Clark Gray for assisting in the planning and performance of the listed preclinical studies. We thank the MERI staff, UTHSC veterinary staff, and Dr Samuel Tyler Aycock for assisting in study planning, animal care, and study performance. We thank Dr Olivia Lou and Dr Jonathan Rosen from JDRF for their support in our research efforts. We thank Dr Juan Espinoza and Dr Grzegorz Zapotoczny from The Consortium for Technology & Innovation in Pediatrics for assisting in the acquisition of funding for the studies.
Abbreviations
2D, two-dimensional; 3D, three-dimensional; AUC, area under the curve; BAG, bagging classifier; CGM, continuous glucose monitoring; CSII, continuous subcutaneous insulin infusion; DAC, data acquisition device; DKA, diabetes-related ketoacidosis; FN, false negative; FNR, false negative rate; FP, false positive; FPR, false positive rate; GBM, gradient boosting classifier; GNB, Gaussian Naive-Bayes; GPC, Gaussian process classifier; LDA, linear discriminant analysis; LDT, less dense tissue; LR, logistic regression; MCC, Matthew’s correlation coefficient; MERI, Medical Education & Research Institute; PR, precision and recall; PWD, people with diabetes; RF, random forest; RFE, recursive feature elimination; ROC, receiver operating characteristic curve; SMOTE, synthetic minority oversampling technique; SVM, support vector machine; TN, true negative; TNR, true negative rate; TP, true positive; TPR, true positive rate; UTHSC, University of Tennessee Health Science Center.
Declaration of Conflicting Interests
The author(s) declared the following potential conflicts of interest with respect to the research, authorship, and/or publication of this article: LEB and JHW are full-time employees of Diatech Diabetes, Inc. MSH has consulted for Dexcom and has received research support from Insulet and Tandem. RAL receives consulting fees from Abbott Diabetes Care, Adaptyx Biosciences, Biolinq, Capillary Biomedical, Deep Valley Labs, Gluroo, PhysioLogic Devices, Portal Insulin, and Tidepool. He has served on the advisory boards for ProventionBio and Lilly. He receives research support from Insulet, Medtronic, and Tandem.
Funding
The author(s) disclosed receipt of the following financial support for the research, authorship, and/or publication of this article: This work was funded by Diatech Diabetes, Inc., The Consortium for Technology & Innovation in Pediatrics (P50FD007963, PI: Espinoza), The National Institute of Diabetes and Digestive and Kidney Diseases (1R43DK130036-01 [LEB and JHW], 1K23DK138267 [MSH], 1K23DK122017 [RAL], P30 DK116074 [MSH and RAL]), and JDRF (grant number 3-IND-2023-1444-I-X [LEB & JHW]). Pump and consumables for Study 4 and 5 were donated by Ypsomed AG (Burgdorf, Switzerland).
Supplemental Material
Supplemental material for this article is available online.
References
Supplementary Material
Please find the following supplemental material available below.
For Open Access articles published under a Creative Commons License, all supplemental material carries the same license as the article it is associated with.
For non-Open Access articles published, all supplemental material carries a non-exclusive license, and permission requests for re-use of supplemental material or any part of supplemental material shall be sent directly to the copyright owner as specified in the copyright notice associated with the article.