
Abstract
Background:
This phase 1, randomized, one-day, five-period crossover study in adults with type 1 diabetes on continuous subcutaneous insulin infusion investigated local infusion site pain following infusion of the excipients of ultra rapid lispro (URLi; without insulin) across infusion sites and depths.
Methods:
Forty participants (mean age, 40.5 years; body mass index [BMI], 27.5) were randomized to one of five infusion site sequences consisting of the arm, thigh, buttock (6 mm cannula depth), and abdomen (6 and 9 mm depth). Basal infusion of sodium citrate and treprostinil in diluent with magnesium chloride was initiated (10 μL/h) and at three, six, and nine hours after basal initiation, 15 unit-equivalent boluses (150 μL) were given. Participants rated their pain on a 0 to 100 mm validated visual analog scale (VAS) at 5 minutes pre-bolus and 1 and 15 minutes post-bolus.
Results:
At one minute post-bolus, increased VAS scores were occasionally reported. Most one minute post-bolus scores were ≤10 mm (little to no discomfort) while 7 of 577 were >45 mm (generally considered clinically meaningful pain). Painful infusions were reported more frequently for the arm, and mean VAS scores were higher for the arm compared with the thigh and abdomen. The VAS score distributions were similar between cannula depths. By 15 minutes post-bolus, VAS scores returned to pre-bolus levels.
Conclusions:
Local infusion site discomfort after infusion of URLi excipients was reported by a small subset of participants; it was transient, tolerable, and dependent on infusion site but not infusion depth. Given differences within individuals, patients may consider using a different infusion site if they experience discomfort.
Clinicaltrial.gov identifier:
NCT05067270.
Introduction
Despite advances in recent decades in the treatment of diabetes, achieving glycemic goals remains challenging for many people with diabetes.1-3 One such development is the rise of continuous subcutaneous insulin infusion (CSII), which has the potential to improve glycemic control compared with multiple daily injection (MDI) therapy.4,5 A number of rapid-acting insulins have been developed for both MDI and CSII.6,7 Ultra rapid lispro (URLi; Lyumjev) is an insulin lispro formulation that contains locally acting excipients, citrate and treprostinil, to accelerate insulin absorption and time action, as well as magnesium to enhance insulin stability. URLi has demonstrated accelerated absorption and improved postprandial glucose (PPG) control compared with Lispro (Humalog) including when administered via CSII in adults with type 1 diabetes (T1D). 8 Compatibility and safety of URLi with CSII use have also been shown. 9
Painful administration of insulin presents a treatment tolerability issue for people with diabetes. Studies have investigated the effect of various factors including needle configuration and injection site, speed, and volume on pain perception following subcutaneous injections.10-14 Local infusion site pain is multifaceted and different factors may play a role in pain perception including the formulation, anatomical site of infusion, and infusion set configuration. Treprostinil has been associated with pain on infusion when administered as Remodulin for the treatment of pulmonary arterial hypertension (PAH) 15 although, in the current study, the total daily dose was 50-fold lower than the lowest starting dose used for treatment of PAH. Citrate has been associated with pain in formulations at significantly lower pH,16-19 but in recent literature has been demonstrated not to cause pain at pH 7.4. 20
In the phase 3 PRONTO-Pump-2 study in people with T1D using CSII, URLi demonstrated noninferiority to Lispro in HbA1c change and provided superior PPG control and less time in hypoglycemia. 21 More frequent infusion site reactions (ISRs) were reported with URLi compared with Lispro although more than 90% were mild or moderate in severity. Typically, when local infusion site pain was noted, it occurred immediately after infusion of a bolus dose, subsiding over the 20 to 30 minutes thereafter. Subgroup analyses found a statistically significant treatment-by-infusion-set-cannula-length interaction (cannula length 6 mm vs greater than 6 mm). The greater than 6 mm cannula included 9 mm Quickset or Mio or 13 mm Silhouette. There was a statistically significantly higher incidence of ISRs with URLi versus Lispro when infusion set cannula length was 6 mm but similar ISR incidence when cannula length was greater than 6 mm. 21
The aim of this study was to investigate whether local infusion site pain is dependent on the site of infusion (arm, thigh, abdomen, buttock) and/or depth of infusion (6 and 9 mm infusion set cannula length) following bolus infusion of URLi excipients citrate and treprostinil. For each bolus infusion, participants rated pain using the 0 to 100 mm visual analog scale (VAS) 22 at 5 minutes pre-bolus, and 1 and 15 minutes post-bolus.
Methods
Study Design
This was a phase 1, randomized, one-day, five-period crossover, single treatment study in adults with T1D on CSII. The study was conducted at two centers (Profil, Neuss and Mainz, Germany) in accordance with the Declaration of Helsinki, the International Conference on Harmonization Guidelines for Good Clinical Practice, and applicable local laws and regulations. All procedures were approved by an ethics review board and all participants provided written informed consent before participating in the study. The study was registered at ClinicalTrials.gov (NCT05067270).
Participants
Adults aged 18 to 69 years with T1D and using intensive insulin therapy for ≥1 year were eligible for inclusion in this study if they had been treated with CSII for ≥6 months, had HbA1c ≤9.0%, and a body mass index (BMI) 18.5 to 35.0 kg/m2. Participants were excluded if had used or were currently using URLi as part of their standard insulin therapy, had >1 episode of severe hypoglycemia within previous 90 days, had >1 emergency room visit/hospitalization due to poor glucose control (hyperglycemia or diabetic ketoacidosis) within previous six months, or were taking anesthetics or pain medication regularly or intermittently which could interfere with interpretation of pain scale.
Treatment and Procedures
The study consisted of a separated informed consent and screening visit, followed by a one-day study period and a safety follow-up one to five days after the study period. Participants were randomly assigned to one of five infusion site sequences consisting of the abdomen, arm, thigh, buttock (6 mm cannula depth), and abdomen (6 and 9 mm cannula depth). Participants were blinded to infusion depth. Participants used five Medtronic MiniMed 770G pumps to deliver, at each site, infusions of URLi excipients without insulin lispro. Participants continued to use their personal insulin pump throughout the study and therefore used a total of six infusion sets and pumps. The infusion solution consisted of Humalog diluent (Eli Lilly and Company, IN, USA) plus sodium citrate (15 mM), treprostinil (1 μg/mL), and magnesium chloride (5 mM).
Participants were admitted to the study center on day -1. On day 1, prior to the insertion of the first infusion set, the thickness of the subcutaneous adipose tissue layer at the abdomen, arm, thigh, and buttock areas was measured in mm using ultrasound technique and recorded in the electronic case report form. The evaluated site was identified with a unique identifier. Infusion set cannulas were inserted into each infusion site in sequence, and basal infusion was initiated at a rate of 10 μL/h with an approximate 30-minute interval between each infusion site. Approximately three, six, and nine hours after the start of basal infusion, a bolus dose of 150 μL was delivered at quick speed (150 μL/min) to each infusion site with an approximate 30-minute interval between infusion sites. Quick speed was thought to be most likely to generate a measurable difference in VAS scores. Following the final bolus infusion, infusion sets were removed, and sites were evaluated for acute local ISRs.
Assessments
Participants rated local pain at each infusion site using the 0 to 100 mm pain VAS at 5 minutes pre-bolus, and 1 and 15 minutes post-bolus. The VAS is a well-validated tool to assess catheter insertion site pain. 22 The VAS was presented as a 100 mm line, anchored by verbal descriptors, “no pain” and “worst imaginable pain.” Participants were asked to mark the line to rate pain intensity associated with each bolus infusion on a scale of 0 to 100 mm.
Adverse events (AEs), serious AEs (SAEs), and discontinuations due to AEs were listed. Treatment-emergent AEs (TEAEs) were listed and summarized by severity while those TEAEs attributable to infusion sites were also summarized by infusion site location. Local ISRs were assessed for erythema, induration, categorical pain, pruritus, and edema. The ISRs were summarized by infusion site location.
Statistical Analyses
It was estimated 40 completing participants would provide approximately 80% power to demonstrate a 55% increase in VAS score. Testing was done at an α-level of 0.05 with a two-sided confidence interval (CI). The analysis set consisted of all randomized participants, and the safety analysis set consisted of all randomized participants who received at least one infusion.
The VAS scores were listed and summarized by bolus time, infusion site, and VAS assessment time point using standard descriptive statistics. Frequencies and percentages of VAS scores in each of the prespecified categories of 0, 1 to 10, 11 to 20, 21 to 45, and 46 to 100 mm were summarized by bolus time, infusion site, and time point. Geometric least squares mean (LSM) scores were calculated by bolus time, infusion site, and time point.
A mixed-effects model was used to analyze the log transformed VAS score for each bolus time and time point. The model included terms for infusion site location, period (order of infusions); bolus time; time point; the two- and three-way interactions between infusion site location, bolus time, and time point as fixed effects and participant as a random effect. Comparisons were made between infusion site locations/depths for each bolus time and VAS time point.
Geometric LSM, infusion site location differences in LSM, and the corresponding 95% CIs for the infusion site location were estimated and back-transformed from the log scale to provide estimates of the ratio of LSMs and 95% CI for the ratio. Because there were many VAS scores of 0, all scores were analyzed as log (VAS + 1). The same model was used to analyze the change from the pre-bolus time point to post-bolus time points. Statistical significance was claimed if the 95% CI for the LSM ratio did not contain one.
Results
Demographics, Baseline Characteristics, and Disposition
A total of 40 participants with T1D were enrolled in the study. Ten were female (25%) and 30 male (75%) participants. All participants were white. Participants had a mean (SD) age of 40.5 (12.0) years, weight 87.2 (11.6) kg, BMI 27.5 (2.8) kg/m2, and duration of diabetes 23.0 (13.1) years.
All 40 participants received the planned infusion volume of study treatment, and all completed the study. Thirty-three (82.5%) participants completed the study without missing VAS data, while 7 (17.5%) had VAS data missing for some time points.
VAS Scores
From the 40 study participants, a total of 1730 VAS scores were obtained from the three measurement time points (5 minutes pre-bolus, 1 minute post-bolus, 15 minutes post-bolus) for each bolus infusion at the five infusion sites (arm, thigh, abdomen 6 mm, abdomen 9 mm, buttock) and at three different bolus times (three, six, and nine hours).
At five minutes pre-bolus, geometric mean VAS scores were around 1.5 mm on a scale of 0 to 100 mm at all infusion sites and bolus times. At one minute post-bolus, VAS scores were statistically significantly higher compared with five minutes pre-bolus at all infusion sites and bolus times, although mean VAS scores remained below 5 mm. By 15 minutes post-bolus, scores had returned to their pre-bolus levels (Figure 1).
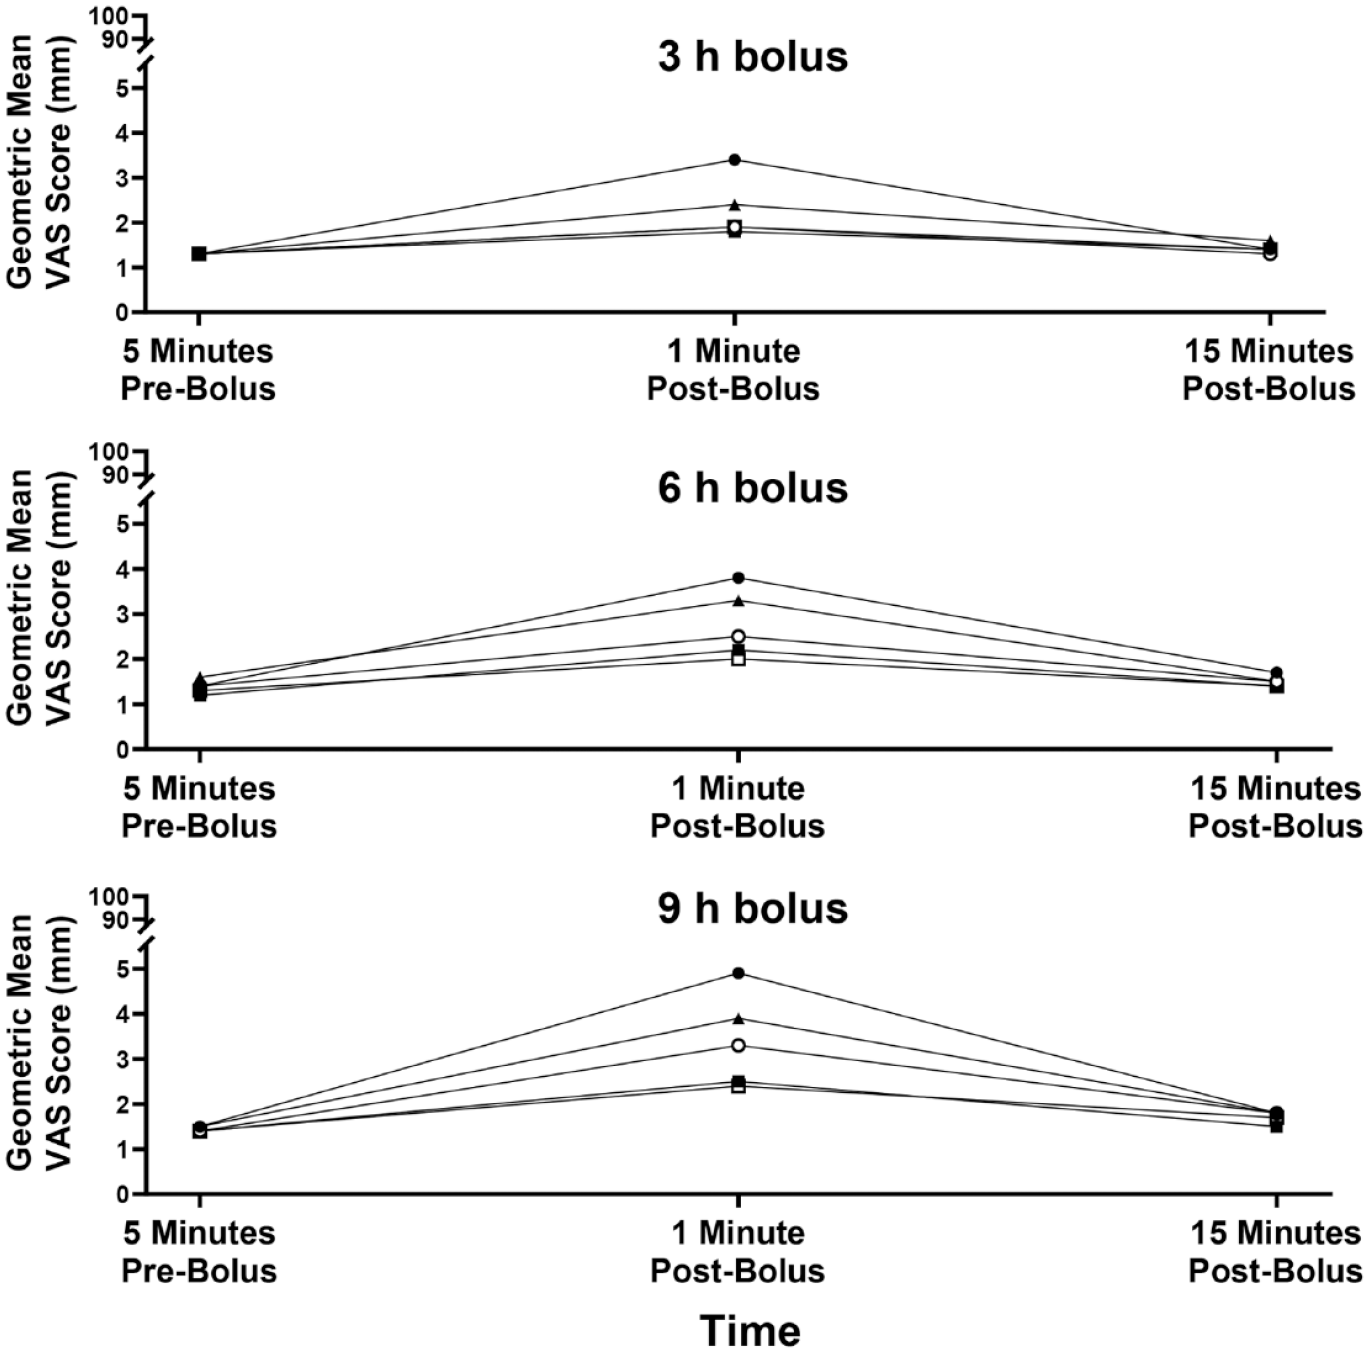
Geometric least square mean VAS scores by infusion site by VAS time point for 150 μL bolus infusions of URLi excipients, sodium citrate, treprostinil, and magnesium chloride in Humalog diluent (without insulin). Mean VAS scores for three, six, and nine hours bolus times are shown. Abbreviations: VAS, visual analog scale; URLi, ultra rapid lispro.
The total number of infusions at one minute post-bolus were subdivided by infusion site and different VAS categories. A VAS score of 0 or 1-10 mm corresponds to no pain or little to no discomfort and was reported for most infusions (500 out of 577; 86.7%), while VAS scores >45 mm are generally considered clinically meaningful pain and were reported for 1.2% infusions (7 out of 577; Figure 2). Twenty-one out of 40 participants had no scores >10 mm throughout the entire study while 5 out of 40 (12.5%) participants had scores >45 mm (Figure 3).
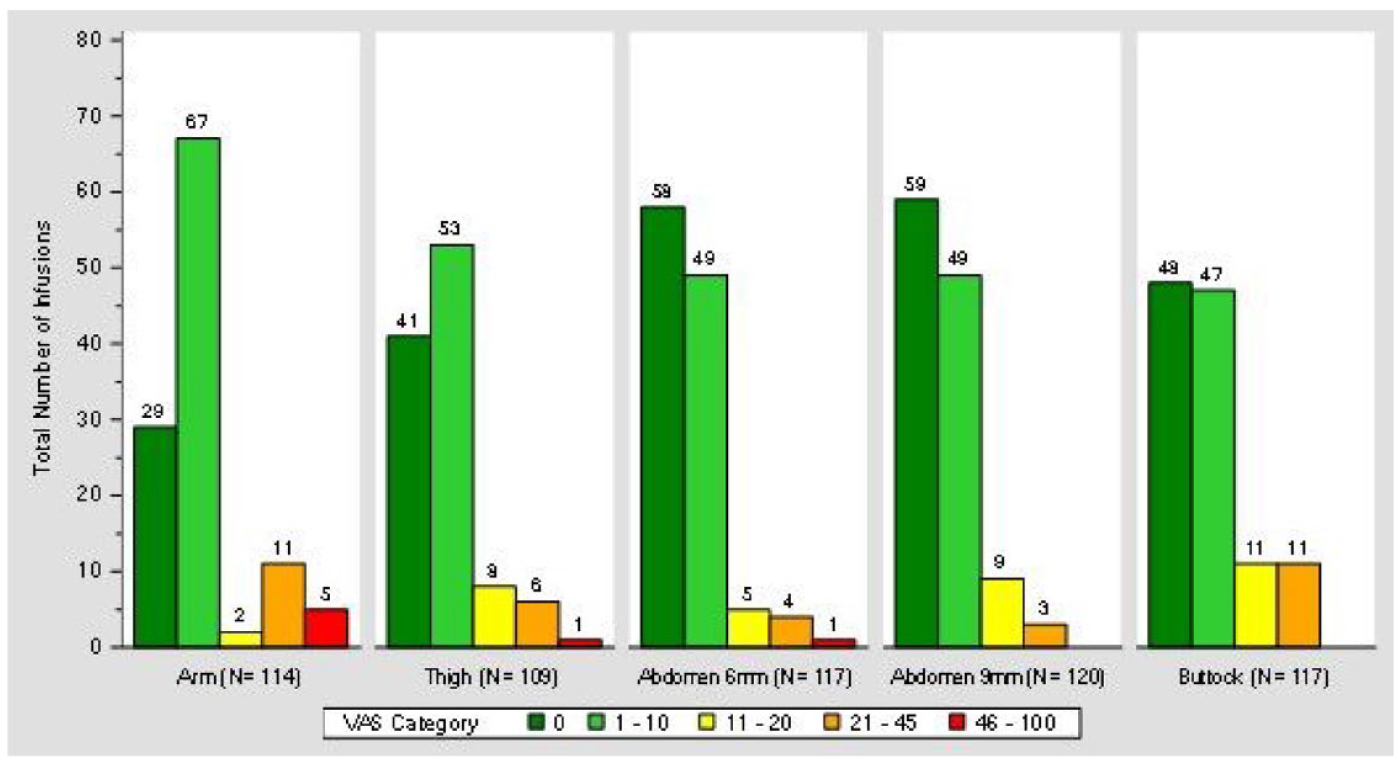
Number of infusions categorized by 0 to 100 mm VAS scores at one minute post-bolus after 150 μL bolus infusions of URLi excipients, sodium citrate, treprostinil, and magnesium chloride in Humalog diluent (without insulin). Each participant was given a bolus infusion at each site three, six, and nine hours after infusion set cannula were placed. Aggregated VAS scores by VAS category are shown. Abbreviations: VAS, visual analog scale; URLi, ultra rapid lispro.
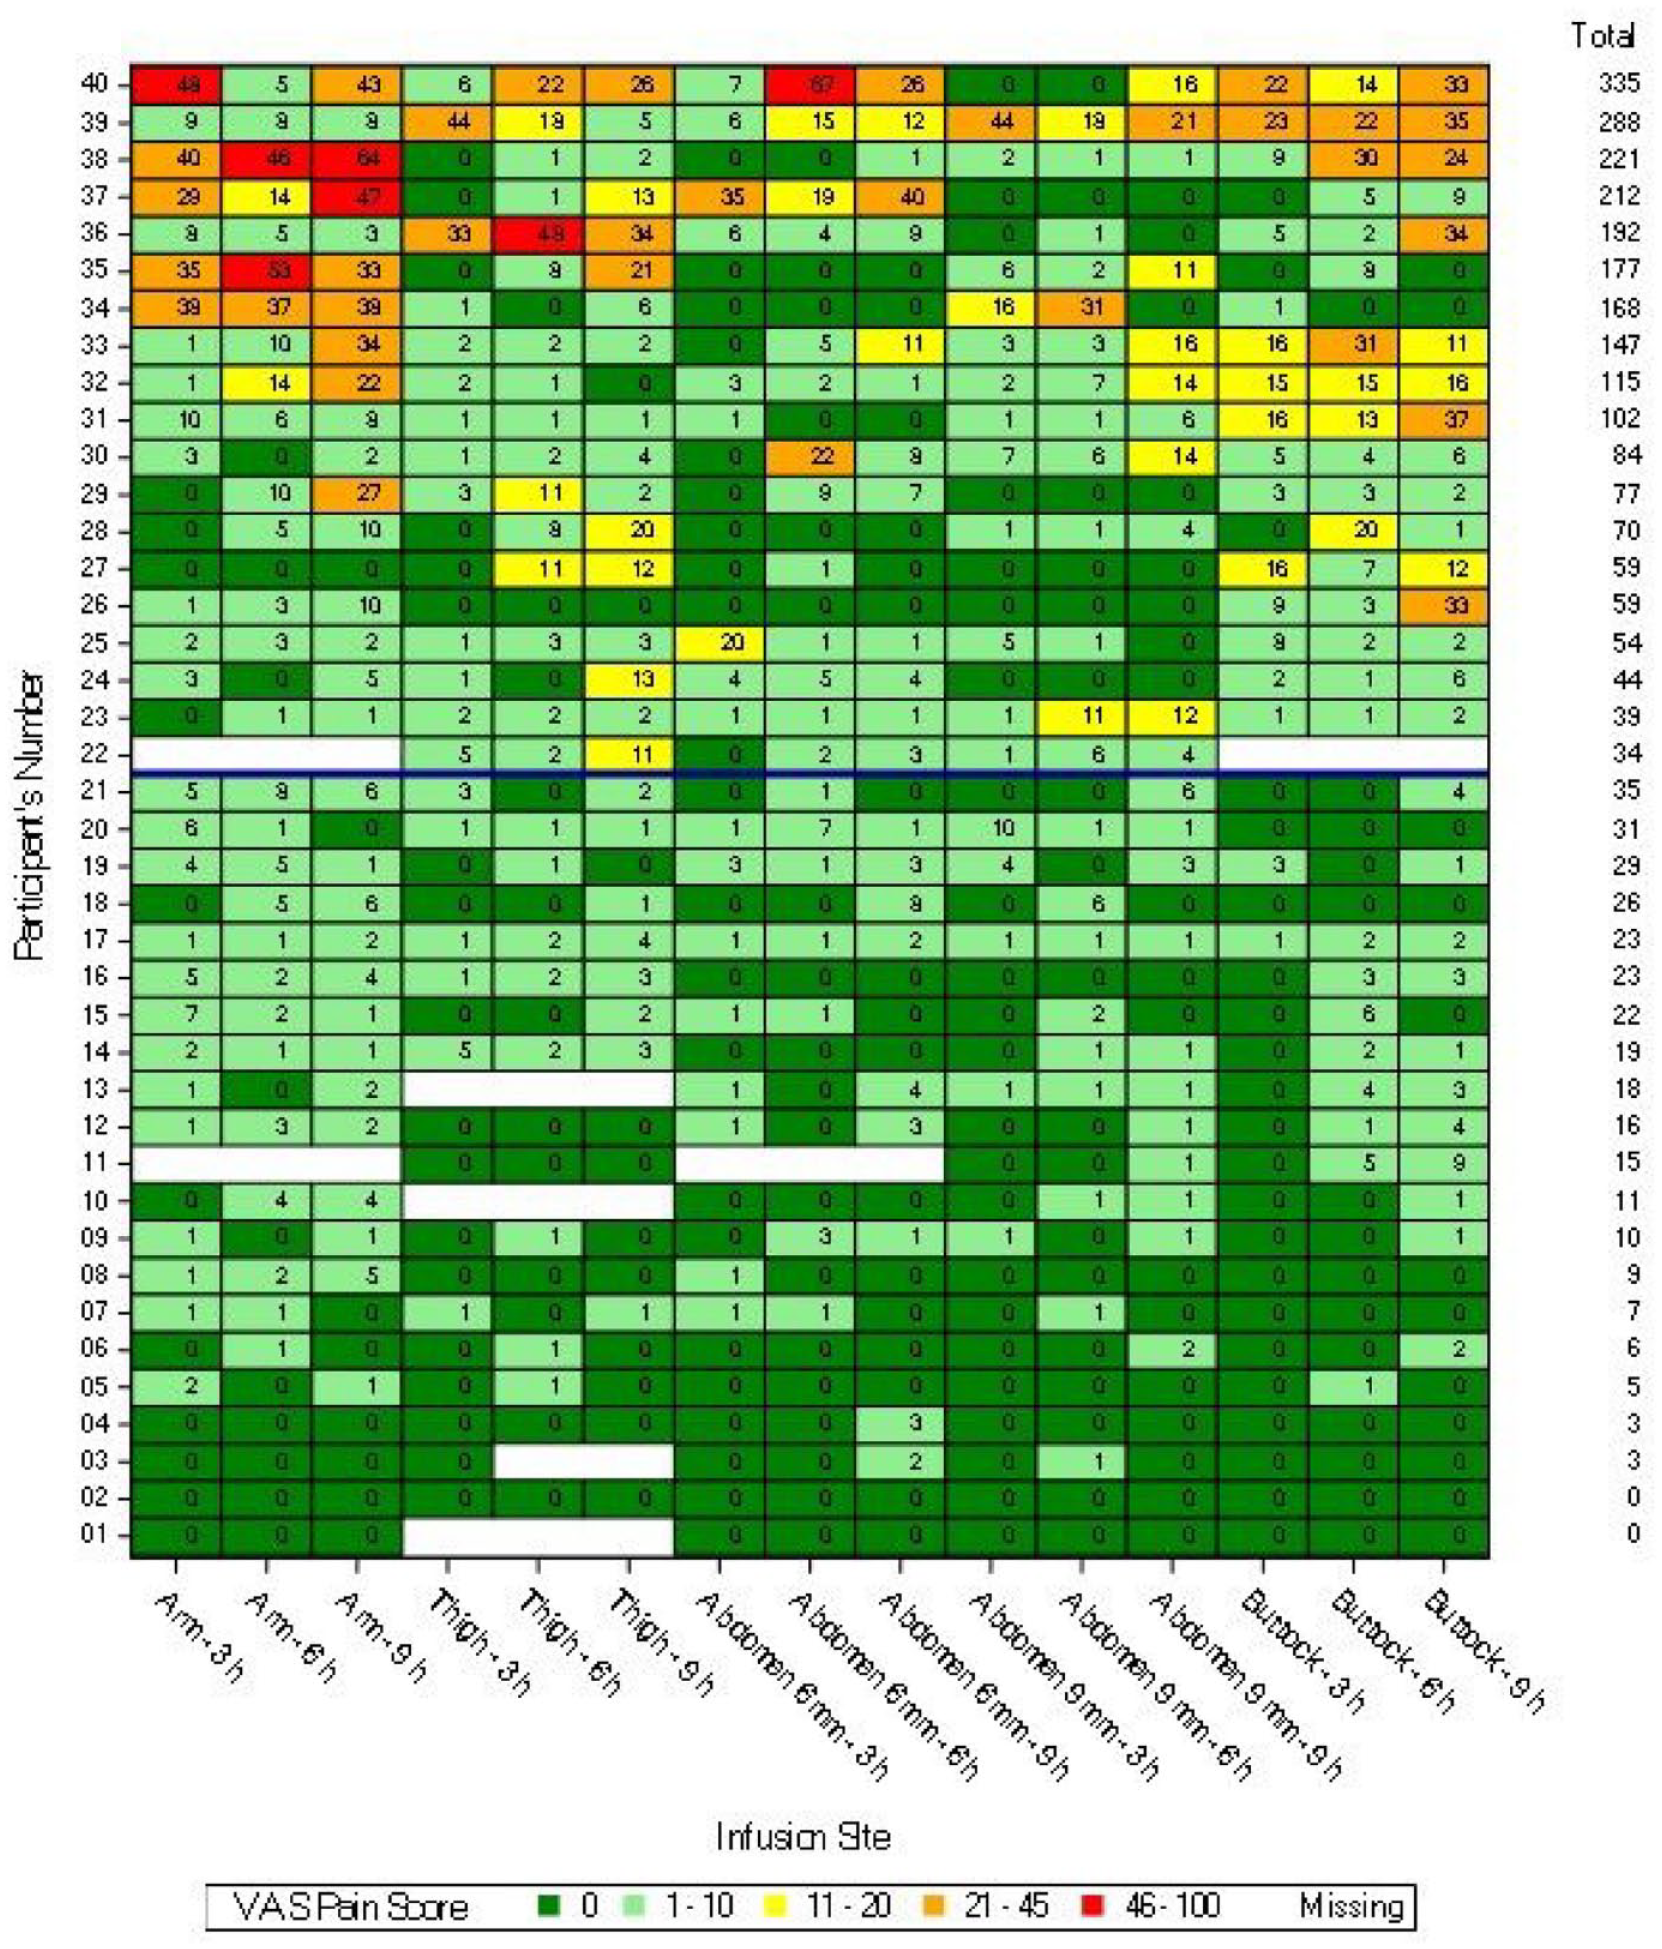
VAS scores for each participant at one minute post-bolus after 150 μL bolus infusions of URLi excipients, sodium citrate, treprostinil, and magnesium chloride in Humalog diluent (without insulin). The VAS scores for each infusion site and each bolus time are shown. Abbreviations: VAS, visual analog scale; URLi, ultra rapid lispro.
Analysis of VAS Scores by Infusion Site
There were no significant differences in mean VAS scores between site of infusion at 5 minutes pre-bolus or 15 minutes post-bolus at any bolus time. At one minute post-bolus, there were significantly higher VAS scores at the arm compared with the thigh and abdomen at all bolus times (Table 1). There were significantly higher VAS scores at the buttock compared with the abdomen at six and nine hours bolus times. The arm was the only infusion site where more than one VAS score >45 mm was reported. There were no significant differences in VAS scores between 6 and 9 mm infusion depths (Table 1).
Statistical Analysis of Geometric Mean VAS Scores at One Minute Post-Bolus Between Infusion Sites.
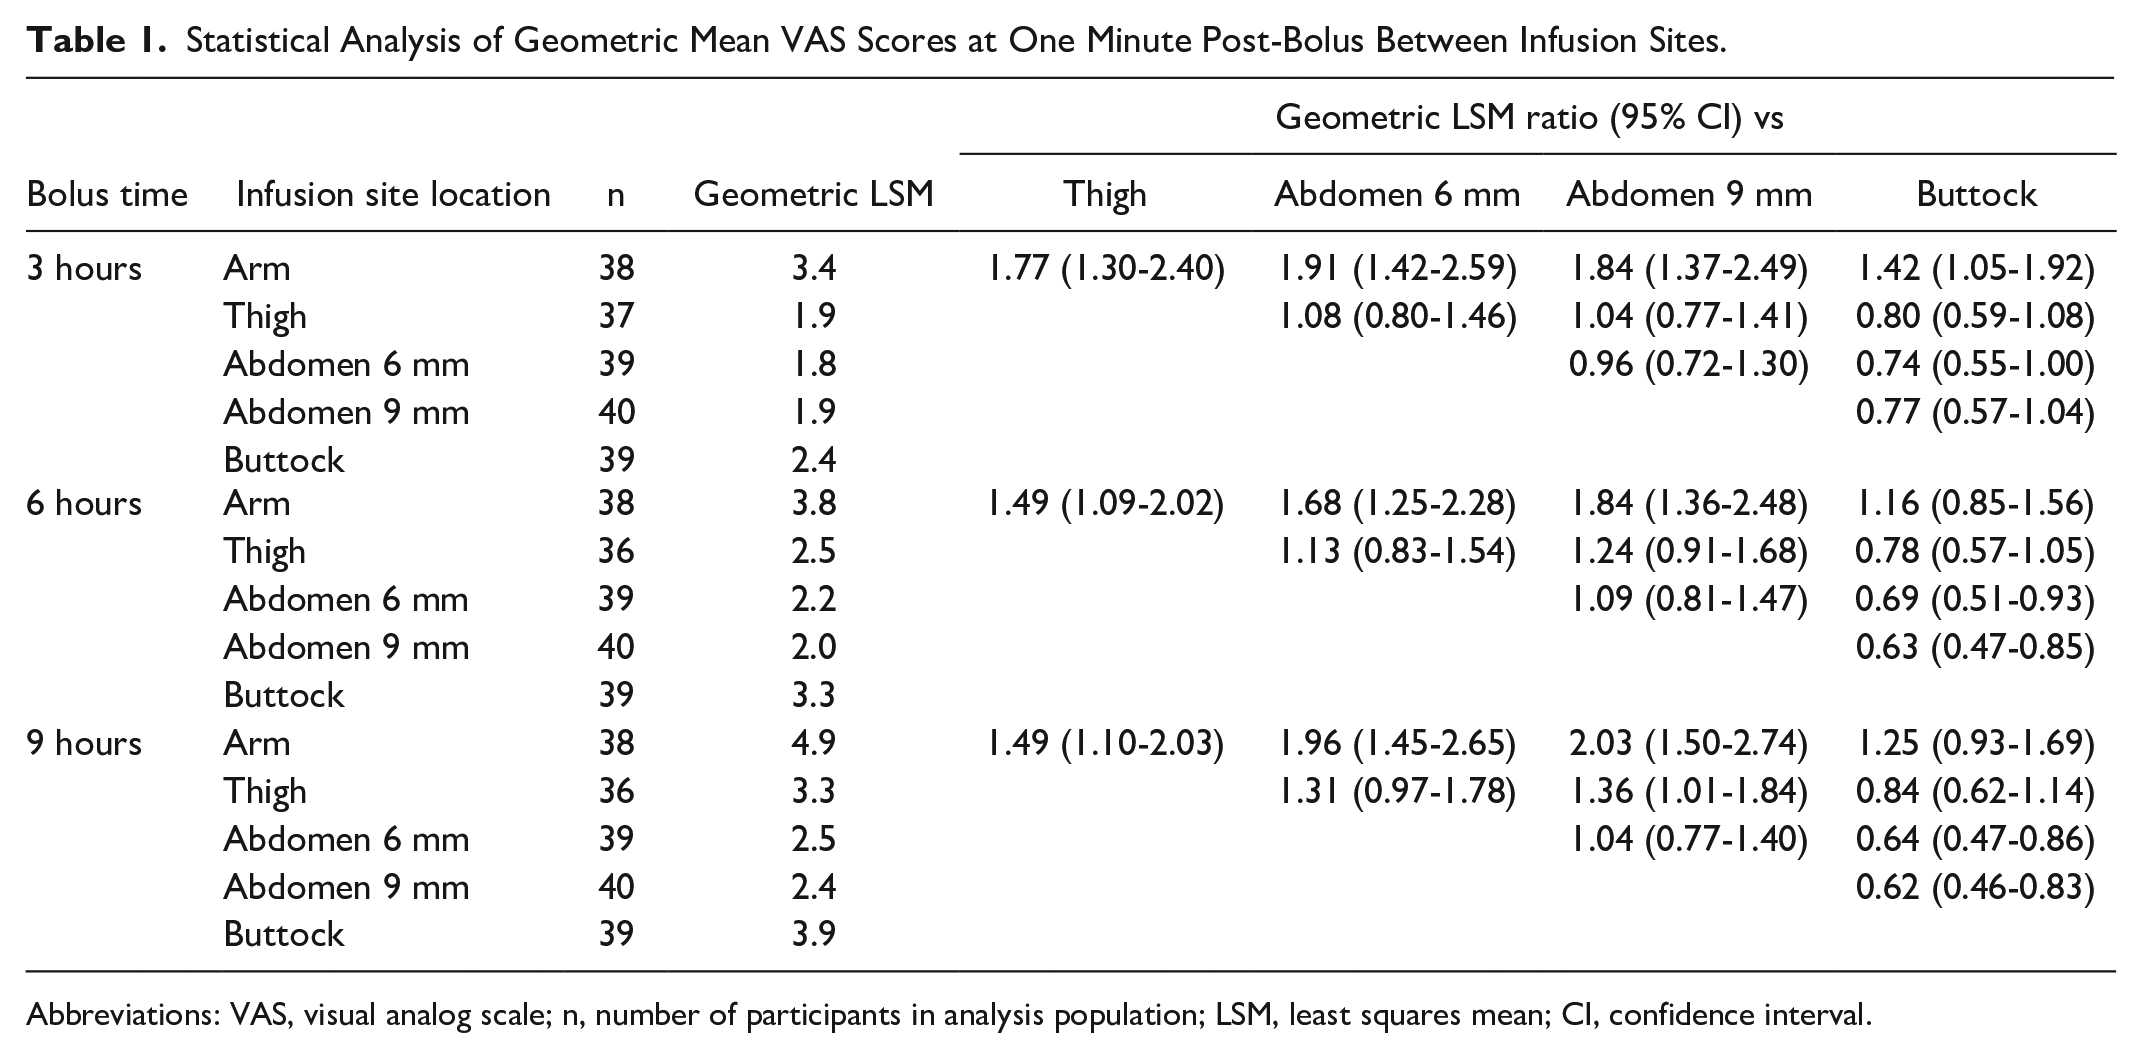
Abbreviations: VAS, visual analog scale; n, number of participants in analysis population; LSM, least squares mean; CI, confidence interval.
Analysis of VAS Scores by Bolus Time
For all infusion sites, there were no statistically significant differences in mean VAS scores between three and six hours or six and nine hours bolus times at one minute post-bolus (Table 2). There were significantly lower VAS scores at three hours bolus time compared with nine hours at one minute post-bolus at all infusion sites except the abdomen 9 mm (Table 2). There were no significant differences in VAS scores between three, six, or nine hours bolus times at 5 minutes pre-bolus or 15 minutes post-bolus.
Statistical Analysis of Geometric Mean VAS Scores at One Minute Post-Bolus Between Bolus Times.
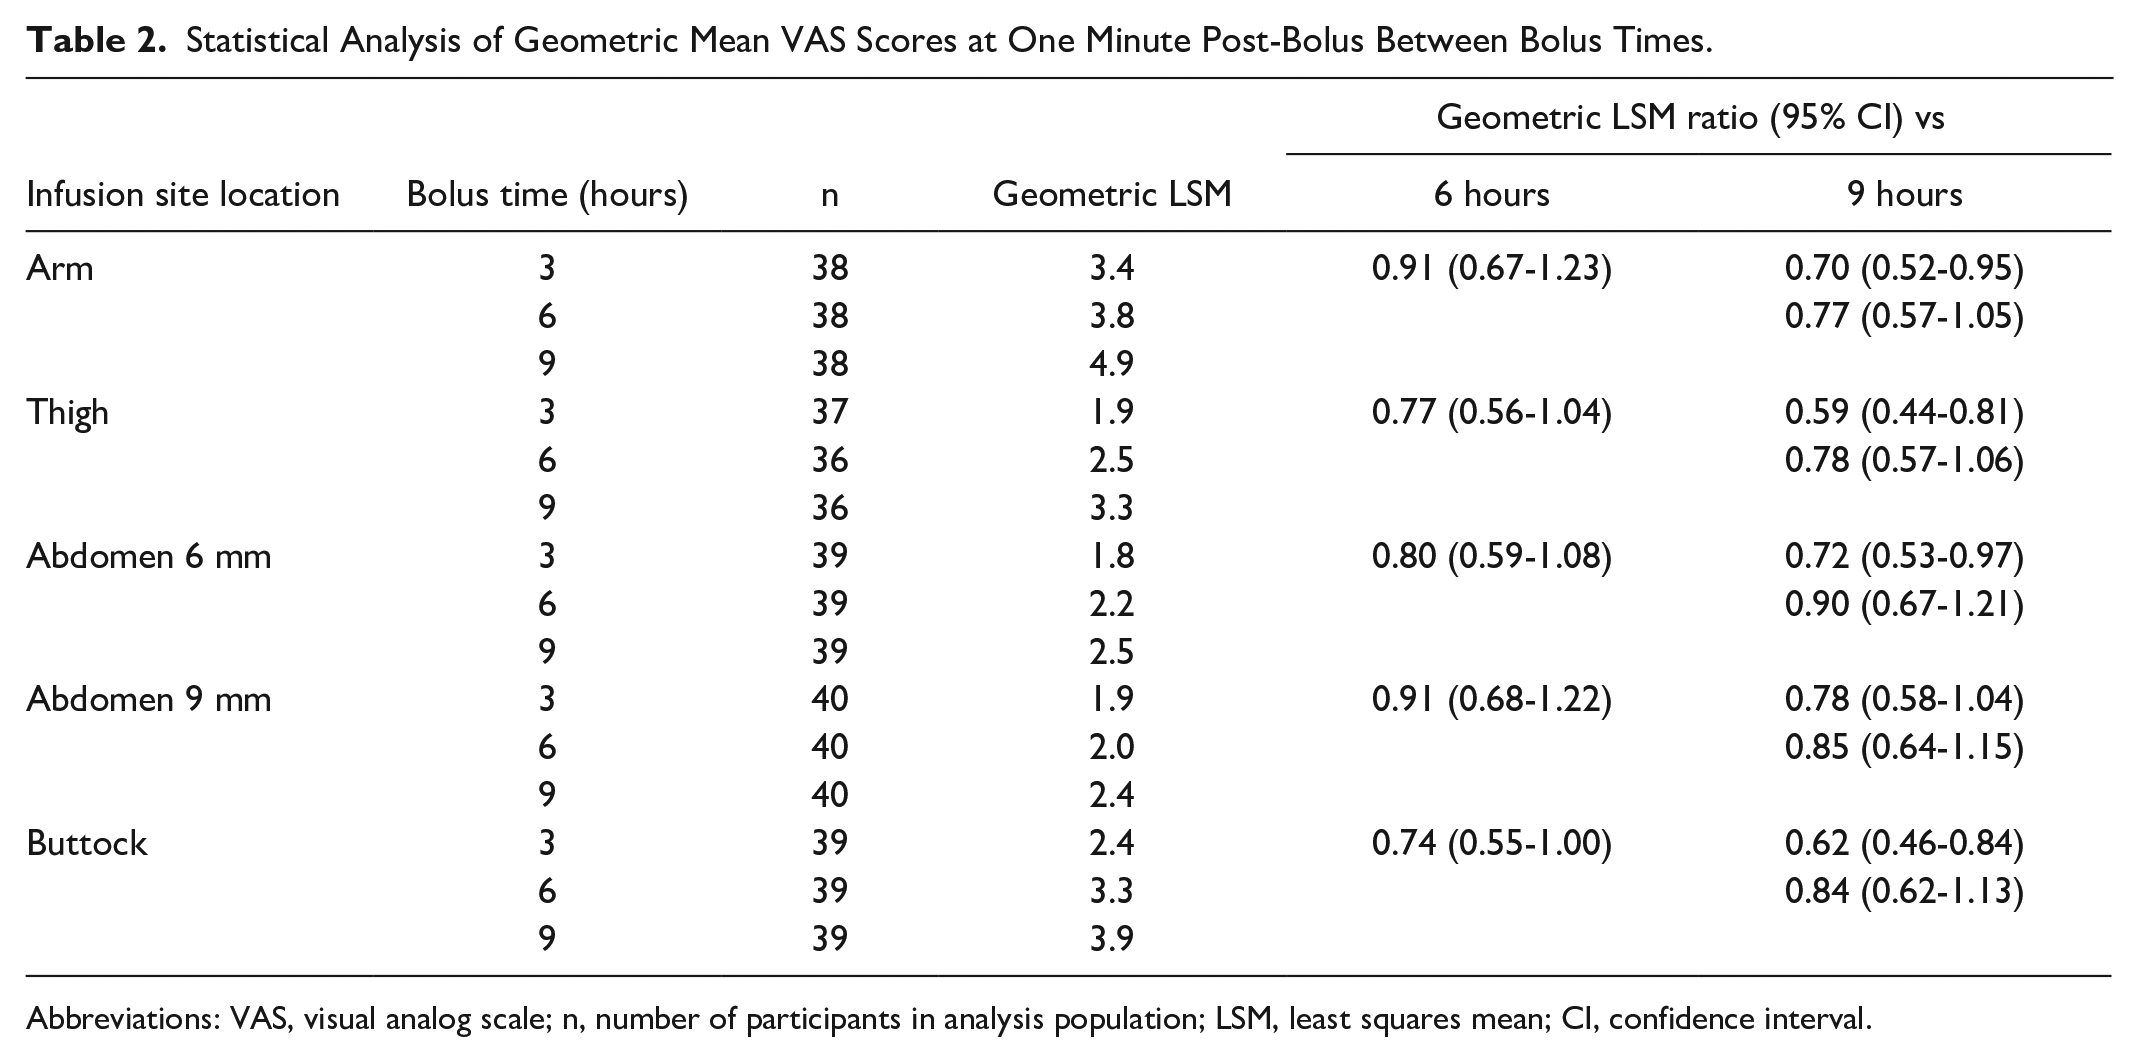
Abbreviations: VAS, visual analog scale; n, number of participants in analysis population; LSM, least squares mean; CI, confidence interval.
VAS Scores Versus Thickness of Subcutaneous Adipose Tissue Layer
The VAS scores at one minute post-bolus versus the ultrasound measured thickness of the subcutaneous adipose tissue layer by infusion site for all bolus times are shown in Figure 4. Across all infusion sites and depths, there was no correlation between adipose tissue thickness and VAS score.
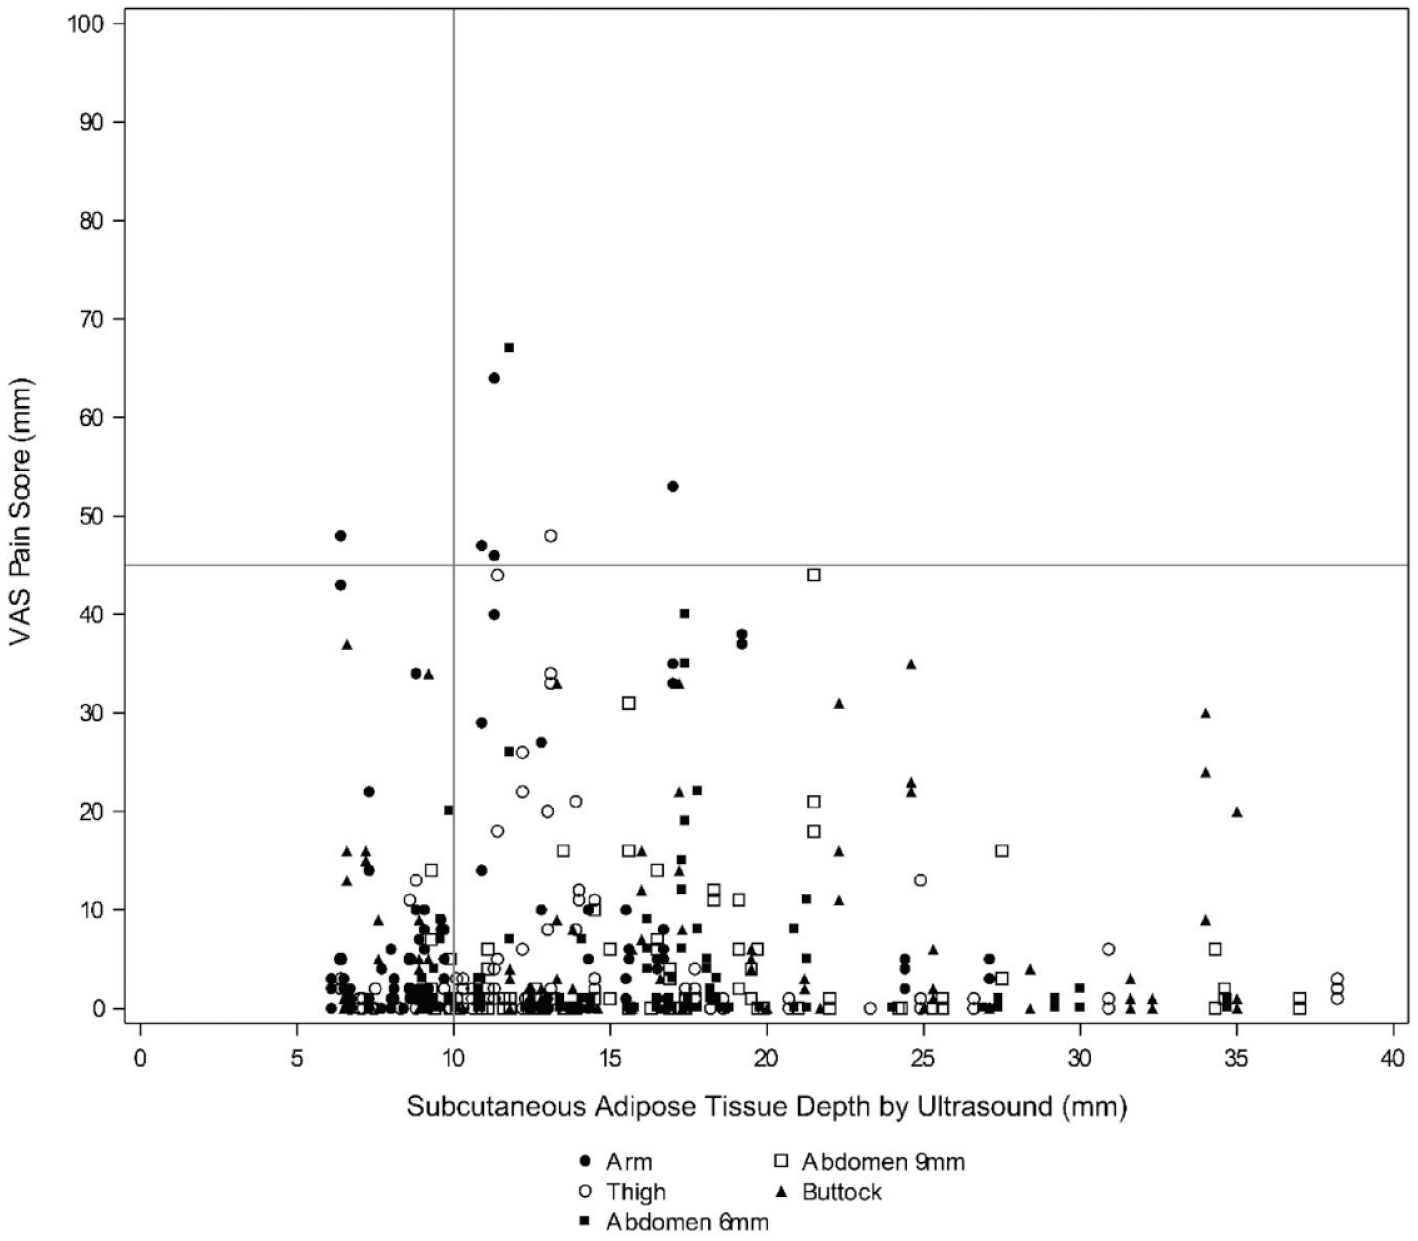
Scatterplot of VAS scores for each infusion site versus adipose tissue thickness at one minute post-bolus after 150 μL bolus infusions of URLi excipients, sodium citrate, treprostinil, and magnesium chloride in Humalog diluent (without insulin). Scores across three, six, and nine hours bolus times are shown. Abbreviations: VAS, visual analog scale; URLi, ultra rapid lispro.
Safety
Overall, 28 TEAEs were reported by 18 (45.0%) participants during this study (Table 3). Of these 28 events, 27 were mild and 1 was moderate. There were no SAEs, deaths, or study discontinuations. Incidence of TEAE was similar between infusion sites, although slightly higher at the thigh compared with other infusions sites (Table 3). Most TEAEs were attributed to ISRs (25 events, all mild).
Summary of Adverse Events.
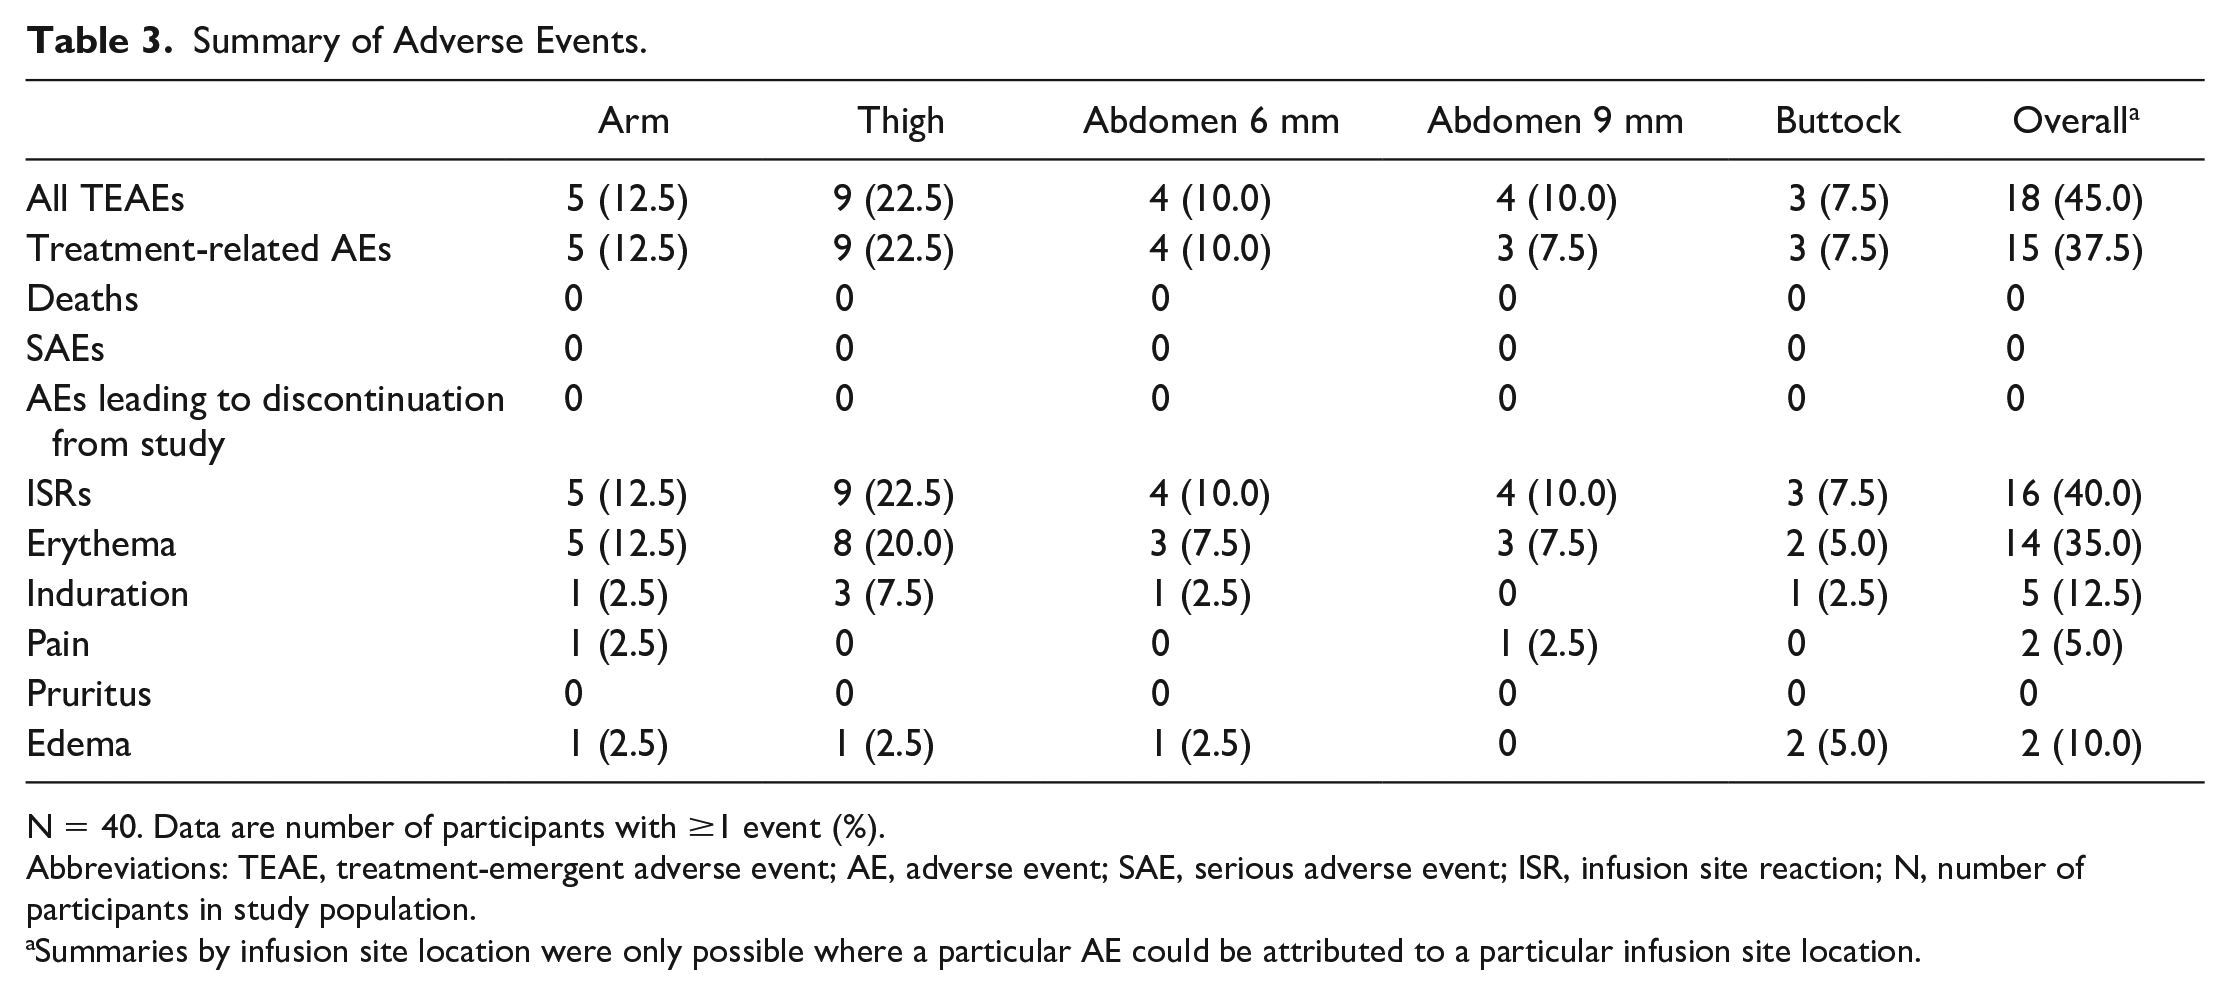
N = 40. Data are number of participants with ≥1 event (%).
Abbreviations: TEAE, treatment-emergent adverse event; AE, adverse event; SAE, serious adverse event; ISR, infusion site reaction; N, number of participants in study population.
Summaries by infusion site location were only possible where a particular AE could be attributed to a particular infusion site location.
Overall, ISRs were observed in 16 (40.0%) participants (Table 3). All ISRs occurred during administration and the majority were resolved after approximately one to two days. The most frequently reported ISR was erythema, with 14 (35.0%) participants reporting ≥1 event. The highest incidence of erythema was at the thigh.
Discussion
In this study, we evaluated pain perception of people with T1D following bolus infusion of the URLi excipients, citrate, treprostinil, and magnesium chloride in Humalog diluent (without insulin) at different infusion sites and depths. Across all sites and depths, there was a statistically significant increase in mean VAS scores at one minute post-bolus compared with pre-bolus levels; however, the absolute increase was small and most scores reported were 0 mm or 1-10 mm. Local infusion site discomfort was transient as by 15 minutes post-bolus, VAS scores had returned to their pre-bolus levels.
The VAS is a well-validated tool for measuring pain perception and is commonly used where there is a need for patients to communicate their pain experience. 22 The VAS has been used in evaluating various factors influencing injection site pain in people with diabetes including injection site, speed, and volume.10,11 We recognize that the foreign body response affects infusion therapy, and therefore, the perception of pain may be different for insulin injection versus infusion. There are also challenges translating specific VAS scores to pain labels; however, one study reanalyzing two clinical trials of postoperative pain found scores of 0 to 4 mm could be considered no pain; 5 to 44 mm, mild pain; 45 to 74 mm, moderate pain; and 75 to 100 mm as severe pain. 23 In the present study, we used prespecified categories of 0, 1 to 10, 11 to 20, 21 to 45, and 46 to 100 mm, which are generally aligned with above but further breakdown the lower end of the scale to best elucidate differences in patient discomfort/pain levels following bolus infusion. We assigned pain ratings to VAS score categories as follows: 0 mm, no pain; 0 to 10 mm, little to no discomfort; 46 to 100 mm, painful. Categories of 11 to 20 and 21 to 45 mm are both in the “mild pain” range based on previous precedent, and we did not further distinguish between the two categories.
Despite the statistically significant increase in mean VAS scores at one minute post-bolus compared with pre-bolus levels, mean VAS scores remained below 5 mm (Figure 1) and most VAS scores at one minute post-bolus were 0 or 1-10 mm (500/577, 87%) (Figure 2). This indicates most participants experienced little to no discomfort following bolus infusions. There were only seven VAS scores >45 mm reported (1.2%), considered clinically meaningful pain, and no scores over ≥75 mm, considered severe pain. The presence of higher VAS score was driven by a few individuals with more than half of participants (21 out of 40) having no scores >10 mm (Figure 3). Higher VAS scores were not driven by subcutaneous adipose tissue thickness; there was no correlation between adipose tissue thickness and VAS score (Figure 4). The low overall mean VAS scores and the high proportion of VAS scores ≤10 mm suggests most people did not experience any clinically meaningful pain during bolus infusions. For the subset of participants who did experience discomfort, it was transient with VAS scores returning to pre-bolus levels by 15 minutes post-bolus.
Although overall, most VAS scores were low, there were significantly higher mean 1 minute post-bolus VAS scores at the arm compared with the thigh and abdomen at all bolus times (Table 1). The arm also had the most VAS scores >45 mm (Figure 2). The buttock had significantly higher mean one minute post-bolus VAS scores compared with the abdomen at six and nine hours bolus times but no differences compared with the arm or thigh (Table 1). Based on these results, patients may consider switching to a different infusion site if they experience discomfort. There was no significant difference in mean VAS score between infusion depths (Table 1), and the frequency distribution of VAS scores by category was similar (Figure 2).
At one minute post-bolus, there were no statistically significant differences in mean VAS scores between bolus times of three and six hours or between six and nine hours; however, VAS scores were significantly lower at three hours compared with nine hours at all infusion sites except the abdomen 9 mm (Table 3). There were no differences between bolus times for 5 minutes pre-bolus or 15 minutes post-bolus VAS scores.
Most AEs reported during the study were mild in severity (27 mild, 1 moderate, 0 severe), and there were no SAEs or discontinuations from the study. The incidence of TEAEs was slightly higher at the thigh but otherwise similar between infusion sites and depths (Table 3). Most TEAEs were attributed to ISRs (25 events, all mild), and most ISRs resolved after approximately one to two days. The most frequently observed ISR was erythema, most of which were “barely noticeable (<25 mm diameter)” in size and “noticeable but very mild redness” in severity.
Strengths of this study were that each participant received three bolus infusions at each infusion site at three, six, and nine hours post-basal infusion initiation allowing multiple scores to be evaluated at each infusion site for each participant. Infusions were all conducted on the same day, eliminating any potential for interday variations in pain perception. We used URLi excipients, citrate and treprostinil, in diluent with magnesium chloride at a clinically relevant equivalent dose (15 U equivalent; 150 μL) therefore mimicking the real-life use of URLi by people with diabetes on CSII. Limitations include that the participants had to wear five infusion sets for nine hours, which may have contributed to discomfort during the study; the duration of the study (nine hours) was shorter than typical wear times for infusion sets, which might suggest value in carrying out a longer study; the formulation used in this study did not contain insulin and so the possibility of this affecting discomfort cannot be ruled out; and although a valuable measure of pain perception, the VAS cannot capture the complete patient experience.
Conclusions
In participants with T1D, following infusion of sodium citrate and treprostinil in diluent with magnesium chloride (without insulin), local infusion site discomfort was reported by a small number of participants. Any discomfort was transient, tolerable, and dependent on infusion site but not on infusion depth.
Compared with pre-bolus, statistically higher mean VAS scores were observed at 1 minute post-bolus; however, most VAS scores were 0 or 1-10 mm, on a scale of 0-100 mm, and by 15 minutes post-bolus, VAS scores had returned to their pre-bolus levels. Only 1.2% of bolus infusions were reported as painful (VAS score >45 mm) at one minute post-bolus, most of which were at the arm. Given differences among infusion sites within individuals, as with any subcutaneously infused insulin, patients may consider changing to a different infusion site if they experience discomfort.
Footnotes
Acknowledgements
The authors would like to thank all study participants. The authors also thank Alastair W Knights, PhD (Eli Lilly and Company) for medical writing and editorial assistance.
Abbreviations
AE, adverse event; BMI, body mass index; CI, confidence interval; CSII, continuous subcutaneous insulin infusion; ISR, infusion site reaction; LSM, least squares mean; MDI, multiple daily injection; PPG, postprandial glucose; SAE, serious adverse event; SD, standard deviation; TEAE, treatment-emergent adverse event; T1D, type 1 diabetes; U, unit; URLi, ultra rapid lispro; VAS, visual analog scale.
Author Contributions
All authors participated in the drafting and critical revision of the manuscript and provided approval of the final version of the manuscript to be published. DI and CP were involved in study conception. DI, TF, ME, MSS, EZ, and CP were involved in study design. ME, EZ, and MSS were involved in data collection. DI, TF, RB, and CP conducted data analysis and RB conducted the statistical analysis. All authors were involved in the interpretation of the study results.
Declaration of Conflicting Interests
The author(s) declared the following potential conflicts of interest with respect to the research, authorship, and/or publication of this article: DI, TF, RB, and CP are employees and shareholders of Eli Lilly and Company. MSS and EZ are employees of Profil. ME was an employee at Profil at the time the study was conducted and is currently employed at Boehringer Ingelheim.
Funding
The author(s) disclosed receipt of the following financial support for the research, authorship, and/or publication of this article: This study was sponsored by Eli Lilly and Company.
Prior Presentation
Parts of this study were presented in abstract form at the 82nd Annual Scientific Sessions of the American Diabetes Association held June 3-7, 2022, in New Orleans, LA, and as an encore at the Association of Diabetes Care & Education Specialists, 2022 Annual Conference, held August 12–15, 2022, in Baltimore, MD.
Data Availability Statement
Eli Lilly and Company provides access to all individual participant data collected during the trial, after anonymization, with the exception of pharmacokinetic or genetic data. Data are available to request six months after the indication studied has been approved in the United States and European Union and after primary publication acceptance, whichever is later. No expiration date of data requests is currently set once data are made available. Access is provided after a proposal has been approved by an independent review committee identified for this purpose and after receipt of a signed data sharing agreement. Data and documents, including the study protocol, statistical analysis plan, clinical study report, blank or annotated case report forms, will be provided in a secure data sharing environment. For details on submitting a request, see the instructions provided at ![]() .
.