
Abstract
Background:
The use of machine learning and deep learning techniques in the research on diabetes has garnered attention in recent times. Nonetheless, few studies offer a thorough picture of the knowledge generation landscape in this field. To address this, a bibliometric analysis of scientific articles published from 2000 to 2022 was conducted to discover global research trends and networks and to emphasize the most prominent countries, institutions, journals, articles, and key topics in this domain.
Methods:
The Scopus database was used to identify and retrieve high-quality scientific documents. The results were classified into categories of detection (covering diagnosis, screening, identification, segmentation, among others), prediction (prognosis, forecasting, estimation), and management (treatment, control, monitoring, education, telemedicine integration). Biblioshiny and RStudio were used to analyze the data.
Results:
A total of 1773 articles were collected and analyzed. The number of publications and citations increased substantially since 2012, with a notable increase in the last 3 years. Of the 3 categories considered, detection was the most dominant, followed by prediction and management. Around 53.2% of the total journals started disseminating articles on this subject in 2020. China, India, and the United States were the most productive countries. Although no evidence of outstanding leadership by specific authors was found, the University of California emerged as the most influential institution for the development of scientific production.
Conclusion:
This is an evolving field that has experienced a rapid increase in productivity, especially over the last years with exponential growth. This trend is expected to continue in the coming years.
Introduction
In recent years, there has been a significant increase in the global prevalence of diabetes. According to the latest edition of the Diabetes Atlas 1 published by the International Diabetes Association (IDF), there were 537 million adults (aged 20-79 years) living with diabetes worldwide in 2021. It is estimated that this number will increase by 46% by 2045.
Diabetes management involves the development and use of technological advancements aimed at aiding patients and clinical decision-making processes. One such advancement is the integration of diabetes technology with artificial intelligence (AI) methods, which has demonstrated promising results in the prevention, detection, and treatment of diabetes.2-5 These AI-driven approaches use computational algorithms to analyze complex data sets, identify patterns, and develop predictive models that can contribute to early diagnosis, personalized treatment, and effective management strategies for people with diabetes.6-8 Over time, AI-based tools have also been used to enhance aspects of diabetes education, such as prediction, dietary and exercise guidance, carbohydrate counting, insulin dose guidance, monitoring of complications, and self-control. 9 These advancements highlight the potential of AI to revolutionize the approach to diagnosing, treating, and educating individuals about this disease.
A growing body of research employing AI methods can be found in the literature in various domains of diabetes research. Reviews and bibliometric analyses have been conducted, focusing on areas such as diabetes management,10,11 diabetes prediction,12,13 prediction of diabetes complications,8,14 and kidney disease,15,16 among others.17,18 A considerable number of articles have been dedicated to the application of ML techniques in the detection of eye disease-related complications.19-22 However, a comprehensive bibliometric analysis encompassing the use of AI techniques in various aspects of diabetes research, including detection, prediction, and management, has been notably absent from the literature until now. Addressing this gap in the literature through a bibliometric review is crucial for anyone interested in identifying the most promising research areas, trends, and directions within this rapidly evolving field. Furthermore, bibliometric analysis enables the quantification of publication patterns and citation metrics, providing valuable information of the growth and influence of scientific knowledge. 23
Therefore, the primary goal of this study is to perform a bibliometric analysis of research papers published in the field of machine learning (ML) and deep learning (DL) techniques applied to diabetes research from 2000 to 2022. This involves statistical analysis of published literature to identify global research trends and networks, highlighting key countries, institutions, journals, articles, citations, and research topics. The aim is to provide insights for researchers and other stakeholders involved in knowledge generation to gain a deeper understanding of the current state and evolution of this field.
Methods
A. Search Strategy
Different databases can be used to obtain bibliometric data. Web of Science (WoS) and Scopus are well-established and widely used databases in the fields of technology and health for conducting bibliometric analyses.24,25 In this study, after conducting an initial search using both databases, it was observed that some relevant articles on the subject were not found in the WoS results. This was likely due to the absence of the author’s keywords information in the records associated with these articles. Therefore, Scopus was selected as the preferred database for conducting this bibliometric analysis. Scopus compiles scientific journals, conference proceedings, and international books. A rigorous selection of content and profiling algorithms guarantees that this database only indexes documents of high scientific quality. 26
The search criteria for the bibliometric analysis included terms such as “diabetes” and all its conjugations, and words associated with AI. These words were searched for in the title, abstract, and keywords. Moreover, to refine the search scope, the most employed ML and DL techniques were identified based on Huang et al. 8 These techniques were examined using the authors’ keywords. The search was restricted to English articles and reviews published between 2000 and 2022. As a result, 1773 documents were obtained.
Most of the documents retrieved correspond to articles (90.87%), and the rest to reviews. The publications come from 661 different journal sources. The search and selection criteria for the bibliometric analysis are illustrated in Figure 1, which also provides a concise summary of the descriptive and network analyses.
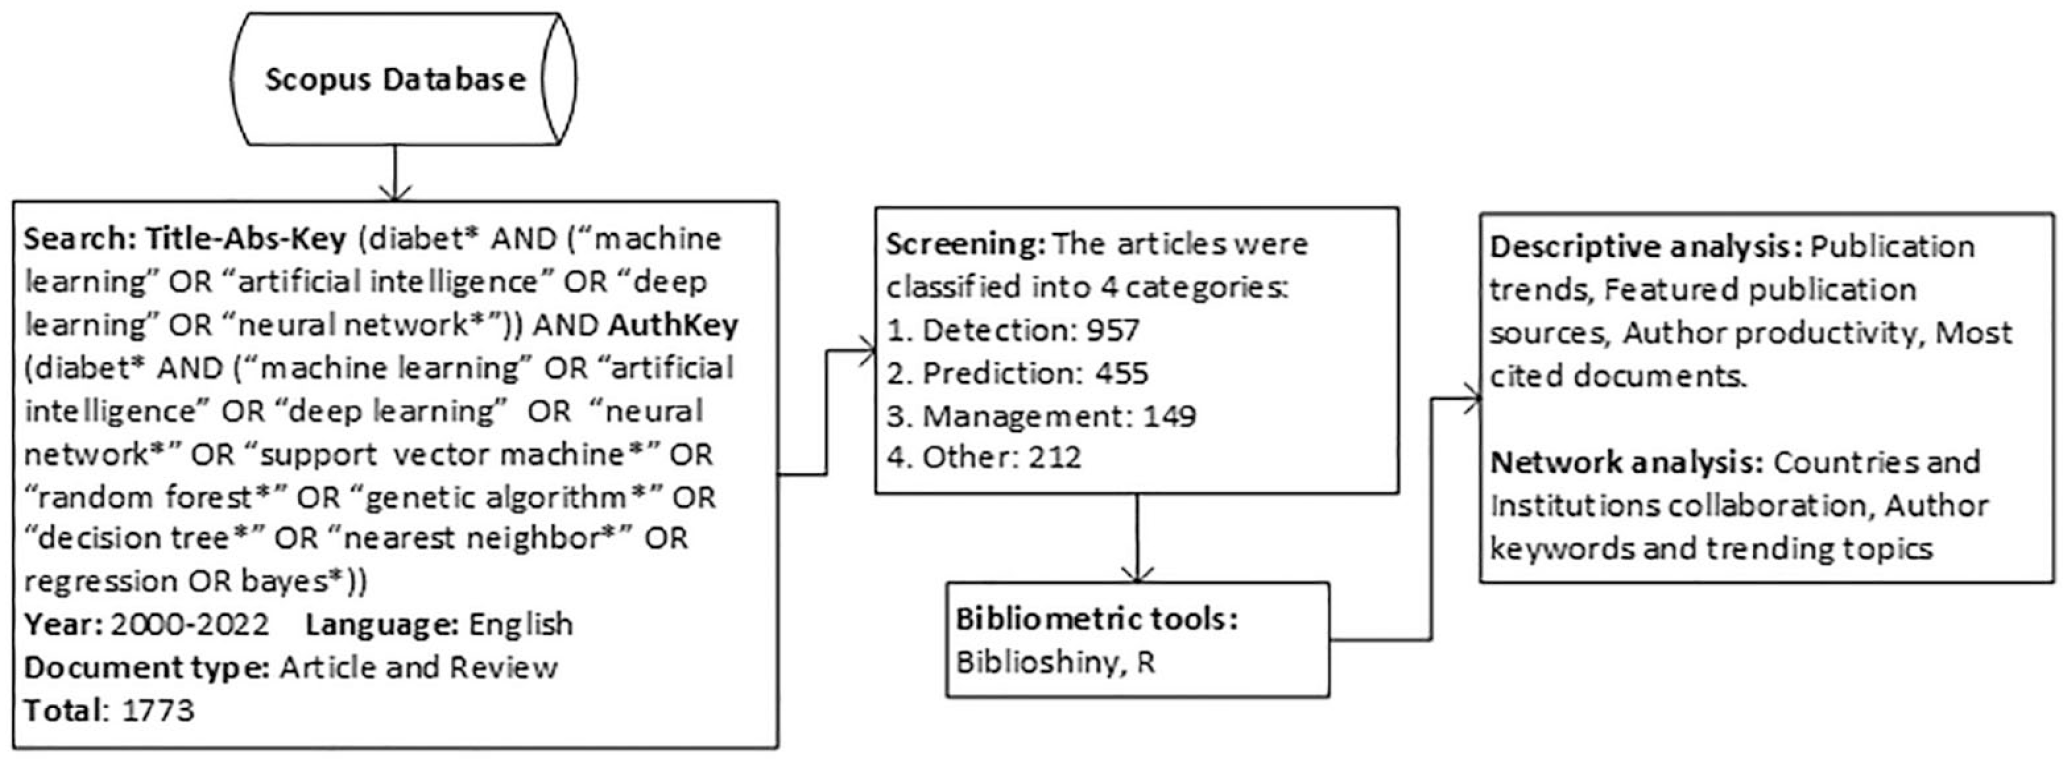
Flowchart of the methodology used for the search, screening, and bibliometric analysis.
B. Screening Strategy
As a result of a thorough examination of several search strings, the most relevant one was carefully selected; therefore, no articles needed to be removed from the data set. In addition, a comprehensive check was performed, and no duplicate articles were found. One adjustment made to the data set involved reclassifying articles that were initially published online in 2022 but had a publication date listed as 2023.
In this study, 3 main categories were considered to better structure the bibliometric analysis: detection, prediction, and management. Similar categories have been used in other studies analyzing the main AI contributions in specific health topics.11,27-29 This categorization seeks to organize the database based on the main purpose addressed in each article.
The detection category encompassed articles bearing fundamental objectives such as detection, early detection, diagnosis, screening, classification, risk grading, severity assessment, segmentation, discrimination, stratification, identification, and quantification. The Prediction category incorporated articles with primarily goals including prediction, prognosis, forecasting, and estimation. Ultimately, the Management category comprised articles focusing on management, treatment, control, education, monitoring, and the integration of telemedicine strategies. Articles that did not meet the criteria for these 3 categories were classified as “Others.” Manual classification of the 1773 articles was performed based on the information presented within the titles and abstracts. The Detection category amassed the highest number of articles (957), followed by the Prediction category (455), and the Management category (149). The Others category (212 articles) encompassed most review articles and instances of ML and DL applications in various health domains. These articles did not primarily focus on diabetes but used diabetes data/cohorts in their research. Therefore, we retained this category in the bibliometric analysis to obtain a comprehensive understanding of the overall publication landscape.
C. Bibliometric Analysis
A bibliometric analysis was conducted on 1773 articles to provide insight into the research landscape of ML and DL applied to diabetes. This analysis comprised both descriptive and network components. The descriptive analysis focused on several aspects, including publication trends, the main sources of publications, author productivity, and an examination of the most frequently cited documents. The network analysis identified the prominent countries and institutions in this field and explored co-occurrence patterns among author keywords.
The growth rate of publications was calculated as follows:
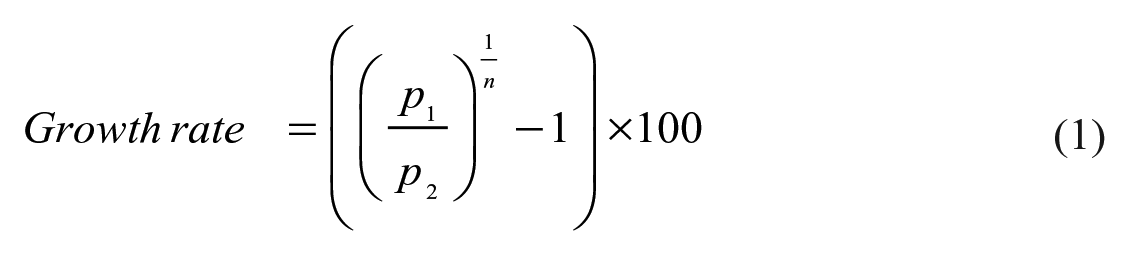
where p1 corresponds to the number of publications in the last year, p2 is the number of publications in the first year, and n is the number of years. 22
Network analysis was used to examine the scientific, social, intellectual, and conceptual structures of scientific production in the field of interest. 30 Networks exhibit the research constituents or objects (e.g., authors, institutions, countries) and their relationships as an interconnected system in which the vertices (nodes) represent the objects and the edges (links) draw the relationships between them. In network analysis, the centrality metrics of the vertices (e.g., weighted degree, betweenness, closeness, and PageRank) are computed to provide empirical evidence of their relative importance in the network. 24
The weighted degree corresponds to the number of edge incidents in the node multiplied by the strength of each link. Betweenness centrality measures the ability of a node to carry information between groups of unconnected nodes. A high betweenness centrality for a node indicates that other nodes are dependent on it to access information. 31 Closeness is a measure of how close nodes are to each other, that is, the ability of nodes to effectively transport information to nearby nodes. Finally, PageRank is an alternative measure of the impact of a node in a network. A high PageRank indicates that a node is of “high quality” or “high domain” in the research. 32
Both descriptive and network analyses were conducted using R version 4.3.1, RStudio 2023.06.1+524, and Biblioshiny. Biblioshiny is a web-based application that provides a user-friendly interface for the Bibliometrix R package. 33 Microsoft Excel was also used for the document categorization and counting tasks.
For network analysis, the Louvain algorithm option was also considered in Biblioshiny to identify disjoint subsets of vertices with distinctive relational patterns.34-36 The associated parameters were set to “number of nodes = 100” (those with the highest normalized degree), “minimum number of edges = 1,” “normalization = association,” “remove isolated nodes = yes,” ‘layout = Auto,” and “repulsion force = 0.1.” Additional details can be found in Aria and Cuccurullo’s study.33,37
Descriptive Analysis
Publication Trends
Studies on ML and DL techniques applied to diabetes research began in the 2000s and have progressively increased from 2012 to 2022, with a substantial increase in the last 3 years (see Figure 2). In 2022, the highest level of publications was obtained, with 575 studies. The annual growth rate of publications on the subject was 33.49% (Equation 1), with an average citation per document of 20.71. The highest peak in the citation frequency per year occurred in 2020, with 7236 citations. After 2020, the annual citation decreased to 2513 in 2022. This drop in citation frequency is due to more recent articles having a shorter exposure time to the public than previous ones.
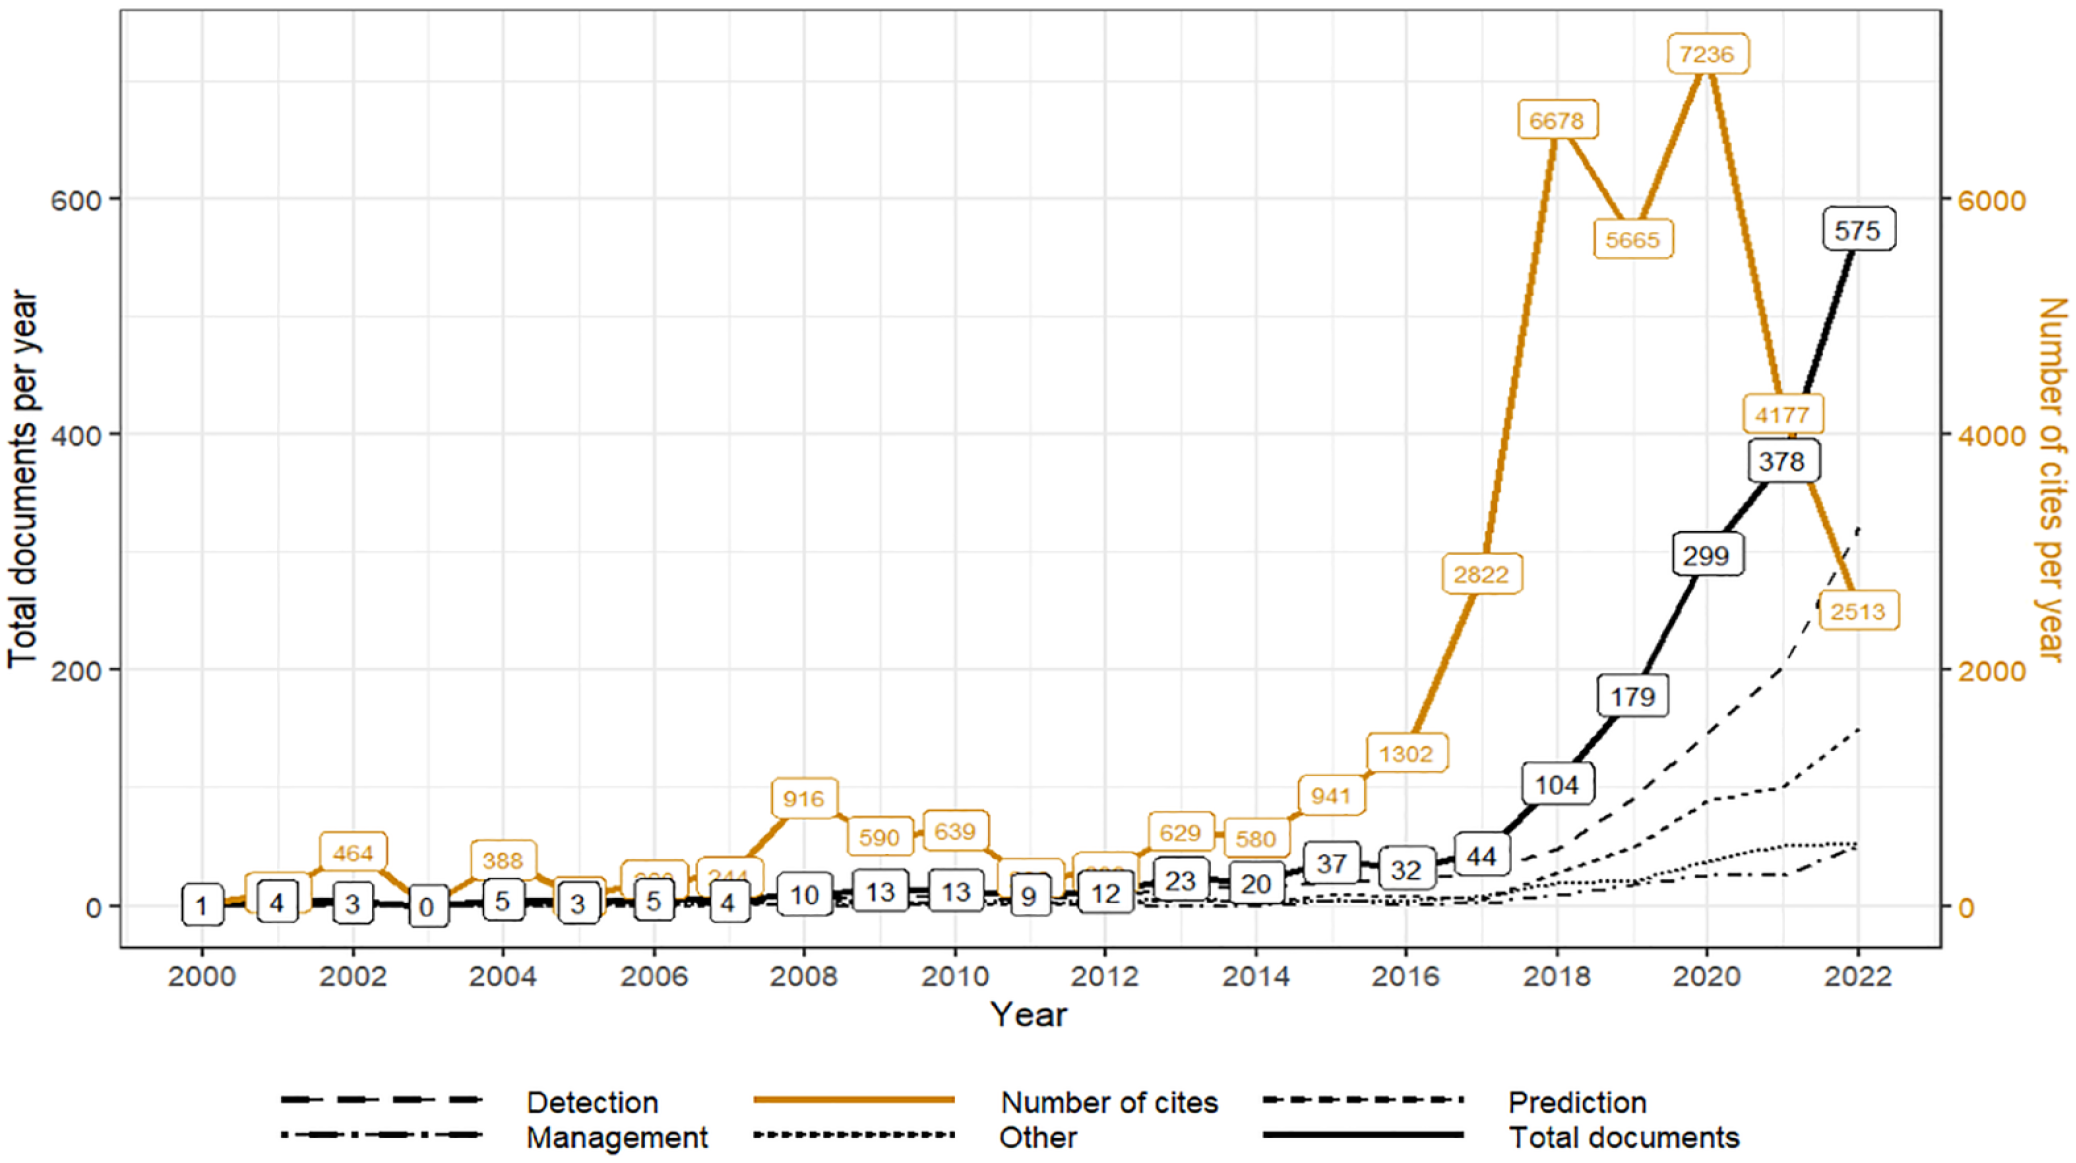
Total number of publications and average citations per year in the field, including productivity over time for detection, prediction, management, and other categories.
When examining the annual production by categories (Figure 2), it is evident that investigations within Detection have increased notably since 2012, while those classified in Prediction, Management, and Others have increased since 2017. The annual growth rate of studies within the Detection category was 30.01% (2000–2022), Prediction 22.83% (2001–2022), Others 21.84% (2002–2022), and Management 16.57% (2001–2022).
Since 2020, there has been an annual publication of more than 80 articles within the Detection and Prediction categories, which are the most active areas of research. Specifically, within the Detection category, there were 147 publications in 2020, 203 in 2021, and 322 in 2022, with average citations per document of 27.33, 12.34, and 4.33, respectively. In the case of Prediction, there were 89, 100, and 150 articles in the last 3 years with 21.26, 10.54, and 4.33 citations on average per document, respectively. Within the Detection category, articles published in 2018 received the highest annual citation count of 4434, whereas for the Prediction category, this milestone occurred in 2020 with 1892 citations.
Featured Research Journals
From 2000 to 2022, 661 journal sources were dedicated to research involving the application of ML and DL techniques in diabetes. Notably, the most influential journals, in terms of the number of published articles, accounted for 17% of the total studies. The top 10 most productive journals in the field are outlined in Table 1. These journals possess impact factors ranging from 1 to 9 and have accumulated total citations spanning 200 to 2000.
Top 10 Most Relevant Journals.
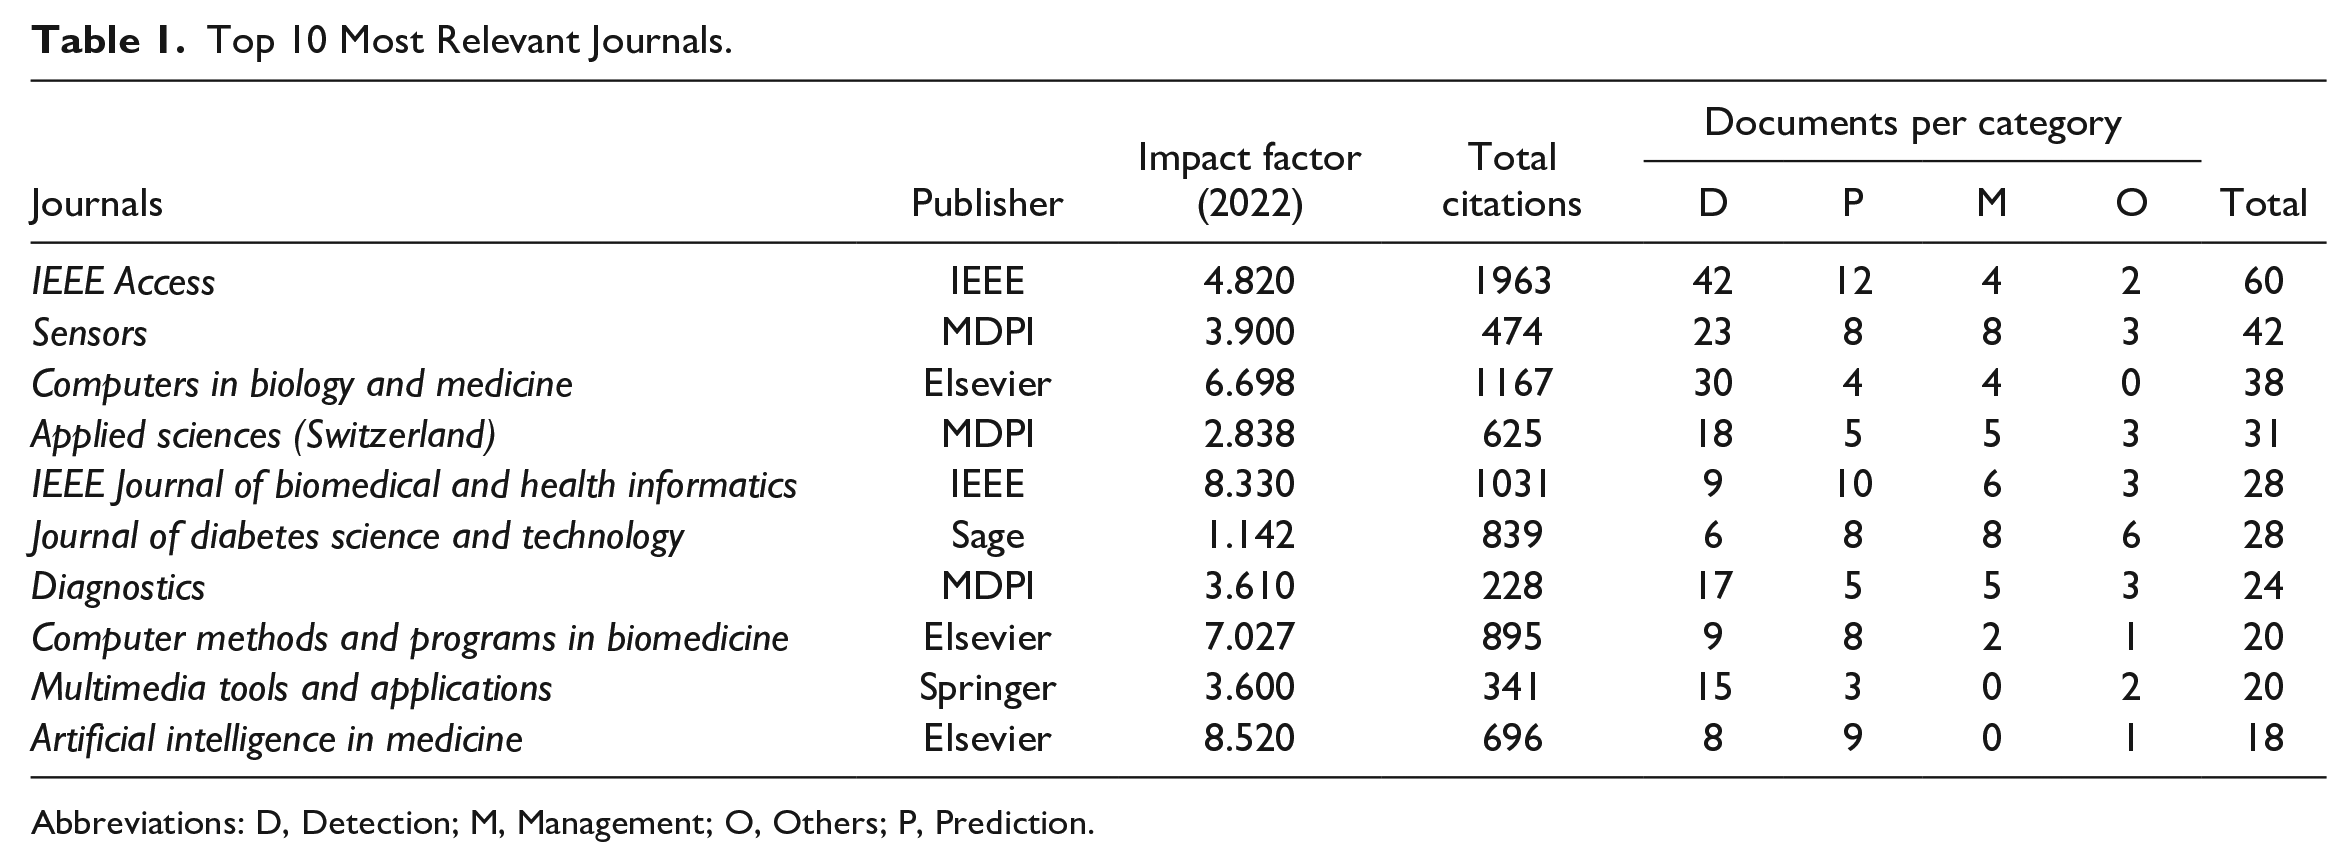
Abbreviations: D, Detection; M, Management; O, Others; P, Prediction.
The number of active journals disseminating scientific knowledge on this subject reveals a notable increase. Between 2000 and 2010, there were only 46 journals; however, from 2011 to 2017, an additional 101 journals emerged. Moreover, over the past 5 years, 443 new research journals have been activated, while 53.2% of the total journals started disseminating articles in 2020 to 2022.
The most relevant journals published the first studies before 2020. For example, IEEE Access first published on the topic in 2018, Sensors in 2009, Computers in Biology and Medicine in 2013, Applied Sciences in 2018, IEEE Journal of Biomedical and Health Informatics in 2014, Journal of Diabetes Science and Technology in 2008, Diagnostics in 2019, Computer Methods and Programs in Biomedicine in 2005, Multimedia Tools and Applications in 2019, and Artificial Intelligence in Medicine in 2008.
Most papers published in IEEE Access (70%), Sensors (54.8%), Computers in Biology and Medicine (78.9%), Applied Sciences (58.1%), Diagnostics (70.8%), and Multimedia Tools and Applications (75%) are related to the Detection category, as indicated in Table 1. Conversely, studies that encompass both the Detection and Prediction categories are prominent in the IEEE Journal of Biomedical and Health Informatics (67.9%), Computer Methods and Programs in Biomedicine (85%), and Artificial Intelligence in Medicine (94.4%). In the Journal of Diabetes Science and Technology, articles related to the Prediction and Management categories predominate (57.1%).
Author Productivity Insights
A total of 6910 authors actively participated in research related to the application of ML and DL techniques in diabetes. The average collaboration cooperation index (i.e., the number of authors per article) is 5.25. It is noteworthy that only 3% of the investigations were attributed to a single author, underscoring the rarity of publications without co-authorship in this field.
Furthermore, within the pool of retrieved authors, there appears to be no distinct leadership pattern. This is likely because the application of ML and DL techniques in diabetes research is a relatively recent and rapidly evolving area of study involving numerous academics from various disciplines. Consequently, the concentration of scientific production within a select group of authors has yet to be observed.
Most Cited Documents
Table 2 presents the top 3 most highly cited articles within each of the Detection, Prediction, and Management categories. This includes the reference, title, purpose, primary ML and DL methods employed, journal, and total citations (TC) for each article.
Most Cited Documents by Category.
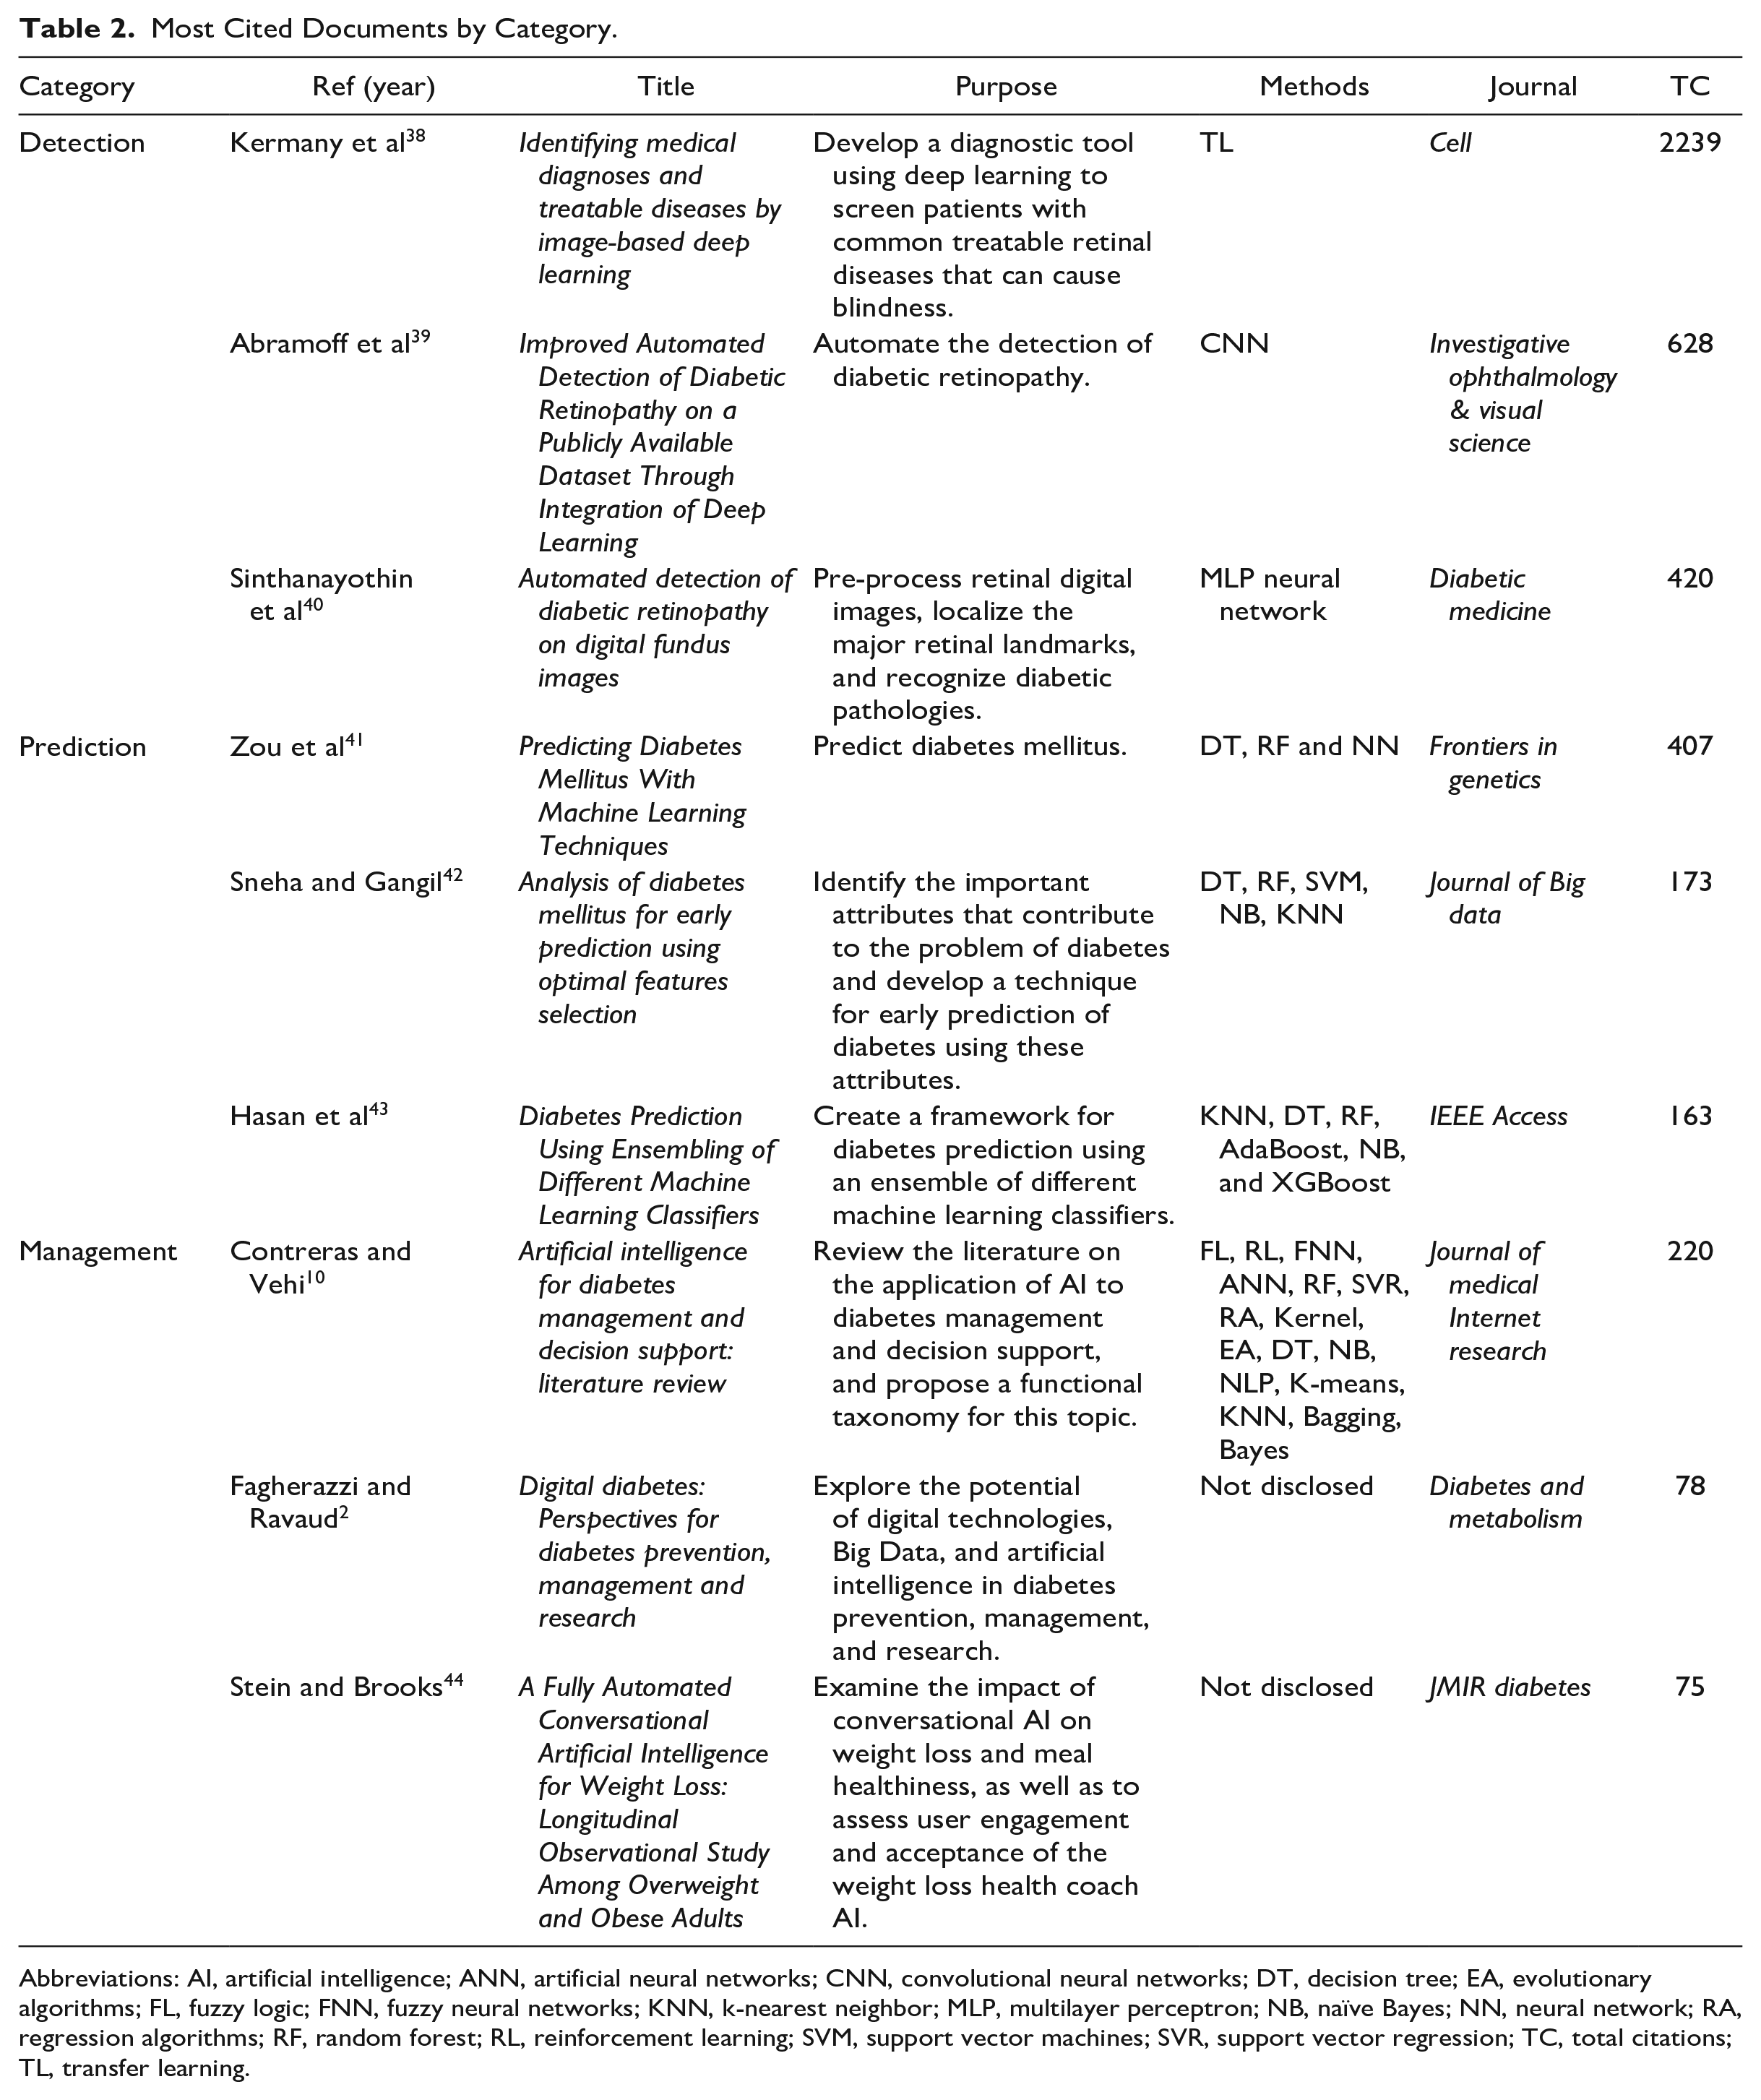
Abbreviations: AI, artificial intelligence; ANN, artificial neural networks; CNN, convolutional neural networks; DT, decision tree; EA, evolutionary algorithms; FL, fuzzy logic; FNN, fuzzy neural networks; KNN, k-nearest neighbor; MLP, multilayer perceptron; NB, naïve Bayes; NN, neural network; RA, regression algorithms; RF, random forest; RL, reinforcement learning; SVM, support vector machines; SVR, support vector regression; TC, total citations; TL, transfer learning.
The 3 articles with the highest number of citations in the entire database are situated within the Detection category,38-40 which is likely due to the larger volume of articles within this category compared with the others. Here, the prominent methods include transfer learning (TL), convolutional neural networks (CNNs), and multilayer perceptron (MLP) neural networks (NNs), all of which are closely related to image processing. However, no specific technical details are provided for each of these methods.
In contrast, articles within the Prediction category presented a greater amount of technical information regarding the methods used.41-43 Decision tree (DT) and random forest (RF) techniques were commonly employed across the 3 most frequently cited articles in this category. Zou et al 41 additionally used the NN approach, while Sneha and Gangil 42 incorporated the support vector machines (SVM), naïve Bayes (NB), and k-nearest neighbor (KNN) methods. Hasan et al 43 also employed the latter 2 methods, along with the AdaBoost and XGBoost techniques.
Articles within the Management category2,10,44 did not mention specific methods. This is because 2 of the most cited articles appear to be literature reviews,2,10 emphasizing the potential of using AI techniques in diabetes management rather than directly comparing these techniques. However, the article by Contreras and Vehi 10 provides insights into the most frequently employed techniques in 7 categories related to diabetes management. These categories encompass several methods, including fuzzy logic (FL), reinforcement learning (RL), fuzzy neural networks (FNN), artificial neural networks (ANN), support vector regression (SVR), regression algorithms (RAs), kernel methods, evolutionary algorithms (EAs), natural language processing (NLP), K-means clustering, KNNs, bagging, NB, RFs, and DTs.
Network Analysis
Countries Collaboration
The country of the corresponding author reveals that research concerning the use of ML and DL techniques in the context of diabetes encompasses approximately 76 distinct countries. However, data on the country of origin are absent in 15% of the collected documents. The findings reveal a pronounced concentration of research activities in Asia (57.7%), followed by Europe (19.6%) and North America (15%). Conversely, a more modest presence was observed in Africa (3.1%), Oceania (2.8%), and South America (1.8%). Figure 3 illustrates the collaborative relationships among countries.
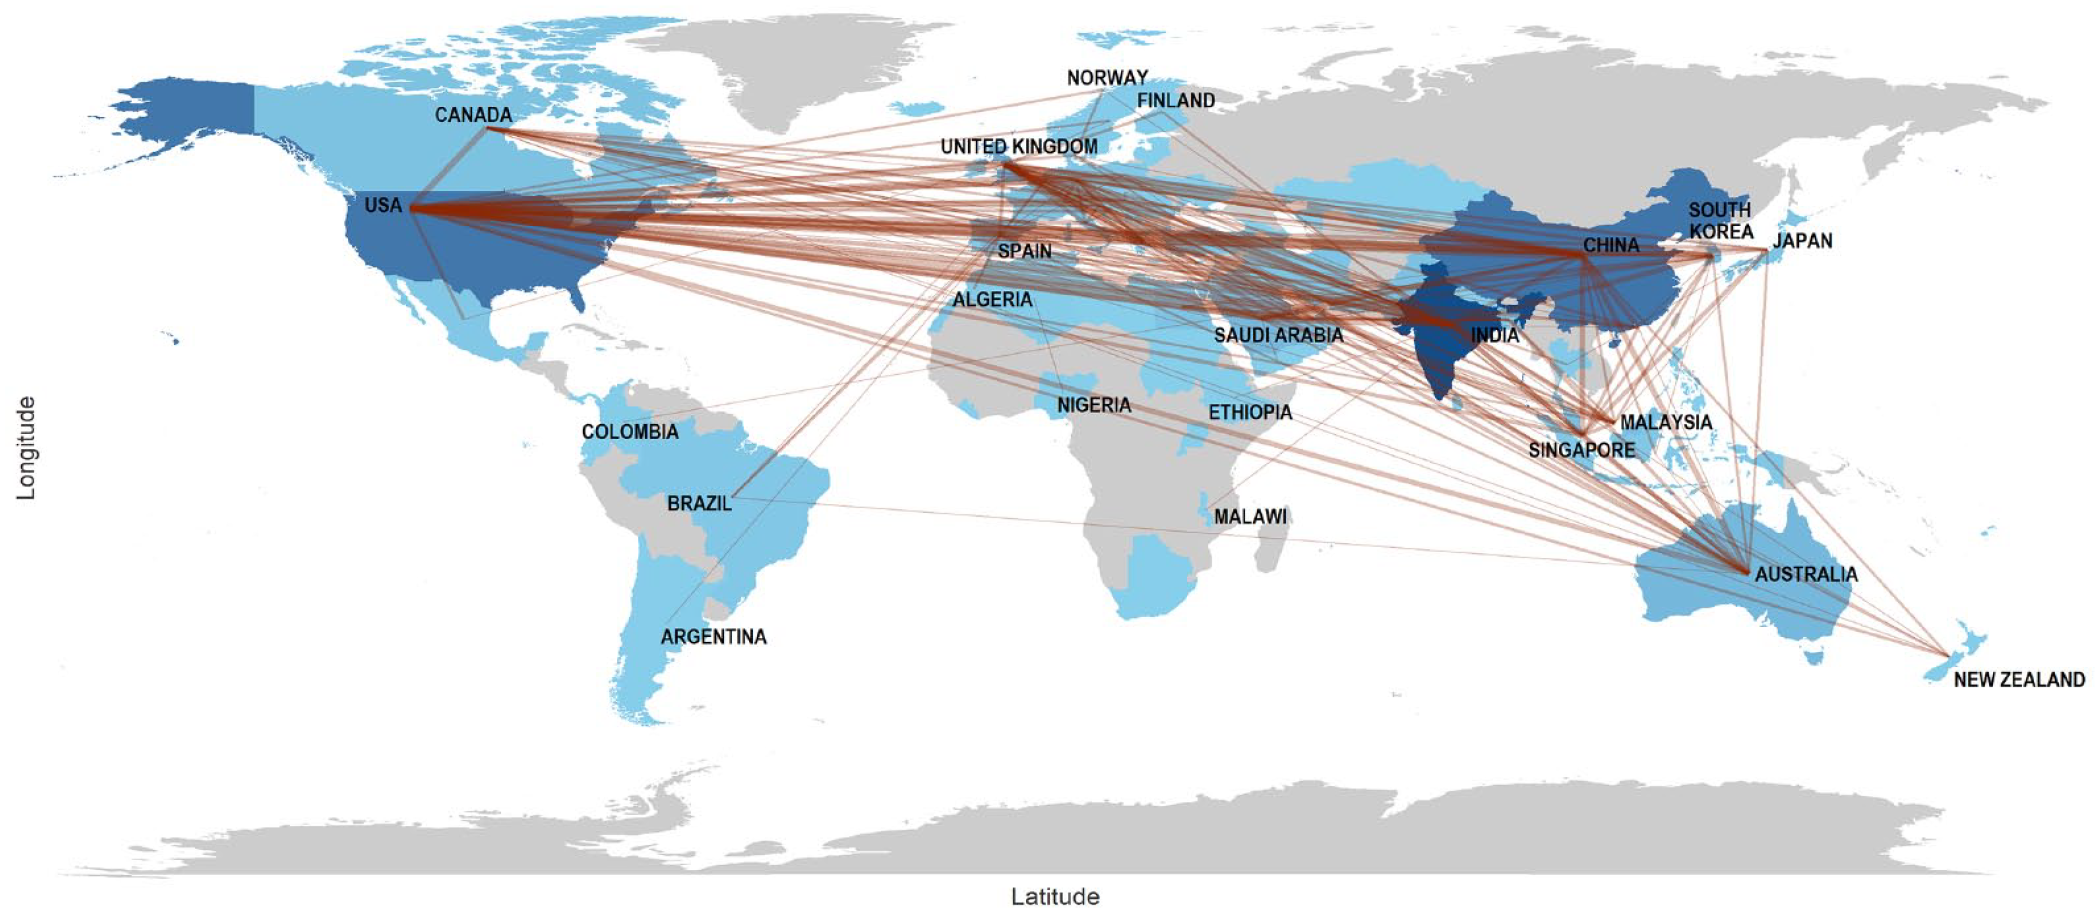
Social structure. Countries’ collaboration world map. The greater the color intensity, the greater the centrality of the node associated with the country.
China (18.1%) and India (15.8%) lead in research output in this field, followed by the United States (14.85%). These 3 countries remain in the ranking when examining productivity by category (Detection, Prediction, and Management).
India stands out with 180 collaborations involving 51 nations. Authors from India primarily collaborate with researchers from the United States (12%), Saudi Arabia (9%), the United Kingdom (9%), South Korea (7%), and Malaysia (6%). China, on the contrary, has 206 collaborations with 42 countries, with significant partnerships with the United States (25%), the United Kingdom (11%), Australia (7%), Singapore (5%), and India (4%). The United States records 242 collaborations with 52 countries, emphasizing strong connections with the United Kingdom (8%), Canada (6%), South Korea (6%), Australia (5%), and Spain (5%). Overall, 28.26% of the articles in this field resulted from international collaborations.
Figure 4 illustrates the top 5 countries with the highest productivity over time. China has significantly increased its publication output starting from 2011, surpassing both the United States and India in research productivity by 2021, thus becoming the leading country in this field. From 2000 to 2022, articles produced by China, the United States, and India have amassed a total of 4841, 4542, and 4100 citations, respectively, with an average of 18.70, 23.70, and 14.10 citations per article. Other countries have received a total number of citations that is less than 1800.
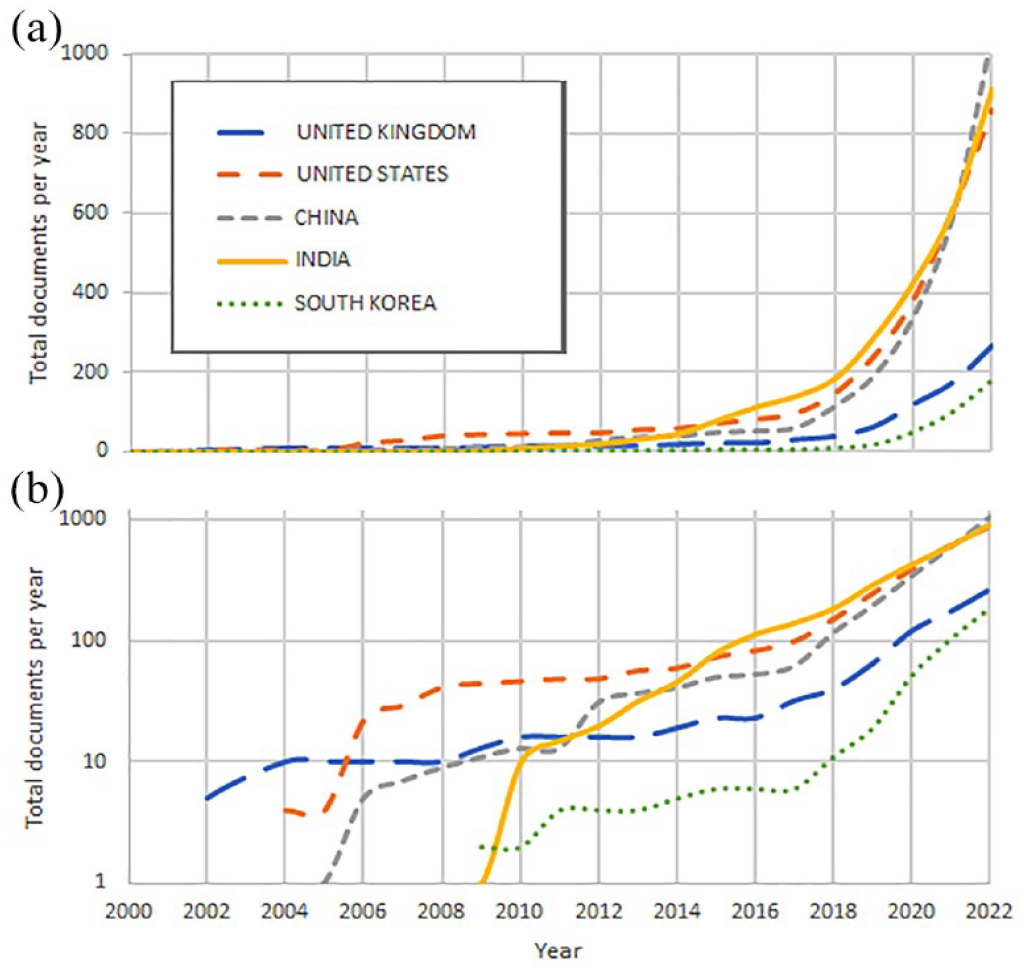
Top 5 countries with the highest productivity over time. (a) Absolute values and (b) Values in logarithmic scale.
Institutional Collaboration
The assessment of the institutions’ contributions was conducted by examining the affiliations of authors, leading to the evaluation of 3043 institutions. This evaluation was performed by counting the number of articles associated with each institution. The top 5 most relevant institutions in this regard are Imperial College London (The United Kingdom) and the University of California (The United States), each with 22 articles, followed by Mansoura University (Egypt) and the National University of Singapore, both with 21 articles, and Capital Medical University (China) with 20 articles.
It is worth emphasizing that the research affiliated with any institution mentioned is relatively recent. For instance, Imperial College London has been actively involved in studies in this field since 2015, and all these institutions have reached their peak productivity levels in the last 2 years (2021-2022).
Figure 5 shows the institutional collaboration network. Nodes represent institutions, and the connection between nodes indicates institutional collaboration. The thickness of the edges indicates the frequency of collaboration. The thicker the edge, the greater the number of collaborations between the connected institutions.
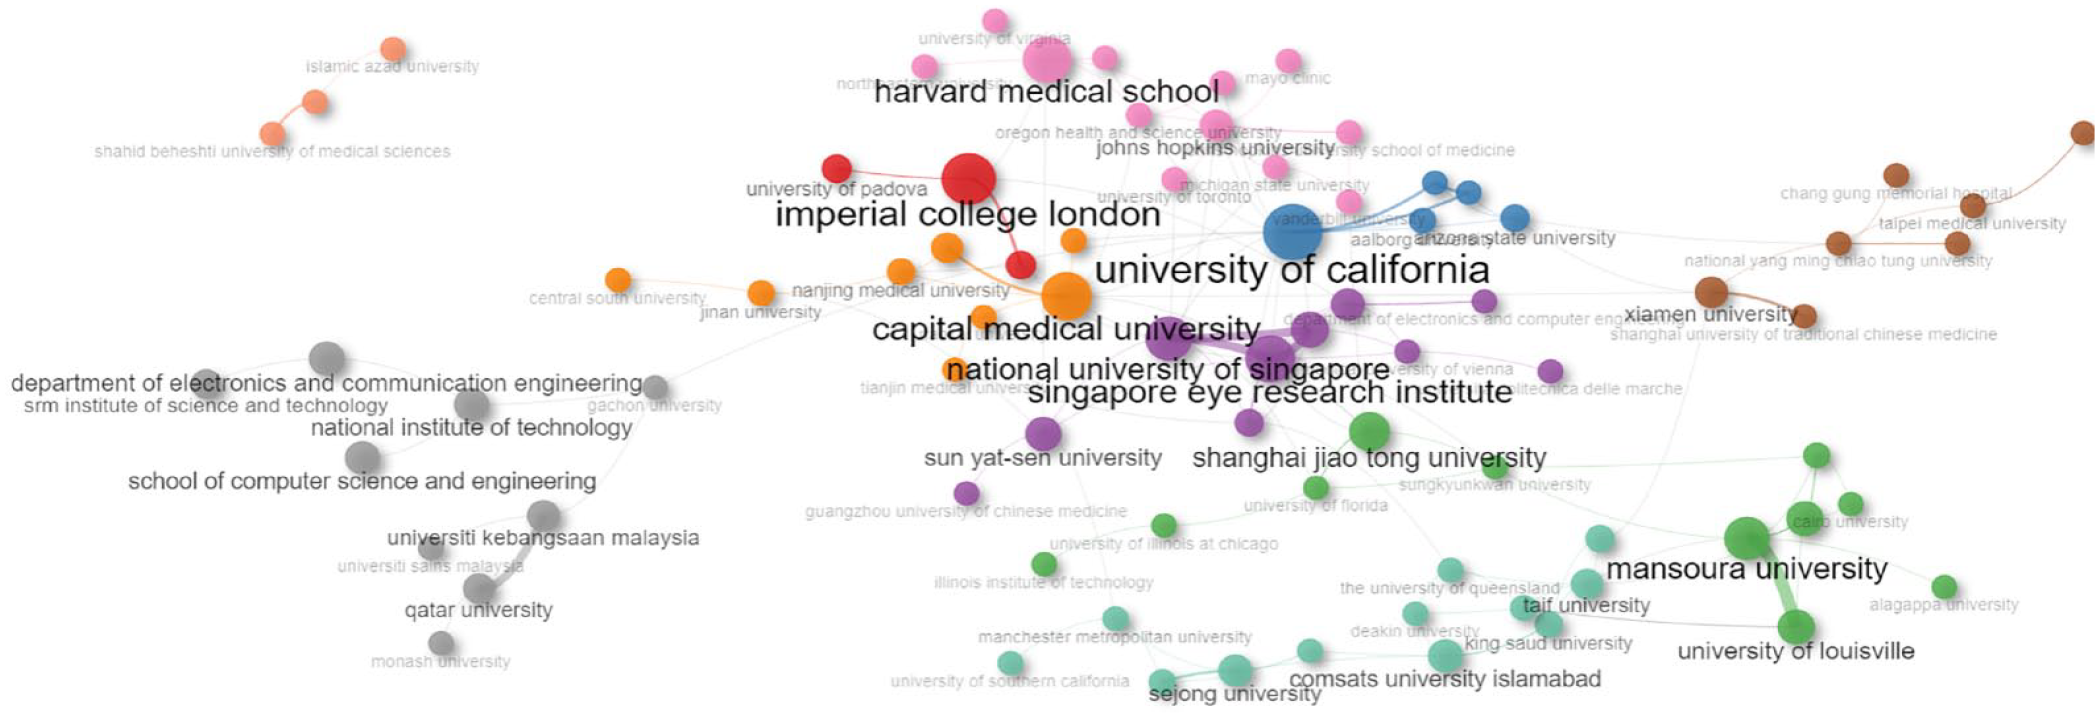
Social structure. Collaboration network between institutions. Nodes represent institutions, and the connection between nodes indicates institutional collaboration. The size of the circle indicates the degree of the node.
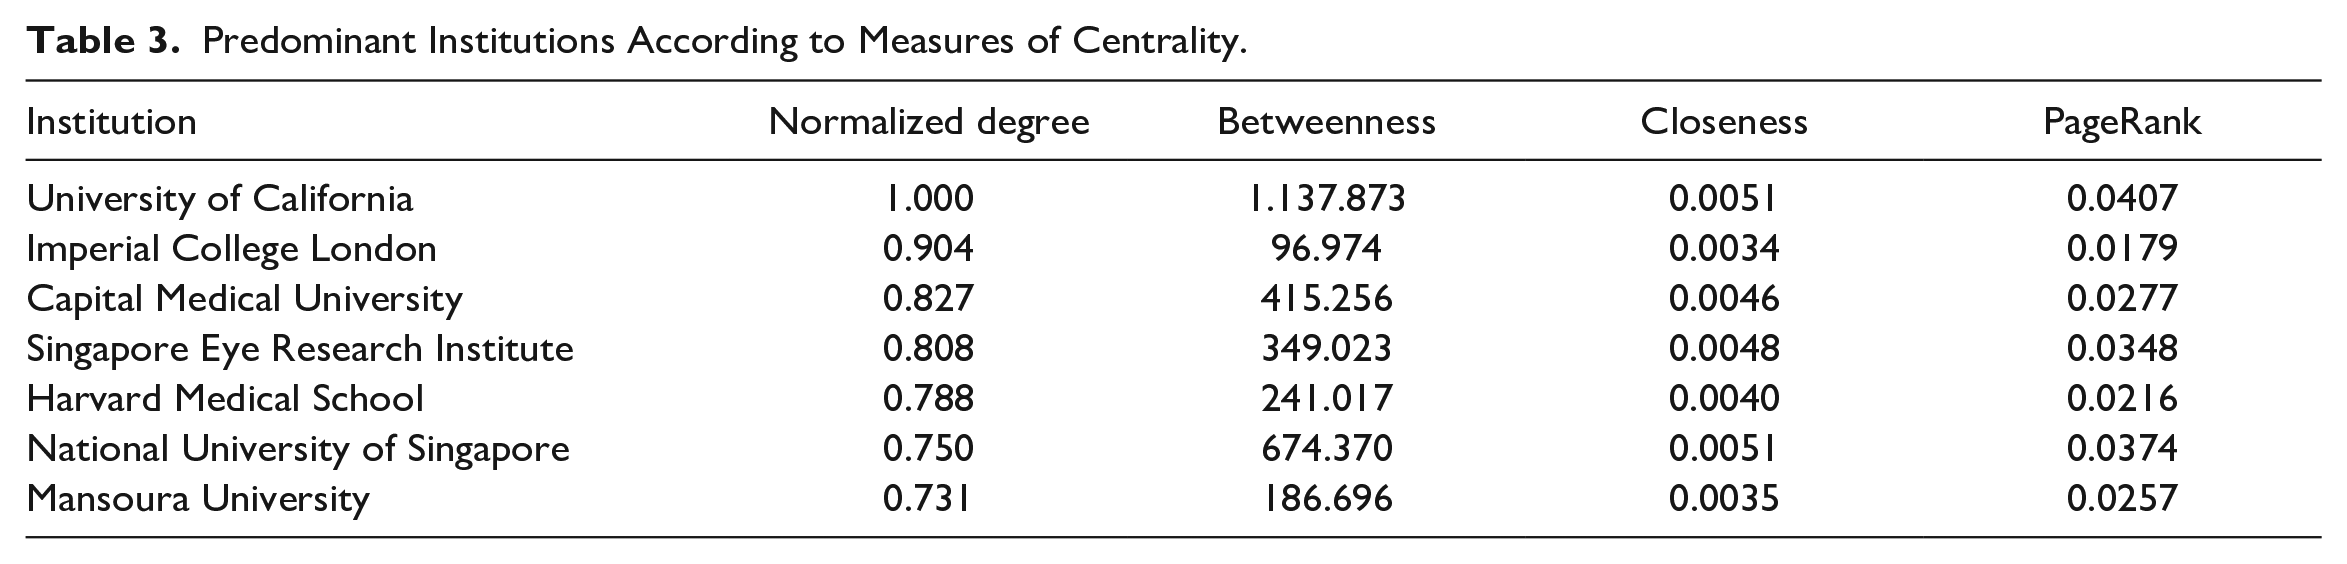
The network of collaborations between institutions exhibits 10 clusters with sizes ranging from 3 to 12. The normalized degree metric reveals 7 main nodes detailed in Table 3. According to the centrality measures of the network’s vertices, the University of California is the most important (influential) and key institution for developing scientific production in this field. This institution presents the highest normalized degree, betweenness, and PageRank of the entire network. The University of California has a direct connection with 3 institutions: China Medical University (China), Arizona State University (The United States), and Aalborg University (Denmark). However, it connects indirectly with all other network nodes, except for the group formed by Iranian institutions (Shahid Beheshti University of Medical Sciences, Tehran University of Medical Sciences, and Islamic Azad University). In fact, the highest closeness metric corresponds to the Tehran University of Medical Sciences (0.5).
Predominant Institutions According to Measures of Centrality.
Author Keywords and Trending Topics
Author-provided keywords facilitate the discernment of thematic patterns that serve as focal points for research inquiry. 45 The collected documents gathered 3852 different keywords. The construction of the co-occurrence network-based author’s keywords favors the identification of semantic similarity between terms and reveals knowledge structures around the area of interest.46,47 To elaborate the network, a dictionary of synonyms was inserted to unify terms corresponding to the same concept (e.g., “neural network” and “neural networks”). The parameters described at the end of the Methods section were used to elaborate the network observed in Figure 6. This network of co-occurrences includes the 100 most common keywords (2.6%), providing an overview of the research and a visualization of the interconnected subdomains.
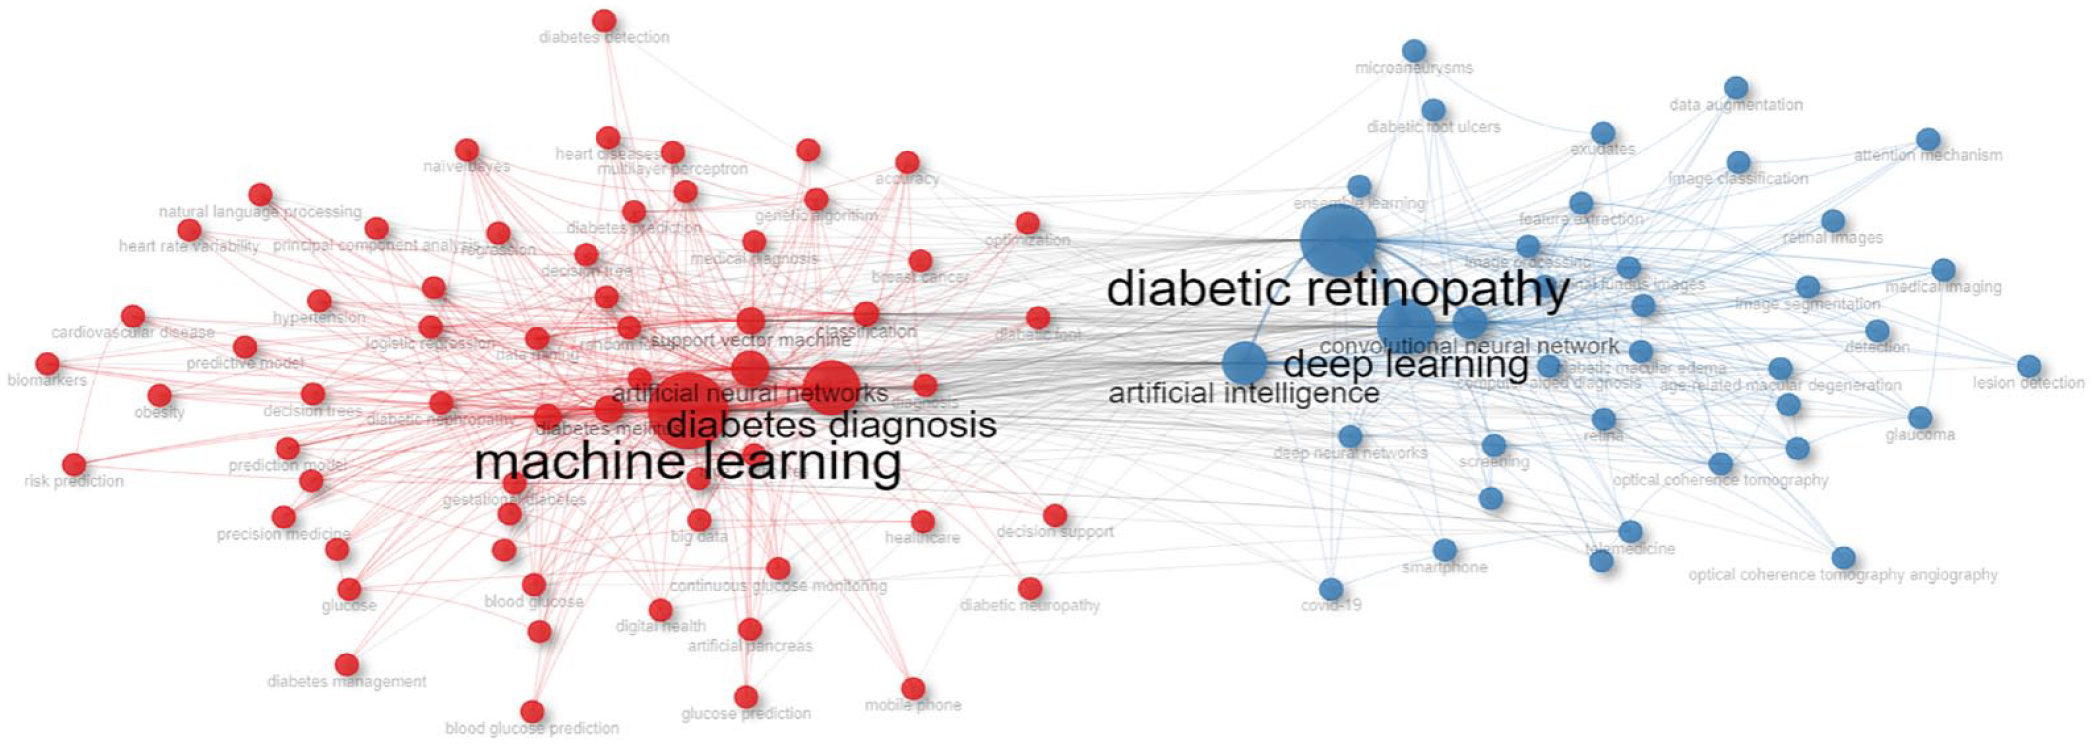
Author’s keyword co-occurrence network. Nodes represent keywords, and the connection between nodes indicates the coexistence of terms in the same document. The size of the circle indicates the degree of the node.
Figure 6 shows the author’s keywords (nodes) grouped into 2 communities (clusters, groups, or subdomains). The coexistence of terms in the same cluster indicates that they have a similar context and relationship. The edges of the network determine the coexistence of terms in the same document.
The red cluster comprises 63 terms. Nodal centrality metrics (normalized degree, betweenness, closeness, and PageRank) point to 3 important nodes: machine learning, diabetes diagnostics, and artificial neural networks. The blue cluster includes the remaining 37 nodes and stands out: diabetic retinopathy, deep learning, and artificial intelligence. Specifically, the PageRank metric distinguishes the terms machine learning (0.097) and diabetic retinopathy (0.087) as the dominant node of each set. Table 4 shows the 10 most prominent terms within each cluster about diabetes research and the ML and DL methods/ techniques/algorithms key in the field.
Top Influential Author Keywords in Each Subdomain According to the PageRank Metric.
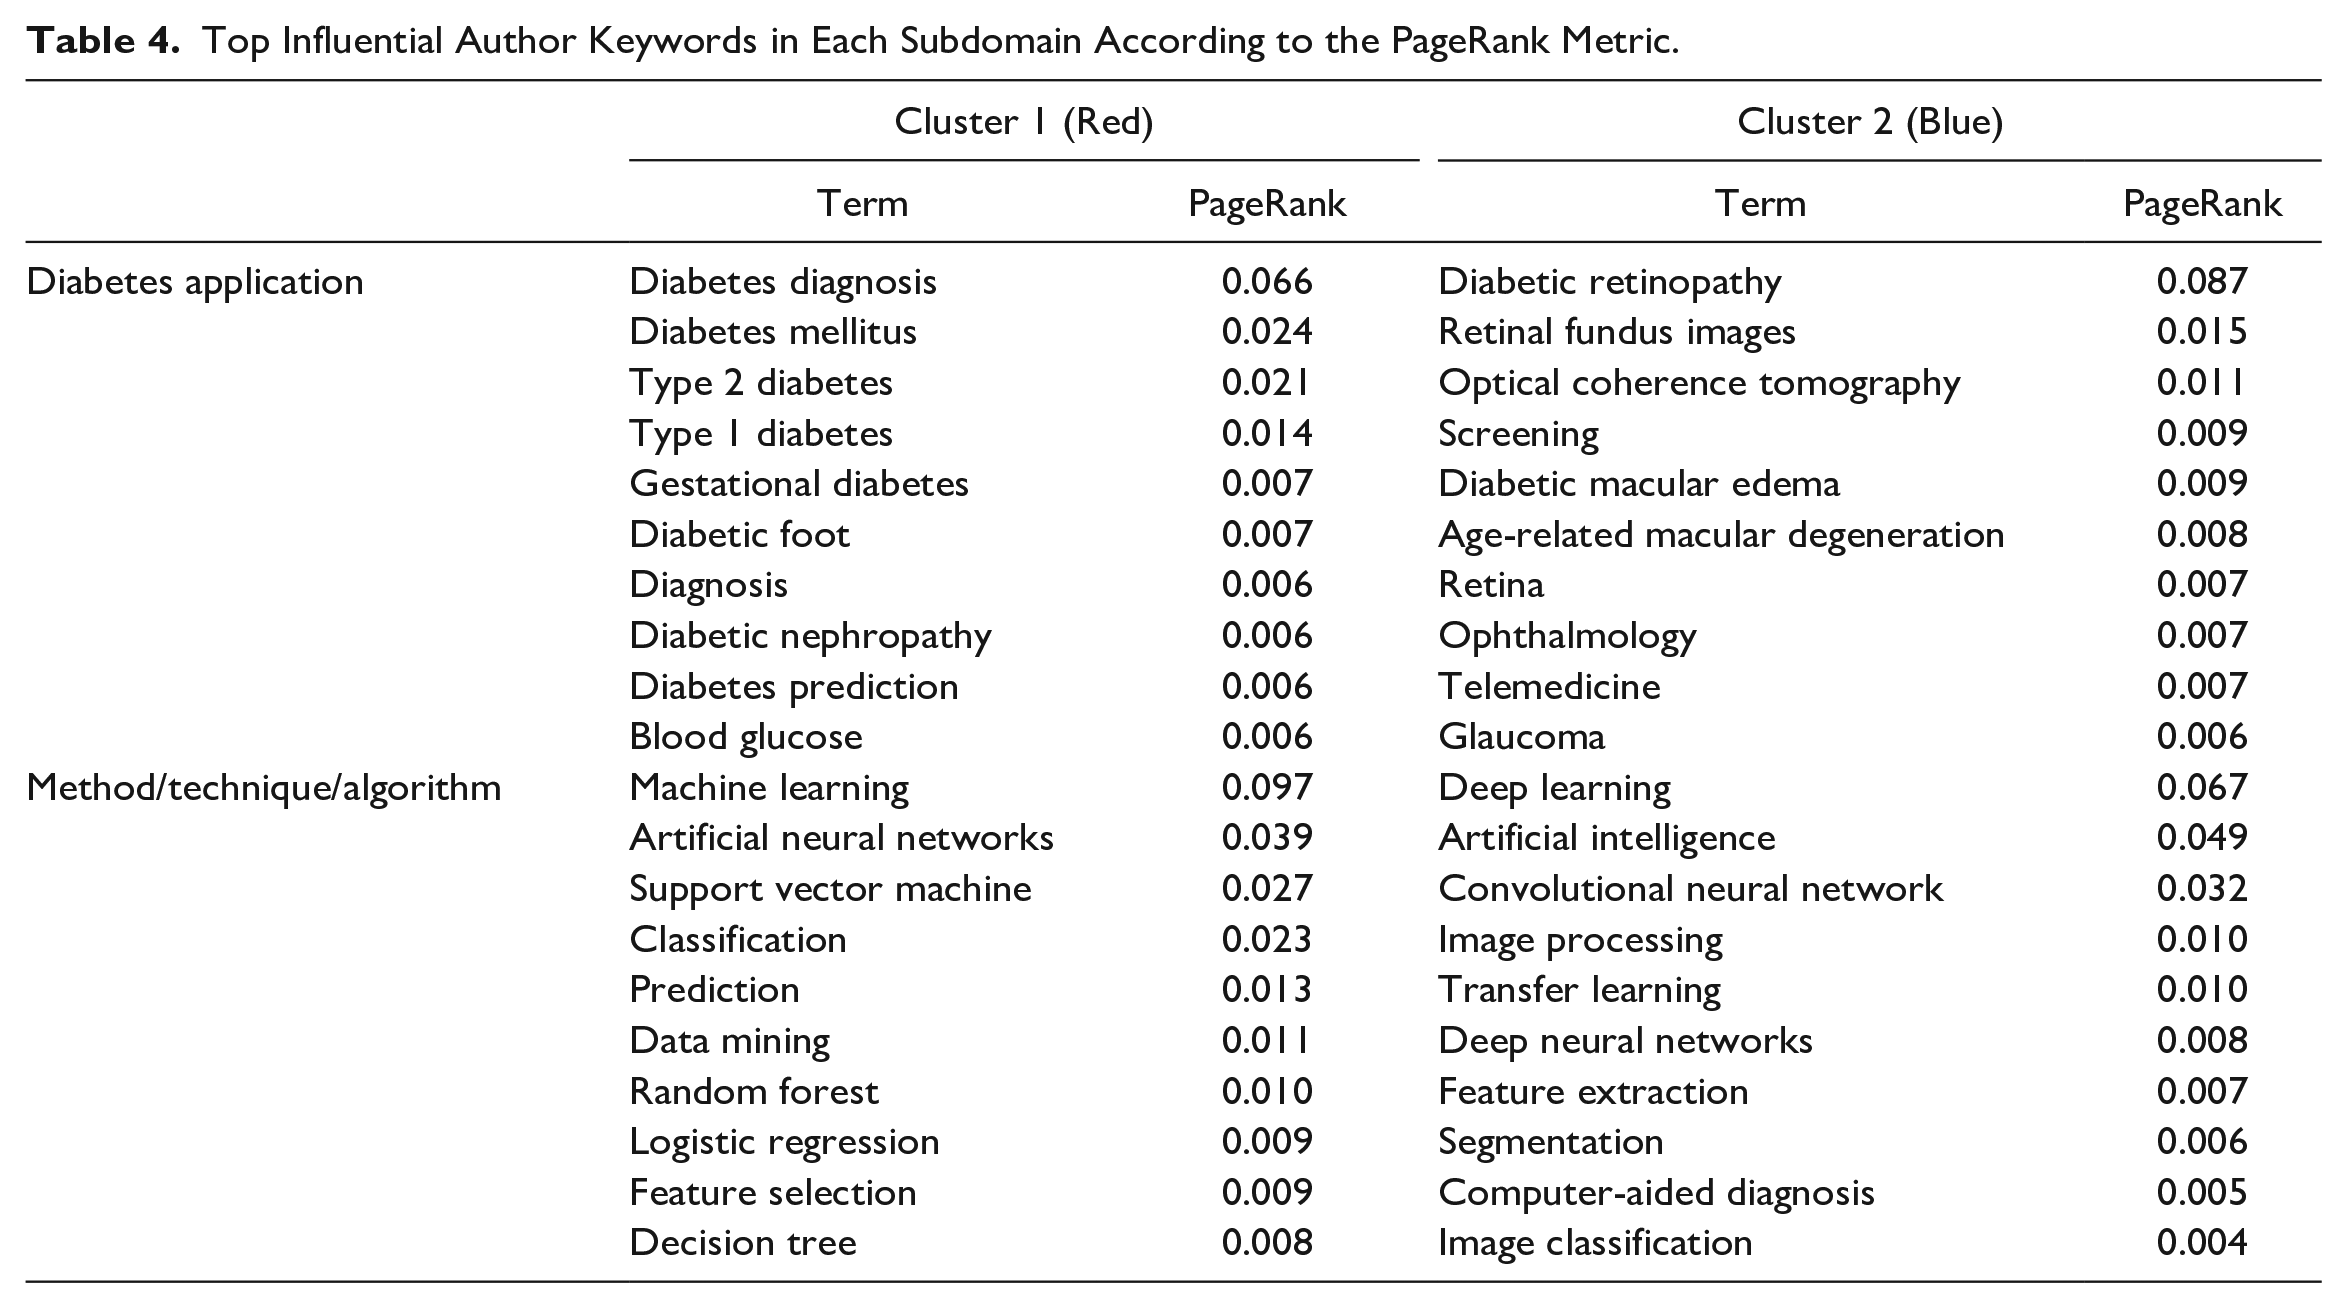
The terminology associated with cluster 1 in Table 4 indicates ML techniques related to the study of diabetes, types of diabetes, and diabetes complications such as diabetic foot and diabetic nephropathy. Artificial neural networks, support vector machines, random forest, logistic regression, and decision tree algorithms are predominant. These techniques are mainly used to predict and classify variables of interest (supervised learning) through feature selection.48-50 Both processes are subfields of data mining.51,52
However, the terminology associated with cluster 2 highlights the relationship between DL techniques (a subfield of AI and machine learning53,54) and diabetes complications related to eye diseases. In this cluster, convolutional neural networks, transfer learning, and deep neural networks are the predominant algorithms. These techniques are mainly applied to image classification and segmentation processes (supervised and unsupervised learning) and computer-aided diagnosis by feature extraction.55-57
The trending topic analysis was conducted using the author-provided keywords. Bibliometric parameters encompassing a minimum frequency of 10 occurrences and a threshold of 5 occurrences per year were applied. Figure 7 depicts the prominent terms over time from 2010 to 2022. The term medical diagnosis holds the longest enduring trend, spanning 2010 to 2020. Post-2020, the authors have incorporated additional terms that denote refined diagnostic contexts within the keywords. Notable instances include diabetic retinopathy, diabetes diagnosis, and diabetic foot.
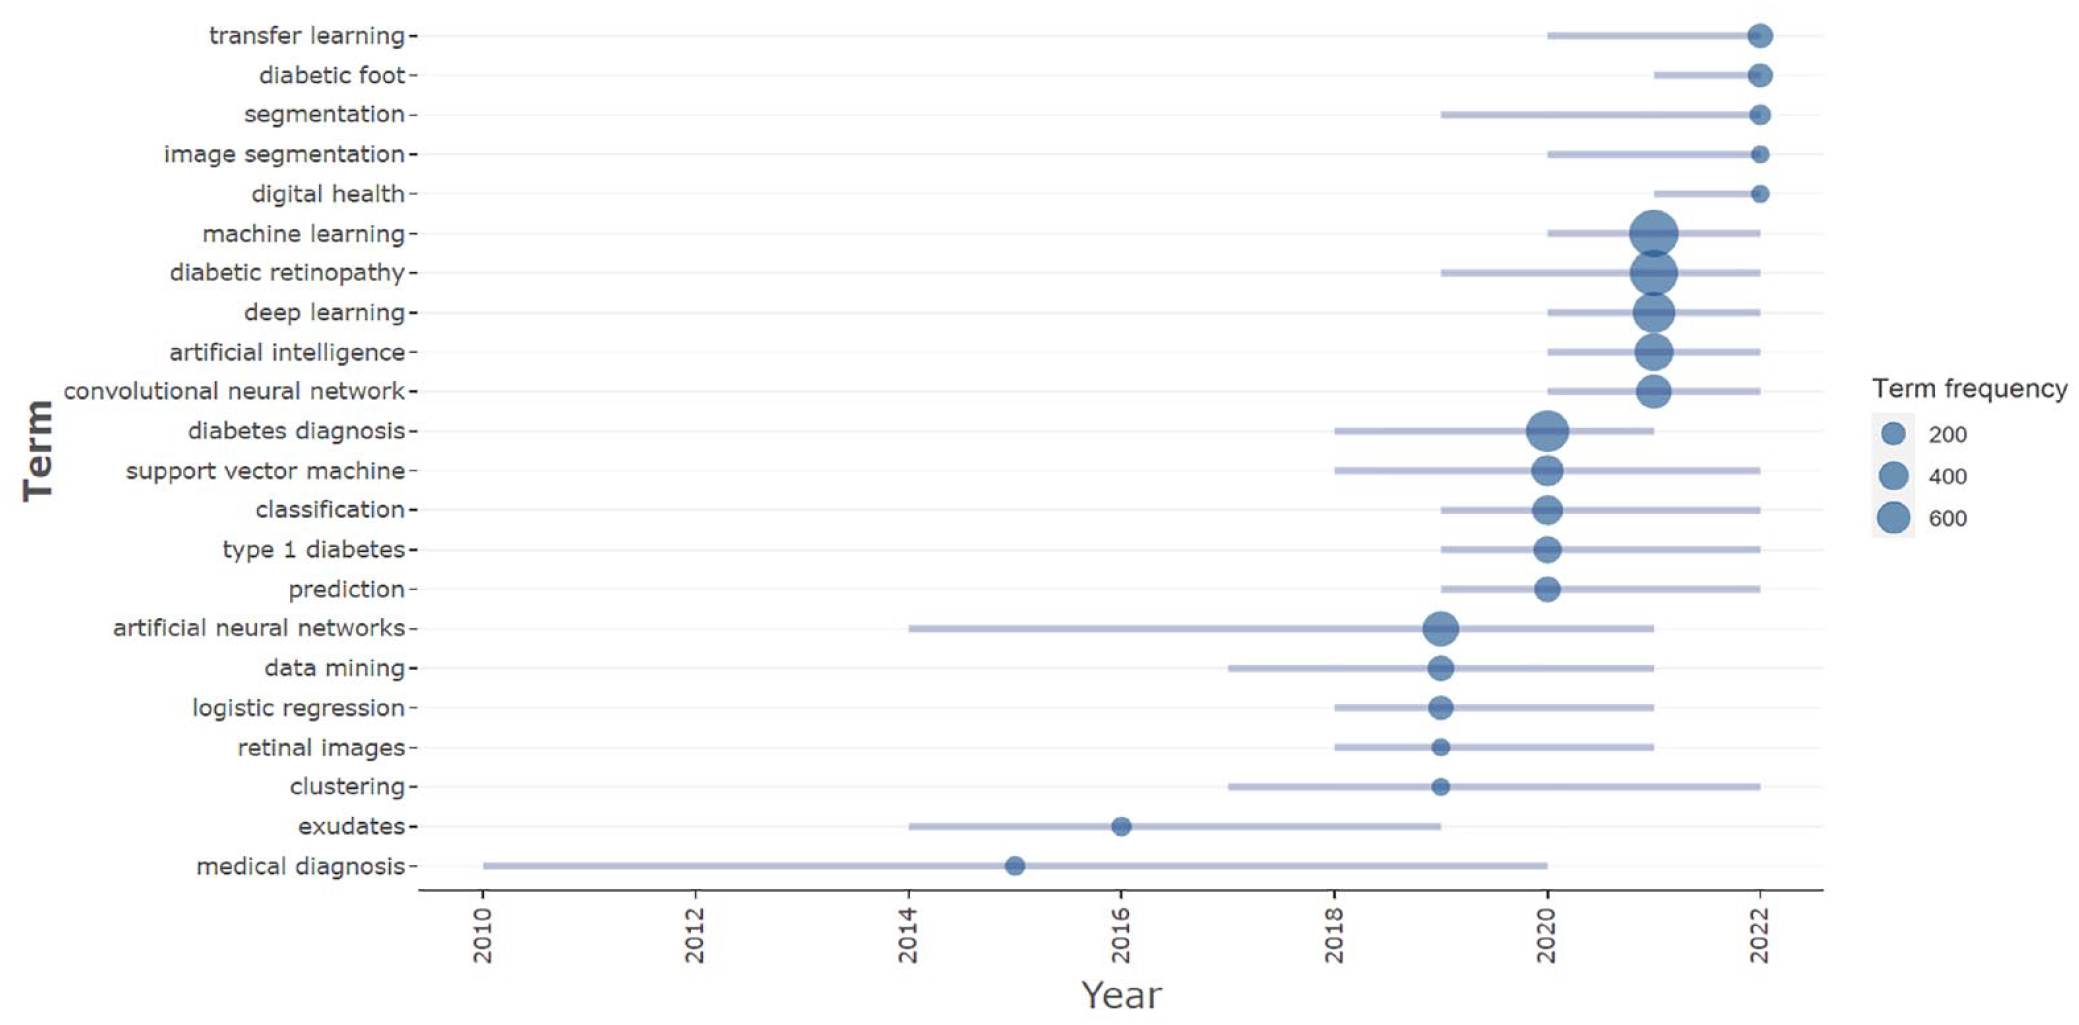
Trending topics in the field.
Figure 7 also illustrates a rise in the prevalence of algorithms on the application of ML and DL techniques within diabetes research, a trend manifesting in authors’ keywords since 2014. Notably, the term artificial neural network gained traction from 2014 to 2021, with its height occurring in 2019 at a frequency of 227 instances. By the years 2021-2022, a subtype of ANN known as convolutional neural network has garnered prominence. This latter term observed substantial uptake starting in 2020 and reached its peak at 203 occurrences in 2021. Moreover, prominent terms including artificial intelligence (294), deep learning (400), diabetic retinopathy (598), and machine learning (646) have exhibited a robust surge over the last 2 years, asserting their dominion in 2021.
Discussion
To the best of our knowledge, this study represents the first comprehensive bibliometric analysis of the application of ML and DL techniques within the field of diabetes research. In contrast to some bibliometric analyses that have focused on specific subdomains or applications, our analysis takes a broader perspective, encompassing the entire spectrum of ML and DL research in the context of diabetes.
We observed a noteworthy surge in interest within this field, particularly since 2012, and a notable increase in the last 3 years (see Figure 2). This can be attributed to the widespread dissemination and recognition of the enormous potential of AI in healthcare applications.58-60 In addition, it is closely tied to the ongoing evolution and refinement of these cutting-edge techniques.
A remarkable level of productivity was observed within the Detection category, which primarily focused on diabetes retinopathy and eye diseases. This can be attributed to various factors, including advancements in medical imaging technology, a heightened awareness of the significance of early detection in preventing vision loss, and the availability of extensive data sets for training and validating ML and DL models.61-63 Furthermore, progress in ML and DL techniques, such as the integration of convolutional NNs with SVMs or RF to automatically extract features from retinal images and enhance pattern classification tasks,22,64 has contributed to increased attention and productivity. The reader can refer to Table A in the Supplemental Appendix to observe the most common techniques found in each category.
Similarly, albeit with an important time lag, productivity within the Prediction category has experienced a substantial increase since 2017 (see Figure 2). Research in this subdomain has primarily focused on predicting diabetes, employing well-established ML techniques such as RF, logistic regression, SVMs, decision trees and NB (see Table A). These techniques are well-suited for modeling relationships between variables in this context, as they are methods capable of handling structured and unstructured data and incorporating categorical and quantitative variables, such as blood glucose levels, blood pressure, body mass index, and family history.
In the Management category, a similar trend in productivity was observed since 2017 compared to the Prediction category, although with notably fewer articles. The most common machine learning techniques observed within this category include logistic regression, RFs, SVMs, linear regression, and RL (see Table A). The relatively low number of articles in this category, as compared with the others, may be attributed to a combination of factors, such as research priorities, funding availability, clinical requirements, and prevailing trends in the field of diabetes from 2000 to 2022. It is essential to acknowledge that maturity in the use of ML and DL techniques can indeed impact the distribution of articles across the categories considered. As the scientific community accumulates experience and grows more confident in the applicability and precision of these methods, it is probable that their application expands into a range of areas, spanning from early detection to advanced management and treatment. This is a common behavior for the adoption of new technologies in medical research. 8 Therefore, greater growth in the coming years is expected to be seen in this subdomain. Some potential applications that currently do not utilize AI techniques could include earlier prediction of glucose excursions from continuous monitoring data, building upon existing research, 65 or reducing the impact of hypoglycemic events by leveraging machine learning to improve basal-bolus treatments.66,67 This maturity could also extend to automated insulin delivery systems that can leverage the capabilities of ML and DL techniques on large volumes of data and their computational power to infer complementary models and control strategies directly from experience. This would allow the learning of complex behaviors that are difficult to model analytically.
Regarding research journals, it was observed that the top 10 are qualified in the first- and second-highest quartiles in Scopus (8 in Q1, and 2 in Q2). Half of them operate with subscription access and the other as open access with different levels ranging from bronze to gold. Therefore, there is no preferred type of research journal to publish between subscription and open access, although most articles have been published in top-quality journals. The reader can refer to Table B in the Supplemental Appendix to observe the above details.
In terms of country productivity, there is a clear current dominance by China, surpassing the United States and India since 2021. It is worth noting India’s presence as the second most productive country currently, which led in this research field globally from 2015 to 2021. Other countries, such as the United Kingdom and South Korea, have shown a notable increase in productivity since 2019 but still lag significantly behind the top 3. It is evident that in this research field, the results of substantial investments in AI by these leading countries are clearly reflected, with a considerable surge since 2012 (Figure 4).
Regarding the network of institutions (Figure 5), there is no clear majority leadership in the field. The percentage of documents associated with each institution ranges from 0.06% to 1.24%. In general, we observe a well-connected network, facilitating interconnection among institutions for the vast majority, except for the cluster formed by Iranian institutions. This cluster does not engage in external collaborations, leading to the highest closeness metric value. Their main studies have focused on the classification and prediction of type 2 diabetes and complications such as nephropathy.
Finally, Figure 7 allows us to observe the trends in the field over the years from 2010 to 2022. Two terms that are no longer relevant today, exudates and medical diagnosis, have given way to a greater maturity of the topic. From 2018 to 2021, a significant increase was observed in terms such as retinal imaging, data mining, logistic regression, or artificial neural networks. In other words, there was a greater specification of machine learning techniques, with an application in retinopathy that began to dominate this field (see Figure 6). This behavior, which is also observed in the widespread use of ML and DL techniques in diabetes research (Figure 2), is consistent with recent research that reports a notable increase in studies on AI techniques and their applications in areas of health sciences since 2018.68-70
Meanwhile, from 2019 to the present, new more relevant terms have been emerging focused on the prediction, classification and diagnosis of diabetes using established machine learning techniques such as support vector machines. However, since 2020, there has been a strong emphasis on an approach that includes deep learning techniques such as convolutional neural networks, applied mainly to the detection and classification of eye diseases related to complications such as retinopathy. This group of terms represents the most outstanding trend in research throughout the entire period considered in our bibliometric analysis.
Since 2021 new terms such as transfer learning, digital health, diabetic foot, or image segmentation have appeared, indicating future trends with greater impact in this field. In particular, transfer learning has gained traction as one of the machine learning strategies, thanks to its usefulness in taking a model previously trained on a task and using it as a starting point for training a new model on a related task. This is particularly useful when fitting pretrained models with large data sets using limited available data to learn specific new tasks.
Algorithms for Predicting Complications of Diabetes
Of the 455 articles within the Prediction category, 67 were dedicated to predicting complications associated with diabetes. Among these, 58 articles addressed a single complication, including 23 on retinopathy, 14 on nephropathy, 9 on cardiopathy, 7 on neuropathy, 4 on diabetic foot, and 1 on diabetic ketoacidosis. The remaining 9 articles addressed multiple complications, with 2 being literature reviews. Please refer to Table C in the Supplemental Appendix for a list of these selected articles.
The most cited article in this list was published in the Journal of Diabetes Science and Technology in 2018. 71 It presented a machine learning approach to predict the onset of retinopathy, neuropathy, or nephropathy based on electronic health records of nearly one thousand patients with type 2 diabetes from Italy. They employed a combination of random forest and logistic regression techniques, achieving a model accuracy of up to 0.838. Similar studies were reported in the other articles of Table C. These studies primarily focused on diabetes complications using databases that ranged from hundreds to thousands of patients with type 2 diabetes. The preferred techniques included recurrent neural networks, Bayesian networks, classification and regression trees, ensemble models, support vector machines, decision trees, fuzzy neural networks, and XGBoost. In most of the complications addressed, accuracy percentages greater than 70% were observed.
The scope of these results demonstrates how the use of AI, especially machine learning, has become an essential tool in diabetes research. These advances allow for more accurate prediction of complications, which can have a significant impact on the care, treatment, and quality of life of patients with diabetes. The diversity of techniques and approaches also reflects the maturity and versatility of ML in this ever-evolving field.
Limitations
This study has identified several limitations that warrant attention.
First, the presence of multiple authors sharing the same name but not being the same individual presented a challenge when identifying the most prominent authors in the field and constructing co-citation networks.
Second, the absence of comprehensive details in some articles regarding the implementation of machine learning techniques hindered our ability to assess and compare the methods employed. These articles lacked crucial information such as parameterization, methodological approaches, training, validation, and test data.
Finally, our research scope was restricted due to the exclusion of conference proceedings and books, as well as articles published in languages other than English. This could have inadvertently resulted in the omission of pertinent studies conducted in alternative formats and languages. Future research should consider broadening the search criteria to encompass a more comprehensive range of relevant research.
It is also important to acknowledge that the scope of our bibliometric analysis may have been affected by limitations imposed on downloaded data due to potential subscription restrictions on scientific databases.
Conclusions
A bibliometric analysis was conducted to examine the use of ML and DL techniques in the field of diabetes research, based on scientific publications from 2000 to 2022. Descriptive and network analyses revealed a significant increase in productivity, particularly in recent years with exponential growth. China has become one of the major contributors to research productivity, surpassing the United States and India by 2021. India, on the contrary, has demonstrated the highest level of collaboration, primarily with the United States, Saudi Arabia, and the United Kingdom.
In terms of institutions, the University of California has emerged as the most influential and key institution in the advancement of scientific production in this field. It maintains direct connections with China Medical University (China), Arizona State University (United States), and Aalborg University (Denmark).
When analyzing the authors, it was not possible to establish predominant authors or collaboration networks due to the presence of multiple authors with the same name.
By examining the author’s keywords, 2 main clusters were identified. The first one predominantly focused on machine learning and diabetes diagnosis, whereas the second one emphasized diabetic retinopathy and deep learning. This suggests that deep learning techniques are commonly employed because of the specific characteristics of the data used.
Finally, a categorical analysis was performed to evaluate the application of the ML and DL techniques. The results indicate a mastery of these techniques in the areas of Detection, followed by Prediction and Management. Among the most widely used techniques in these categories, RF, and SVM are in the top 3. Logistic regression also stands out in the Prediction and Management categories, while CNNs are predominantly used in Detection. Overall, this area of research presents significant potential for continued growth in the coming years, especially in the subdomain of Management.
Supplemental Material
sj-docx-1-dst-10.1177_19322968231215350 – Supplemental material for Machine Learning and Deep Learning Techniques Applied to Diabetes Research: A Bibliometric Analysis
Supplemental material, sj-docx-1-dst-10.1177_19322968231215350 for Machine Learning and Deep Learning Techniques Applied to Diabetes Research: A Bibliometric Analysis by Maira García-Jaramillo, Carolina Luque and Fabian León-Vargas in Journal of Diabetes Science and Technology
Footnotes
Abbreviations
AI, artificial intelligence; ANN, artificial neural networks; CNN, convolutional neural networks; DL, deep learning; DT, decision tree; EA, evolutionary algorithms; FL, fuzzy logic; FNN, fuzzy neural networks; KNN, k-nearest neighbor; ML, machine learning; MLP, multilayer perceptron; NB, naïve Bayes; NN, neural network; RA, regression algorithms; RF, random forest; RL, reinforcement learning; SVM, support vector machines; SVR, support vector regression; TC, total citations; TL, transfer learning.
Declaration of Conflicting Interests
The author(s) declared no potential conflicts of interest with respect to the research, authorship, and/or publication of this article.
Funding
The author(s) disclosed receipt of the following financial support for the research, authorship, and/or publication of this article: This work was funded by Universidad Ean (grant no. TO_P01_2022) and Universidad Antonio Nariño (grant no. 2022033).
Supplemental Material
Supplemental material for this article is available online.
References
Supplementary Material
Please find the following supplemental material available below.
For Open Access articles published under a Creative Commons License, all supplemental material carries the same license as the article it is associated with.
For non-Open Access articles published, all supplemental material carries a non-exclusive license, and permission requests for re-use of supplemental material or any part of supplemental material shall be sent directly to the copyright owner as specified in the copyright notice associated with the article.