
Abstract
Background:
Detection of two or more autoantibodies (Ab) in the blood might describe those individuals at increased risk of developing type 1 diabetes (T1D) during the following years. The aim of this exploratory study is to propose a high versus low T1D risk classifier using machine learning technology based on continuous glucose monitoring (CGM) home data.
Methods:
Forty-two healthy relatives of people with T1D with mean ± SD age of 23.8 ± 10.5 years, HbA1c (glycated hemoglobin) of 5.3% ± 0.3%, and BMI (body mass index) of 23.2 ± 5.2 kg/m2 with zero (low risk; N = 21), and ≥2 (high risk; N = 21) Ab, were enrolled in an NIH (National Institutes of Health)-funded TrialNet ancillary study. Participants wore a CGM for a week and consumed three standardized liquid mixed meals (SLMM) instead of three breakfasts. Glycemic features were extracted from two-hour post-SLMM CGM traces, compared across groups, and used in four supervised machine learning Ab risk status classifiers. Recursive Feature Elimination (RFE) algorithm was used for feature selection; classifiers were evaluated through 10-fold cross-validation, using the receiver operating characteristic area under the curve (AUC-ROC) to select the best classification model.
Results:
The percent time of glucose >180 mg/dL (T180), glucose range, and glucose CV (coefficient of variation) were the only significant differences between the glycemic features in the two groups with P values of .040, .035, and .028 respectively. The linear SVM (Support Vector Machine) model with RFE features achieved the best performance of classifying low-risk versus high-risk individuals with AUC-ROC = 0.88.
Conclusions:
A machine learning technology, combining a potentially self-administered one-week CGM home test, has the potential to reliably assess the T1D risk.
Introduction
Type 1 diabetes (T1D) is an autoimmune disease with both genetic and environmental contributions associated with a marked loss and dysfunction of the islet β cells. Damage to β cells begins months to years before symptomatic diabetes.1,2 The T1D early pathophysiology occurs in three distinct stages: the first stage is characterized by the presence of ≥2 islet autoantibodies (Ab) with normoglycemia (ie, presymptomatic), the second stage progresses to dysglycemia, and, finally, the third stage is defined by the onset of symptomatic (ie, clinical) T1D. 3 Therefore, the presence of Ab is a strong predictor of the risk of developing T1D, 4 and the majority of individuals who test positive for ≥2 Ab progress to stage 3 T1D, given enough time.3,5 However, the ability to screen for risk of T1D provides an opportunity to intervene to delay the onset of clinical symptoms and reduce future diabetes-related complications. 6
Early identification and screening or prediction of disease progression in at-risk individuals can reduce the rates of diabetic ketoacidosis (DKA) at diagnosis,7-9 improve the quality of glycemic control,10,11 and reduce other future poor health outcomes9-12 and complications. 13 Staging of T1D has proven crucial in facilitating the design of prevention trials where the oral glucose tolerance test (OGTT) is used as a biomarker. However, the OGTT-defined categories have limitations, especially when one considers the transition from stage 2 to stage 3 T1D. 14 Recently, more attention has been given to understanding the development and the role of dysglycemia during the natural history of T1D, using continuous glucose monitoring (CGM)-based metrics measured during the early stages of preclinical T1D.15,16 For example, several studies have suggested that CGM devices can be used for detecting dysglycemia and predicting the progression to stage 3 T1D. In recent studies in adolescents and children,16-19 Continuous glucose monitoring data were used for detecting early hyperglycemia and to characterize participants who progressed to stage 3 T1D with respect to the percent time they spent above 140 mg/dL. The use of the percent time spent with CGM readings >140 mg/dL has been proposed by other studies assessing those at risk for T1D. Wilson et al, 20 investigated a one-week CGM test for its ability to identify individuals at higher risk for rapid progression to stage 3 T1D, including those with a normal OGTT. This study has identified several CGM-derived metrics of hyperglycemia associated with progression to stage 3 disease. Besides that, Helminen et al 16 proved that CGM could be superior to the classical OGTT approach to detect dysglycemia. However, the number of participants was small in that study. Notably, these prior studies rely on CGM data collected over several days. Whereas here, we explore whether post-standardized liquid mixed meals (SLMM) CGM data alone can be used to predict the T1D risk.
Recently, it was shown that integrating CGM data into machine learning models could help to develop predictive models that could assist clinicians to improve the screening and treatment of diabetes. For example, a logistic regression (LR) model with glycemic variability features extracted from CGM data was used to classify individuals based on diabetes type (ie, with or without diabetes). 21 In another study, several established machine learning models for binary classification were used to classify the quality of overnight glycemic control in T1D. 22 Recently, we used a one-week CGM home test with a linear Support Vector Machine (SVM) model to classify participants’ autoantibody status (ie, antibody positive vs antibody negative). 23 The proposed machine learning methodology for using post-SLMM CGM-based glycemic features to predict whether a healthy individual is at risk to develop stage 3 T1D (low risk vs high risk), as an alternative to the standard test for islet Ab, has not been explored.
At-home testing for disease risk could help address many of the challenges regarding whom to screen for T1D risk using antibody testing. The objective of this work is to use post-SLMM CGM-based metrics to develop a (pre)screening technology to classify participants’ risk status (low risk vs high risk). The new technology uses a dedicated machine learning methodology and a potentially self-administered one-week CGM home test that includes up to three SLMM challenges.
Methods
Study Design and Data Overview
The National Institutes of Health (NIH)-funded TrialNet ancillary study (ClinicalTrials.gov registration no. NCT 02663661) was conducted from 2015 to 2019 at the University of Virginia (institutional review board protocol ID No. 18568). The study enrolled healthy relatives of individuals with T1D with zero and two or more islet Ab, who were recruited from the TrialNet Pathway to Prevention study (https://www.trialnet.org/our-research/risk-screening). Participants were those aged 12 to 45 years and who had a brother, sister, child, or parent with T1D, or were individuals aged 12 to 20 years and who had a cousin, aunt, uncle, niece, nephew, half brother, half sister, or grandparent with T1D. Among the major exclusion criteria were diagnosis of diabetes, a relevant medical condition, or being treated with medications that might interfere with the study. All participants signed an informed consent form. Participants were asked to come to the CRU (Clinical Research Unit) at the University of Virginia (UVA) for a 10-hour inpatient visit (a single 10-hour clinical test, consisting of a mixed-meal tolerance test followed by insulin-induced hypoglycemia). After the hospital visit, the participants were given a blinded Dexcom G4 Platinum CGM, which they wore for the next seven days at home. The CGM devices were calibrated according to the manufacturer’s instructions if needed. During this period, they consumed SLMM (Boost, Nestlé, and Switzerland) more than one to five minutes on three occasions to replace their breakfasts (6 mL/kg body weight to a maximum of 360 mL) and recorded its timing to link the start of the SLMMs with the CGM profiles. Using SLMM has the advantage of providing a uniform system challenge that can be easily incorporated as part of a home test procedure. In this analysis, we focus solely on the CGM home study.
The CGM-Based Glycemia Metrics
The CGM-based metrics and characterization of glycemia in the different risk groups was performed for the two-hour post-SLMM traces. The CGM traces from the participants were collected and glycemic features/metrics were extracted and computed, including MG (mean glucose); percent time of glucose >180 mg/dL (T180), >160 mg/dL (T160), >140 mg/dL (T140), >120 mg/dL (T120), <70 mg/dL (T70), and <54 mg/dL (T54); coefficient of variation (CV); range; glucose level at post-SLMM time (GSLMM), glucose level at different times (G30, G40, G60, G75, G90, and G120); minimal glucose amplitude (Gmin), maximal glucose amplitude (Gmax); time to Gmax (Tmax); slope of glucose zero to 120 minutes (S); total area under the curve (TAUC), area under the curve for the first one hour (AUC1H), area under the curve for the tail (AUCTAIL; from 60 to 120 minutes), the AUC above the baseline value at t = 0 (IAUC [incremental area under the curve]), the incremental area under the curve for the first one hour (IAUC1H), the incremental area under the curve for the tail (IAUCTAIL); the IQR (interquartile range); low blood glucose index (LBGI, measures the frequency and magnitude of hypoglycemia), high blood glucose index (HBGI, measures the frequency and magnitude of hyperglycemia); and the average daily risk range (ADRR, the sum of the daily peak risks for hypoglycemia and hyperglycemia (see Kovatchev 24 ; Table 1). Those features capture the dynamic characteristics of the post-SLMM CGM traces for each participant in the two different risk groups.
Clinical and Demographic Characteristics of Sixty Participants in the Three Different Classes of Islet Autoantibodies (Ab) Used for Analysis.
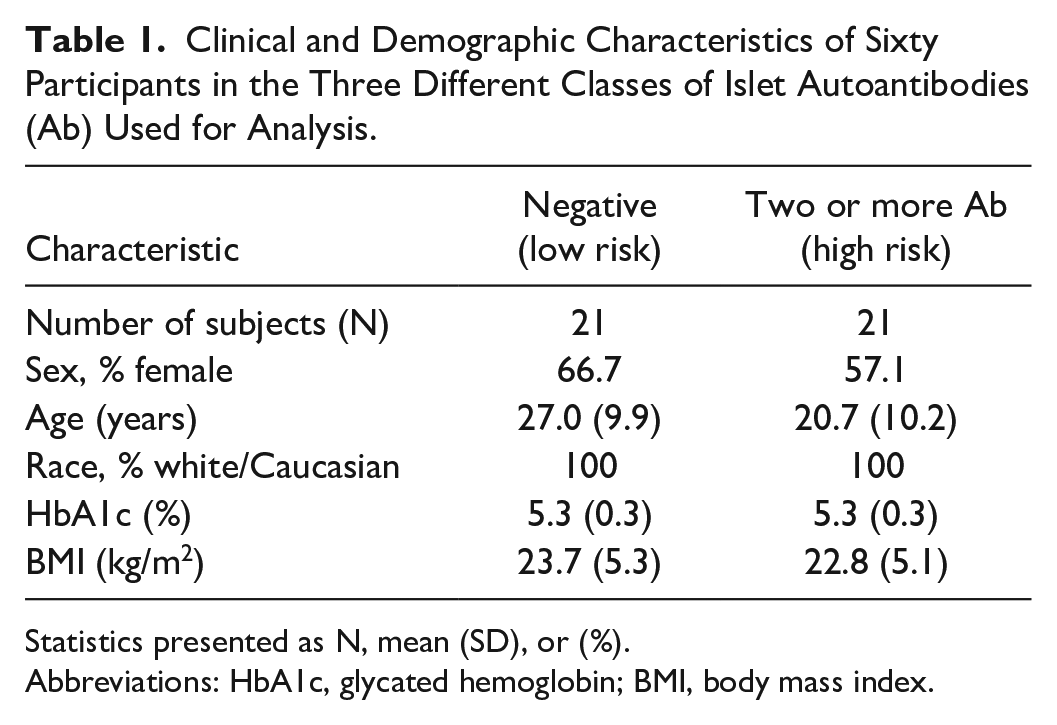
Statistics presented as N, mean (SD), or (%).
Abbreviations: HbA1c, glycated hemoglobin; BMI, body mass index.
Statistical Procedures
All statistical analyses were performed using R statistical software 4.0.5 (R Foundation for Statistical Computing). The Shapiro-Wilk test was used to check whether glycemic features follow a normal distribution. For the normally distributed variables, a one-way ANOVA (analysis of variance) followed by Fisher least significant difference post hoc test was used to compare the means between risk groups. For non-normally distributed variables, a Wilcoxon signed-rank test and the Kruskal-Wallis test were used to determine whether there are statistically significant differences between the glycemic features in different risk groups. A P value < .05 was considered to be significant.
Risk Classification
The extracted glycemic features from the two-hour post-SLMM traces were used to define different classifier models based on the risk class. Then, these features were aggregated per participant and each feature was mean-centered and scaled before entering the classification procedure. Recursive Feature Elimination with Cross-Validation (RFECV) was used as the feature selection method for this analysis to address the dimensionality issues. Furthermore, RFECV is a wrapper-type feature selection algorithm that reduces a model’s complexity by choosing significant features and removing the weaker ones. The RFE technique starts with incorporating the full feature set and proceeds to iteratively remove features that do not contribute to the accuracy of the classification until it has achieved the optimum number needed to assure peak performance. 25 Four different classification models were used to develop an Ab classifier and define the best classifier model, namely, linear discriminant analysis (LDA), SVM, LR, and K-nearest neighbors (KNN).26,27 For all methods, the Caret function used to build the classifiers was used with default tuning parameters.
A 10-fold cross-validation technique was implemented in this analysis. The entire data set of 30 glycemic features from all participants is aggregated per participant and is randomly shuffled. Then, it was subdivided into 10 approximately equal-sized folds. One of the 10 folds was used as a test set to evaluate classification performance, whereas the remaining nine folds were used to train the classifier models with the optimal features. The procedure was repeated 10 times to estimate the mean performance of the different classifier models. To guarantee that data from each participant appears either in the training or in the test set, steps were taken to avoid overfitting and to improve the generalizability of the results.
Classification Performance Assessment
To assess the performances of classifier models, a confusion matrix was used to report the four possible outcomes of the comparison between the true and the predicted class, that is, TN (true negative), FN (false negative), true positive (TP), and false positive (FP). The receiver operating characteristic area under the curve (AUC-ROC) was used to select the best performing classifier models; AUC-ROC is a numerical index that depicts the trade-off between the sensitivity (ie, true-positive rate) and 1-specificity (ie, false-positive rate) across a series of different cutoff points, which are given by
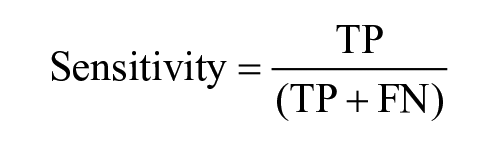
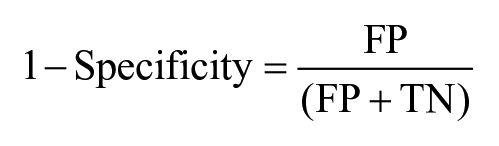
The closer the AUC-ROC value to 1, the better the classifier model at distinguishing between low-risk versus high-risk participants.
Results
Demographic Characteristics
Table 1 shows the clinical and demographic characteristics of the data sets under analysis. A total of 42 participants completed the CGM study and were included in the analysis. They had a mean ± SD age of 23.8 ± 10.5 years, HbA1c of 5.3% ± 0.3%, and body mass index (BMI) of 23.2 ± 5.2 kg/m2. Twenty-one participants had zero (low-risk group) and the other 21 participants had two or more islet Ab (high-risk group). There were no statistically significant differences between the two groups with regard to age, HbA1C, and BMI.
Characterization of Glycemia of the Two Risk Groups
The post-SLMM CGM traces (n = 108) for 120 minutes (ie, 51 CGM low-risk traces, and 57 high-risk traces) were extracted from 38 participants (18 participants in the low-risk group and 20 participants in the high-risk group). Four participants were excluded from the analysis (three participants from the negative group, low risk, and one participant from ≥2 Ab group, high risk): three of them had breakfast after all SLMM, and one had breakfast 30 minutes before all SLMM. A total of 86.8% of those participants completed all three SLMM loads, 10.5% only did two sessions, and 2.6% only completed one session. Figure 1 shows the single ambulatory glucose profile (AGP) visual display in the two different groups of risk. The high-risk group appears to have a higher post-SLMM peak, as well as a different distribution of CGM traces than the low-risk group.
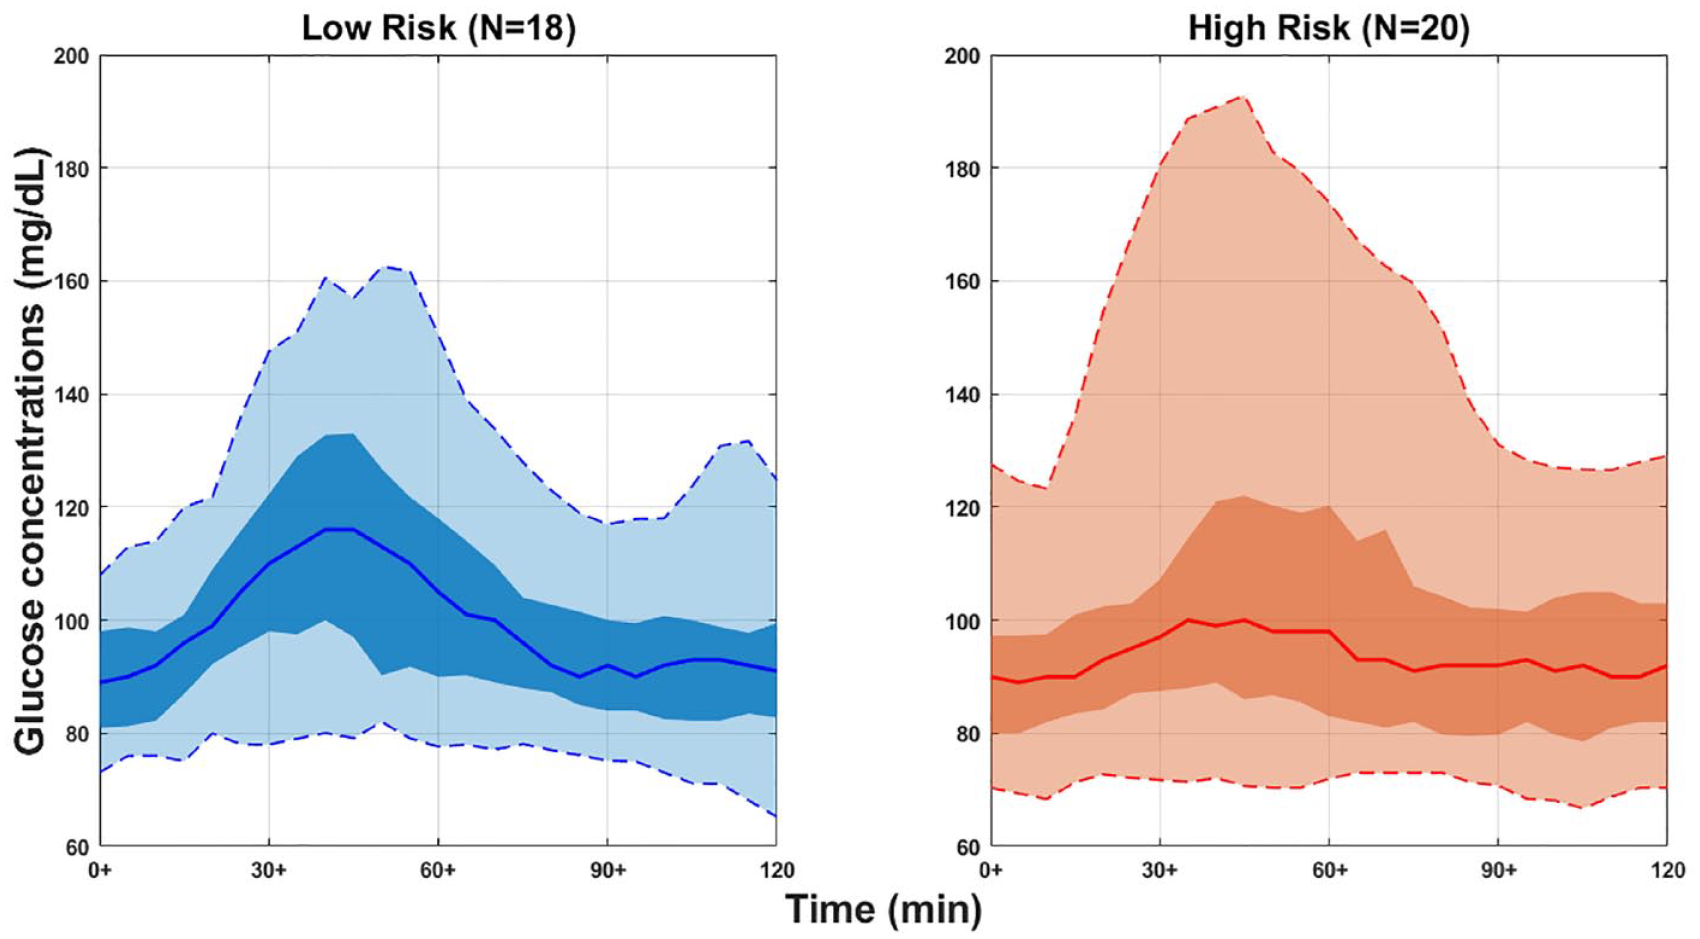
Represents a panel of CGM traces of two-hour post-SLMM for 38 participants in the two different groups of risk aggregated to create a single ambulatory glucose profile (AGP) as a visual display in different risk groups (ie, low risk vs high risk). The solid line in each risk group is the median or 50% line; half of all CGM values are above and half are below this value. The 25th and 75th percentile curves shaded in dark blue/red/black represent the interquartile range or 50% of all CGM values. The dashed outer lines (the 5th to 95th percentile curves) indicate that only 5% of CGM readings were above or below these values. “N” represents the number of participants in each group.
For the computed 30 glycemic features (see “Methods” section), there were no statistically significant differences between the two risk groups except for T180 with P = .040, CGM range with P = .035, and CGM CV with P = .028, as shown in Figure 2. Therefore, the two-hour post-SLMM CGM traces revealed different glycemic patterns among risk groups only through T180, range, and CV, with higher median range and CV values in the low-risk group than in the high-risk group (ie, CGM range, 45.8 mg/dL vs 33.5 mg/dL; CGM CV, 14.1 mg/dL vs 9.4 mg/dL). As well, the median Gmax in the low-risk group was higher than the high-risk group (127.7 mg/dL vs 114.2 mg/dL), but not statistically significant different (P = .077). Moreover, the median IQR in the low-risk group was higher than the high-risk group (20.1 mg/dL vs 12.8 mg/dL), but not significantly different (P = .096). In addition, the median G40 in the low-risk group was higher than the high-risk group (121.4 mg/dL vs 99.0 mg/dL), but not significantly different (P = .165), as shown in Figure 2.
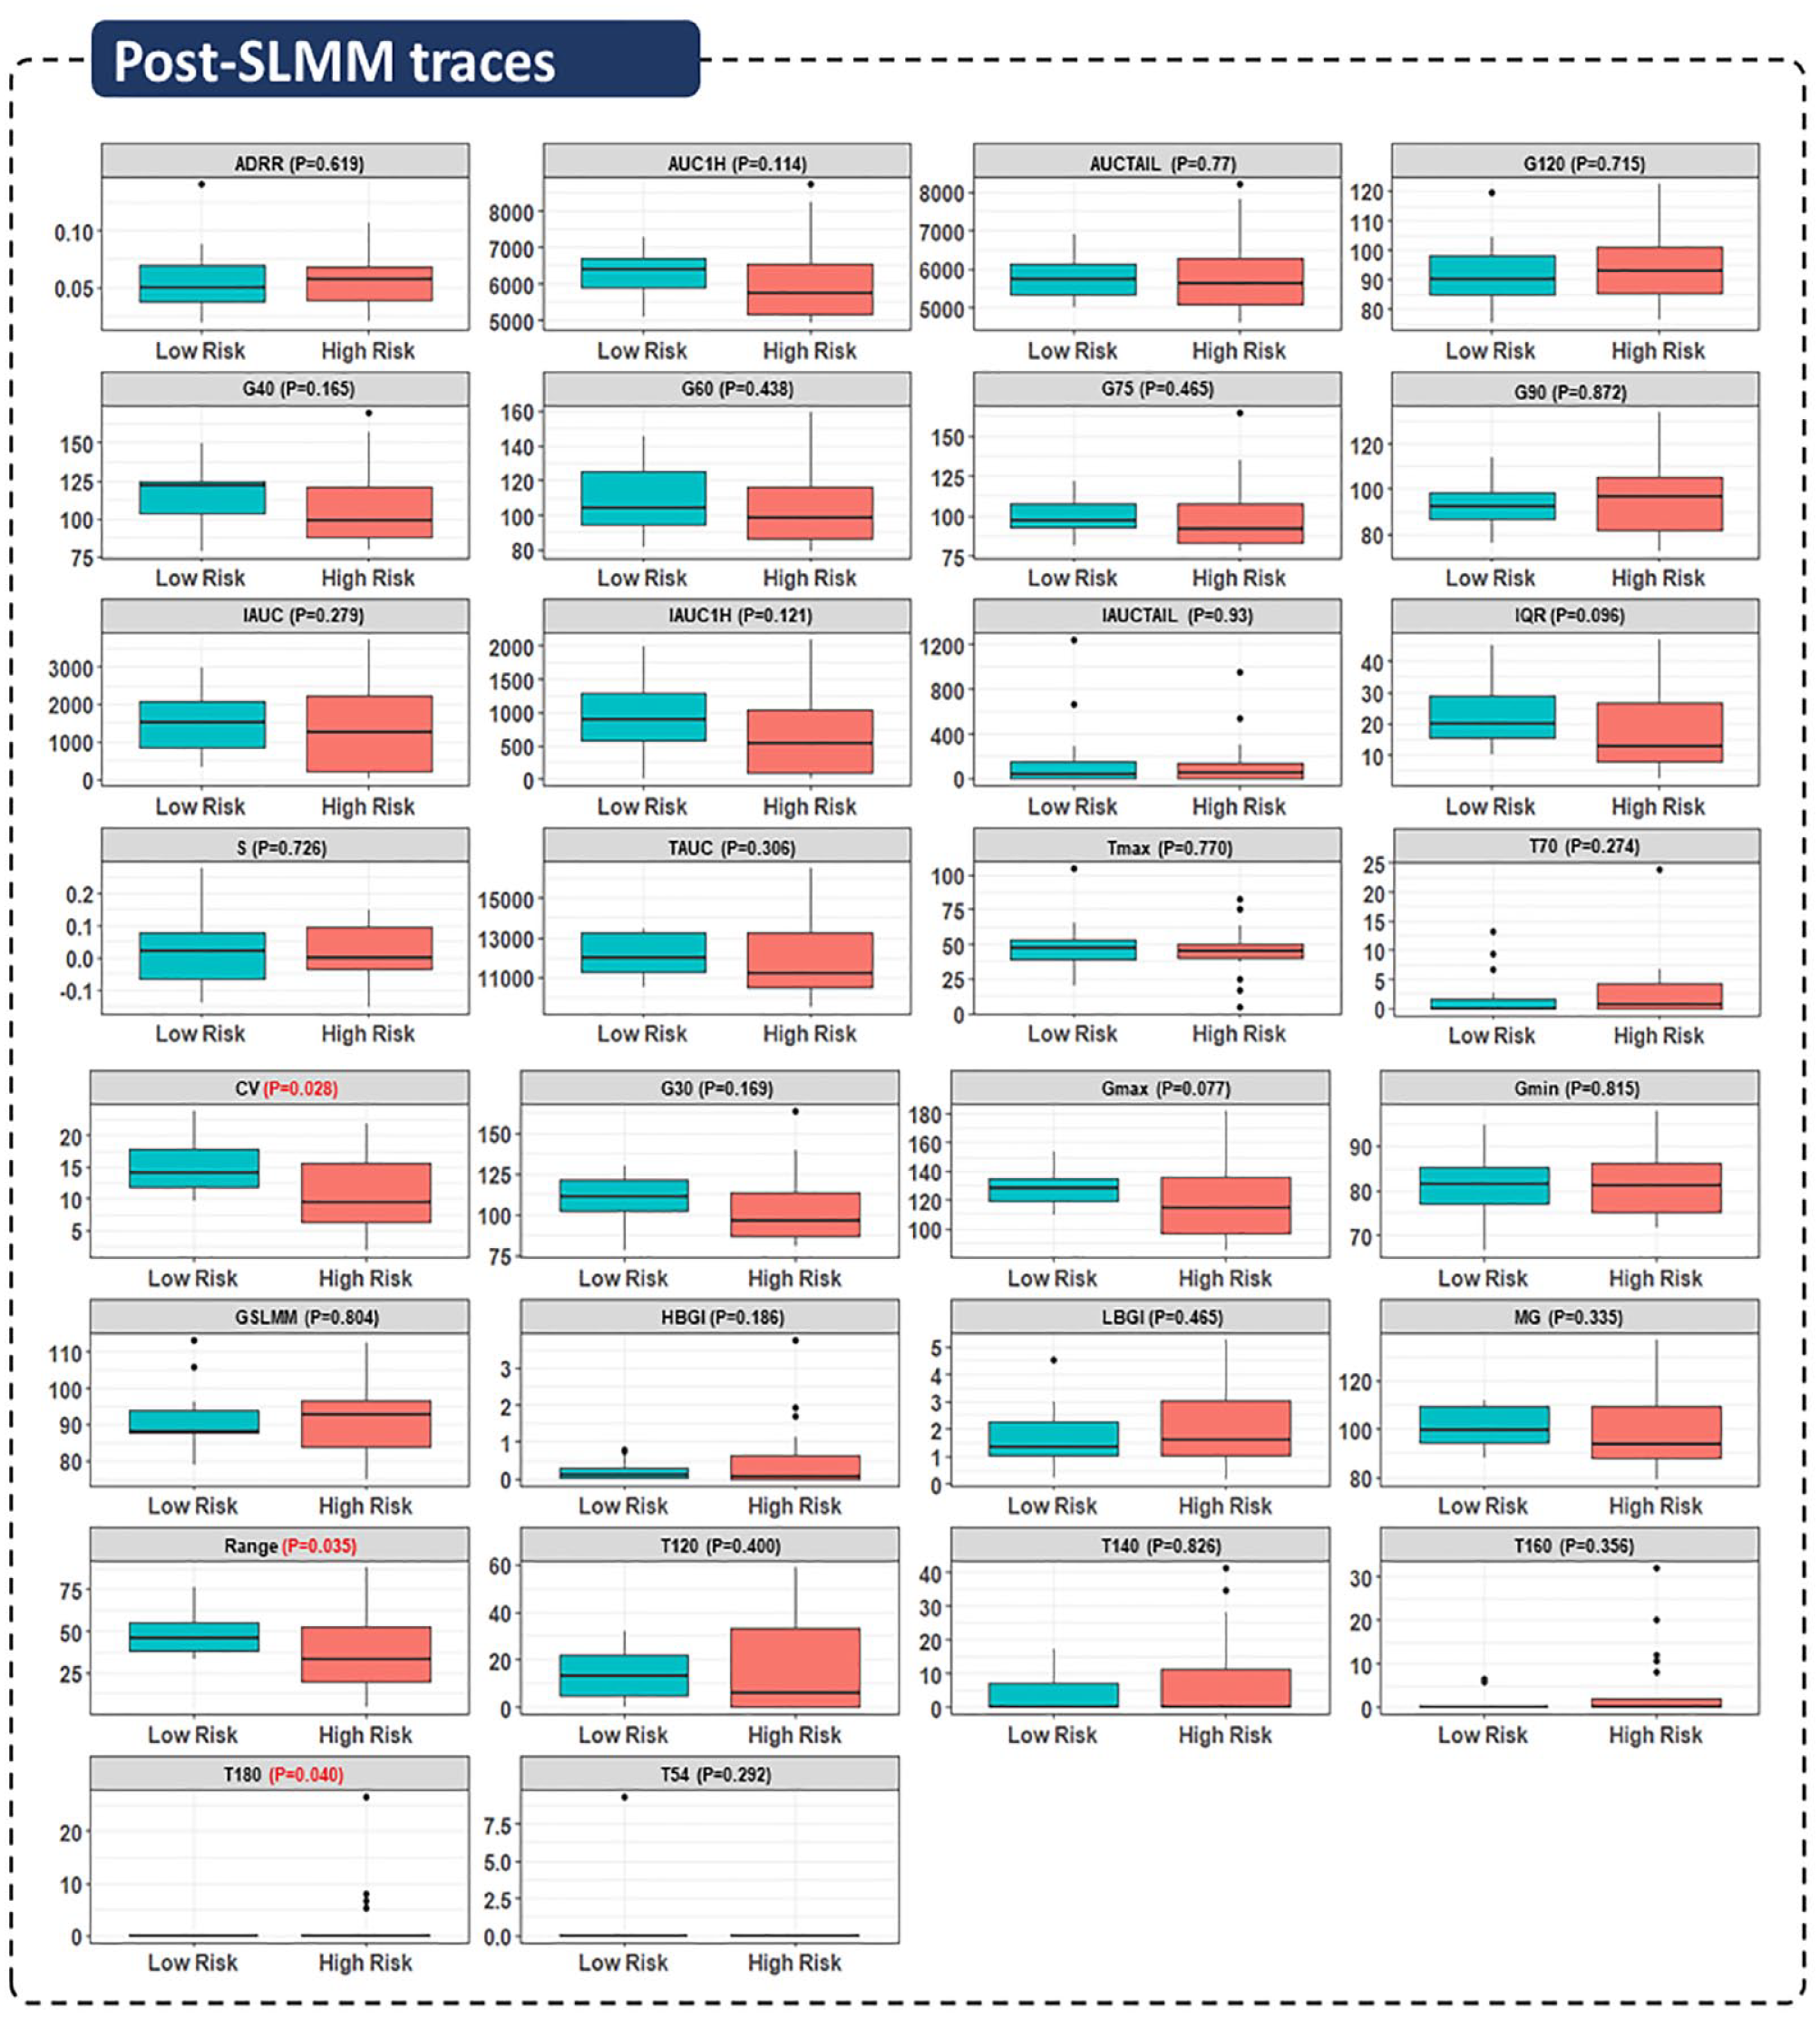
Characterization of post-SLMM CGM data through different glycemic features. Boxplots for 30 features extracted from 120-minute post-MMTT CGM traces for 38 participants in the two different groups of risk.
Defining Classifier Models Based on the Low-Risk Versus High-Risk Groups
Figure 3 shows the number of optimal features given by the RFECV approach as five features that correspond to the higher accuracy value. That is, T160, IQR, range, CV, and Gmax were the most significant features that can capture the variability and dysglycemia in the two risk groups. The four binary classifier models with a 10-fold cross-validation technique were implemented with the RFE features (ie, the optimal features) to classify participants in terms of low risk versus high risk. A linear SVM classifier model outperformed the other classifier models with a mean AUC-ROC of 0.88. The LR model was the worst performer with a mean AUC-ROC of 0.73, and the mean AUC-ROC for LDA and KNN were very close, 0.76 and 0.79 respectively, as shown in Table 2.
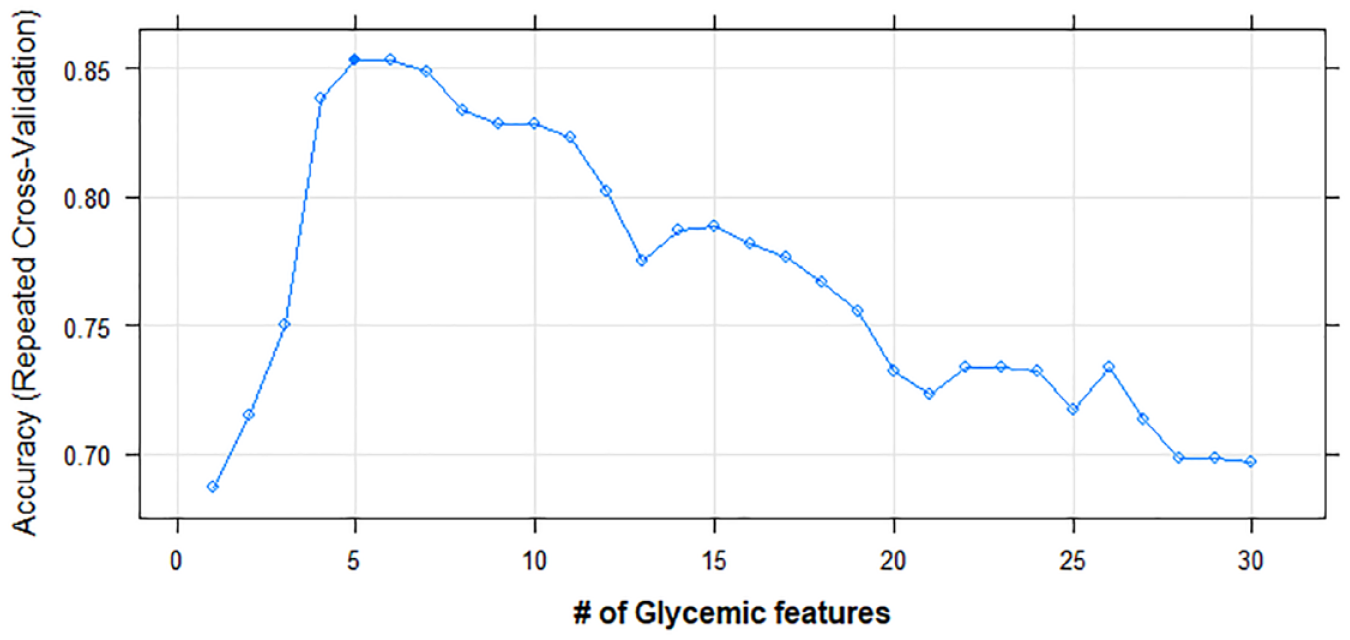
The most optimal features from the set of features given by RFECV approach. The most suitable features for prediction are CV, range, T160, Gmax, and IQR. The dark square indicates the optimal number of features that correspond to the higher accuracy value.
Comparison of Classification Performance of Four Models in Terms of AUC-ROC Based on Different Classes of Risk (ie, Low Risk Versus High Risk) Through Selected Features by Recursive Feature Elimination (RFE) Algorithm of the Extracted Glycemic Features From Two-Hour Post-SLMM CGM Traces.
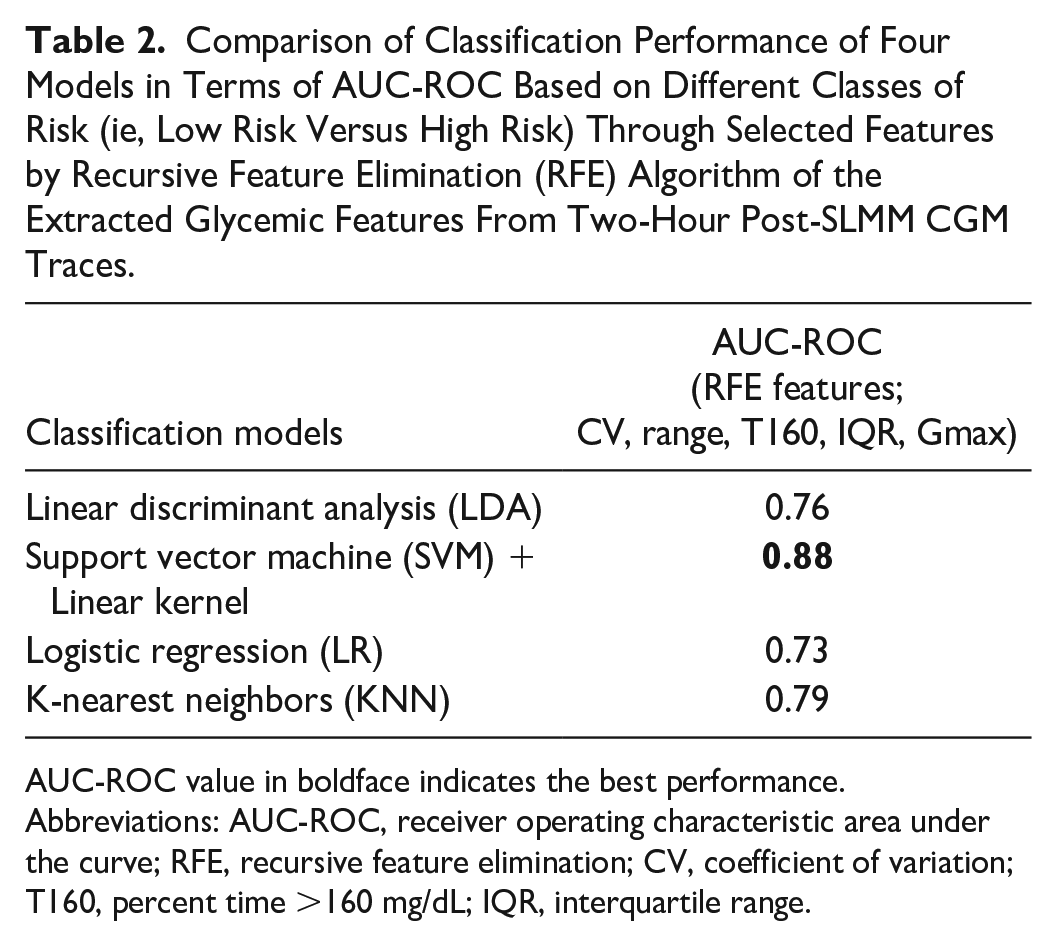
AUC-ROC value in boldface indicates the best performance.
Abbreviations: AUC-ROC, receiver operating characteristic area under the curve; RFE, recursive feature elimination; CV, coefficient of variation; T160, percent time >160 mg/dL; IQR, interquartile range.
Discussion
In this work, we used data from a recent NIH-funded TrialNet ancillary study using relatives of people with T1D aged 12 to 42 years to characterize the extent to which features derived from a one-week CGM home test can stratify individuals with different numbers of T1D-specific Ab (ie, Zero and two or more Ab). The post-SLMM periods T180, range, and CV were statistically significant differences between the two risk groups. We note the difference between our study, which focuses solely on the post-SLMM periods, and previous studies, which use the entire CGM trace. In these studies, it was demonstrated that the best predictors associated with higher risk of progression to stage 3 were based on a percent time with CGM readings ≥140 or 160 mg/dL. For example, in Steck et al’s study, 17 the participants who progressed (35% of 14 autoantibody-positive) to stage 3 T1D were characterized by a higher percent time with CGM values ≥140 mg/dL and a higher daytime glucose AUC. Moreover, Steck et al 18 reported that the best predictor of progression was ≥18% of the time at CGM ≥140 mg/dL. Furthermore, the same authors demonstrated in a larger study that spending more than 10% of the time at CGM readings >140 mg/dL is associated with a higher risk of progression to T1D within one year. 19 Helminen et al 16 reported that children in the autoantibody-positive group had higher percent time with CGM readings ≥140 mg/dL (5.8% vs 0.4%) and mean seven-day sensor glucose (97.2 mg/dL vs 84.6 mg/dL). Wilson et al 20 reported that spending ≥5% or 8% time with glucose levels ≥140 or 160 mg/dL, is associated with progression to stage 3 T1D. This study also found that stage 2 participants and those who progressed to stage 3 exhibited higher mean daytime glucose values, spent more time with glucose ≥120, 140, and 160 mg/dL, and had greater glycemic variability. In addition, HbA1c was used as a useful biomarker when predicting the time to diagnosis of T1D in children with two or more Ab. 28 Besides that, different parameters were used to develop a risk score that improves prediction such as age, BMI, and measures of insulin and glucose during OGTT (DPTRS [Diabetes Prevention Trial-Type 1 Risk Score]). 29 In addition, genetic risk score (GRS) was used to predict progression to T1D and identify individuals at risk of developing T1D. 30 Importantly, our results demonstrate that different features can also be associated with T1D risk if the CGM home test is performed with the addition of a SLMM.
The data collected during the home CGM study and the derived metrics allowed also the use of machine learning to develop a risk status classifier. Notably, features based on the post-SLMM CGM traces were able to classify with high accuracy the low-risk versus high-risk participants, by using the RFE-SVM model with high accuracy (ie, AUC-ROC = 0.88). The method employed in this work’s FRE-feature selection played an important role to improve the classification accuracy through the optimal extracted features. Those features have contributed to improving the model accuracy and have helped to avoid multicollinearity. Although our technology is not tailored to stratify progressors to stage 3 from non-progressors, it identifies new metrics (RFE-features) derived from the post-SLMM CGM periods that can be explored to estimate the imminent risk for progression to stage 3 T1D.
The proposed CGM home test can be self-administered after a carefully designed interactive online teaching session and would not require a visit to a medical lab. Therefore, it could be used as an alternative or in addition to the self-collected capillary blood Ab test currently employed by TrialNet. 31 It can provide additional information on the level of dysglycemia that cannot be obtained by a single-finger stick for autoantibody presence or a genetic test. Ultimately, this could provide insight into the onset of therapy, potentially avoiding cases of DKA and highlighting individuals who could benefit from future immune-modulatory interventions such as teplizumab. 32 Limitations of the current exploratory study are mostly related to the limited population of volunteers who have relatives with T1D and are of ages between 12 and 42 years, which prevents us from performing more rigorous and detailed analysis on key technology aspects (eg, model selection, alternatives to the chosen SLMM). As our sample size is small, we have a limited number of CGM days available for CGM-based characterization of glycemia. We also lack more detailed information on the Ab (eg, type, persistence). Moreover, the data were collected with the Dexcom G4 Platinum CGM, rather than the more advanced G6 or G7 model typically used in recent studies. Finally, using an independent large sample with ethnic diversity in a future study will be needed to confirm the performance of our model and the predictive power of the selected features.
Conclusion
In this exploratory study, we show that the presence of dysglycemia, as identified by post-SLMM CGM-based metrics, may identify those with a heightened risk of progression to stage 3 T1D and may lead to a deeper understanding of dysglycemia during the natural history of T1D. Using machine learning further allowed the development of a method to distinguish CGM patterns between individuals with low risk versus high risk, based on an assessment performed at home. If applied broadly, this approach could help improve T1D risk detection and help to identify early stage T1D before symptoms occur, potentially alerting individuals for early diagnosis or prevention.
Footnotes
Acknowledgements
The authors would like to thank the University of Virginia (UVA) Center for Diabetes Technology Data Team for organizing the CGM home study data, and the TrialNet Coordinating Center for assistance with recruitment of the autoantibody-positive participants.
Abbreviations
Ab, autoantibodies; ADRR, average daily risk range; AGP, ambulatory glucose profile; AUC-ROC, the receiver operating characteristic area under the curve; BMI, body mass index; CGM, continuous glucose monitoring; CV, coefficient of variation; DKA, diabetic ketoacidosis; FN, false negative; FP, false positive; Gmax, maximal glucose amplitude; Gmin, minimal glucose amplitude; HbA1c, glycated hemoglobin; HBGI, high blood glucose index; IAUC, incremental area under the curve; IQR, interquartile range; KNN, K-nearest neighbors; LBGI, low blood glucose index; LDA, linear discriminant analysis; LR, logistic regression; MG, mean glucose; OGTT, oral glucose tolerance test; RFE, recursive feature elimination; RFECV, recursive feature elimination with cross-validation; S, slope of glucose zero to 120 minutes; SLMM, standardized liquid mixed meals; SVM, support vector machine; T1D, type 1 diabetes; T120, percent time >120 mg/dL; T140, percent time >140 mg/dL; T160, percent time >160 mg/dL; T180, percent time >180 mg/dL; T54, percent time <54 mg/dL; T70, percent time <70 mg/dL; Tmax, corresponding time to the maximal glucose amplitude; TN, true negative; TP, true positive.
Declaration of Conflicting Interests
The author(s) declared the following potential conflicts of interest with respect to the research, authorship, and/or publication of this article: E.M. has nothing to declare. S.A.B. declares research support handled by the University of Virginia by Dexcom, Insulet Corporation, Roche Diagnostics USA, Tandem Diabetes Care, and Tolerion. M.D.D. declares research support handled by the University of Virginia by Dexcom and Tandem Diabetes Care. L.S.F. declares research support handled by the University of Virginia by Dexcom and Novo Nordisk.
Funding
The author(s) disclosed receipt of the following financial support for the research, authorship, and/or publication of this article: This study was supported by an NIH DP3DK106907 (NIH-funded TrialNet ancillary study), Commonwealth Research Commercialization Fund (CRCF) Award MF20-007-LS, and Helmsley Charitable Trust (grant no. 2204-05134), Juvenile Diabetes Research Foundation (JDRF) Award 2-SRA-2022-1260-S-B. The Type 1 Diabetes TrialNet Study Group is a clinical trials network funded through a cooperative agreement by the National Institutes of Health (NIH) through the National Institute of Diabetes and Digestive and Kidney Diseases (NIDDK), the National Institute of Allergy and Infectious Diseases (NIAID), the Eunice Kennedy Shriver National Institute of Child Health and Human Development, and JDRF. The contents of this article are solely the responsibility of the authors and do not necessarily represent the official views of the NIH or the JDRF.