
Abstract

Keywords
Diabetes glycemic assessment may be represented with a single metric, such as HbA1c or proportion of time spent in a specified glucose range. Composite metrics have been developed to more broadly incorporate several glucose outcomes, aiming to summarize overall glycemia and glycemic variability. 1 The Glycemia Risk Index (GRI) is a novel continuous glucose monitoring (CGM)-based composite metric summarizing overall glycemia based on 2 components—1 relating to hypoglycemia (weighting very-low glucose more than low glucose) and 1 relating to hyperglycemia (weighting very-high glucose more than high glucose), with the former component more heavily weighted. 2 Lower GRI score equates to less risk. Compared with other published CGM-based composite metrics, GRI can be calculated simply, without specialized software, by using data from standard CGM reports.
Automated insulin delivery (AID) systems have improved glycemia, compared with conventional insulin therapy, in randomized trials and real-world studies.3-5 A study assessing effects of AID among individuals with high hypoglycemia rates found GRI was sensitive to the improvement in hypoglycemia observed with AID intervention. 6 Correlations between CGM-based composite metrics and standard glucose metrics with changes in diabetes treatment need further evaluation to determine their suitability for clinical use.
We conducted a retrospective, real-world, observational study across 5 clinical sites in Australia, studying all adults with type 1 diabetes who commenced first-generation AID systems. 5 Ninety-four individuals were observed for 6 to 24 months post-AID initiation, with n = 60 having CGM data available for analysis. Glycemic outcomes assessed included standard glucose metrics and the GRI. A linear mixed-effects model (with unstructured covariance) was used to evaluate GRI changes over time; participants were entered as random effect and time was entered as fixed effect.
After AID initiation, early improvements were observed in HbA1c, CGM time in range (70–180 mg/dL) and time above 180 mg/dL, maintained for up to 24 months (all P < .02). 5 Continuous glucose monitoring time below 70 mg/dL was low pre-AID among this cohort, and remained low post-AID initiation. The percentage of individuals with GRI in Zones A and B increased from 43% pre-AID to above 65% at all timepoints post-AID initiation (Figure 1a). Mean GRI score improved from 45 (SD 20) pre-AID to between 31 and 36 at all timepoints post-initiation (all P < .001). The absolute decrease in GRI was between 9 and 13 percentage points at all timepoints (mean change −13.0 [95% CI: −15.9 to −10.2] at 1-month post initiation and −8.7 [−11.9 to −5.5] at 12 months post initiation). All GRI improvement post-AID initiation was attributable to improvement in the hyperglycemic component (relative decrease ~30%, sustained over 24 months; all P < .001); the hypoglycemia component was unchanged (Figure 1b). At 12 months post-AID initiation, when time in range improved by mean 8.1 percentage points (95% CI: 5.5–10.7; Z-score 6.1; P < .001), 5 the GRI had equivalent sensitivity to treatment effect (Z-score −5.4).
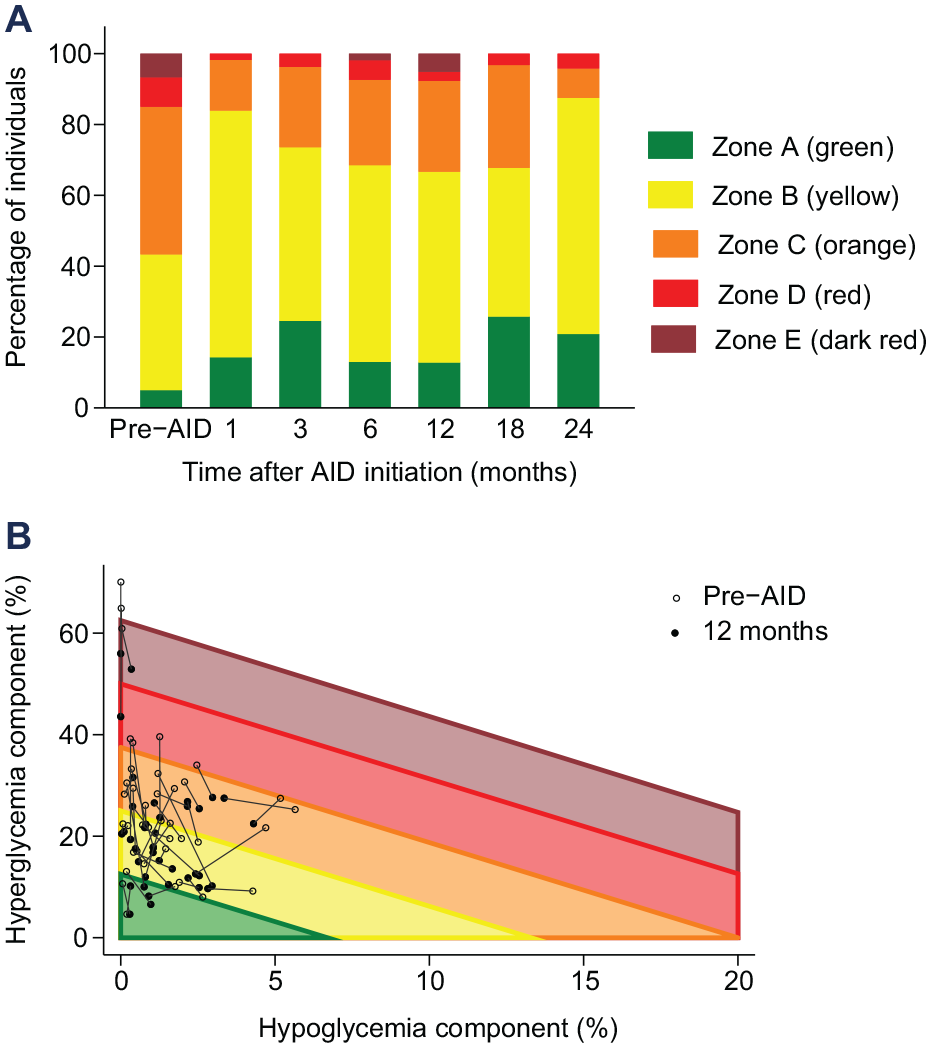
Changes observed in GRI after AID initiation. (a) Percentage of individuals within each GRI score quintile at the 7 assessed timepoints. (b) GRI results for each individual, by GRI component, pre-AID initiation paired with 12 months post-AID initiation. Abbreviations: GRI, Glycemia Risk Index; AID, automated insulin delivery.
After AID initiation, the observed improvements in total GRI score and GRI hyperglycemia component mirrored the improvements seen in standard measures of overall glycemia and hyperglycemia. With the glycemia improvement post-AID initiation predominantly being less time spent with high glucose levels, both the time in range metric and the hyperglycemia component of GRI thereby improved. Whereas the more heavily weighted hypoglycemia component of GRI was unchanged post-AID initiation in the setting of no change in CGM time below 70 mg/dL. Therefore, in contrast to AID intervention effects among individuals with excessive time in hypoglycemia reported by Benhamou and colleagues, 6 GRI was not more sensitive to AID-initiation effects than time in range amongst the present cohort. These results are the first to demonstrate the sensitivity of GRI to AID-initiation effect in the real world. Evaluation of GRI in cohorts with higher hypoglycemia rates, with the initiation of other diabetes therapeutics, and examination of its relationship with diabetes-related complications, would further assist with evaluating the role of GRI utility in clinically summarizing glycemia.
Footnotes
Abbreviations
AID, automated insulin delivery; CGM, continuous glucose monitoring; GRI, Glycemia Risk Index.
Declaration of Conflicting Interests
The author(s) declared the following potential conflicts of interest with respect to the research, authorship, and/or publication of this article: L.E.D. reports holding shares in Medtronic and Novo Nordisk. S.A.M. reports receiving speaker honoraria from Eli Lilly Australia, Roche Diabetes Care Australia and Sanofi-Aventis Australia; serving on advisory boards for Medtronic and Ypsomed; facilitating workshops for the Australian Diabetes Society; and that her institution has received support for research from Medtronic. No other potential conflicts of interest were reported.
Funding
The author(s) disclosed receipt of the following financial support for the research, authorship, and/or publication of this article: St Vincent’s Hospital (Melbourne) Research Endowment Fund. S.A.M. is supported by a University of Melbourne Paul Desmond Clinical Research Fellowship.