
Abstract
Background:
Accurate glucose monitoring is vitally important in neonatal intensive care units (NICUs) and clinicians use blood glucose monitors (BGM), such as the Inform II, for bedside glucose monitoring. Studies on BGM use in neonates have demonstrated good reliability; however, most studies only included healthy-term neonates. Therefore, the applicability of results to the preterm and/or ill neonate is limited.
Objectives:
In preterm and ill neonates, quantify differences in glucose concentrations between (1) capillary glucose (measured by BGM) and arterial glucose (measured by YSI 2300 Stat Plus) and (2) between aliquots from the same arterial blood sample, one measured by BGM versus one by YSI.
Design/Methods:
Forty neonates were included in the study. Using Inform II, we measured glucose concentrations on blood samples simultaneously collected from capillary circulation via heel puncture and from arterial circulation via an umbilical catheter. Plasma was then separated from the remainder of the arterial whole blood sample and a YSI 2300 Stat Plus measured plasma glucose concentration.
Results:
The dominant majority of arterial BGM results met the Clinical and Laboratory Standard Institute (CLSI) and Food and Drug Administration (FDA) tolerance criteria. Greater discrepancy was observed with capillary BGM values with an average of 27.5% of results falling outside tolerance criteria.
Conclusions:
Blood glucose monitor testing provided reliable results from arterial blood. However, users should interpret hypoglycemic results obtained from capillary blood with caution.
Introduction
Glucose monitoring is vitally important in the neonatal intensive care unit (NICU) as dysglycemia during the neonatal period is associated with adverse neurodevelopmental outcomes.1-4 Neonatologists can measure glucose concentrations from multiple sources including whole blood and plasma samples drawn from the arterial, venous, or capillary circulations. Lab-based measurement of glucose using plasma recovered from whole blood is considered the most reliable. For this reason, physicians use lab-based glucose measurements when the clinical context demands the greatest accuracy. 5 However, in many clinical settings including the NICU, clinicians often use blood glucose meters (BGM) for convenience. These devices require small volumes of whole blood (<1.0 µL) rather than plasma. Despite frequent use in the neonatal population, the ACCU-CHEK Inform II (Roche Diagnostics, Indianapolis, IN) was originally optimized for use in adults. Although studies in adults suggest BGM measurements of whole blood glucose samples are sufficiently accurate when compared with lab-based plasma glucose reference measurements, 6 important hematologic differences between adults and critically ill neonates warrant further consideration.
Glucose transport across the red blood cell (RBC) membrane is mediated by GLUT 1 and GLUT 4 transporters and glucose concentrations between the plasma water and the RBC cytoplasm are relatively similar, though a small difference may be present due to glycolysis occurring within the RBC. 7 However, as illustrated in Figure 1, the relative distributions of the aqueous and solid phases differ between plasma and the RBC cytoplasm.8,9 Because glucose is only distributed within the aqueous phase of both spaces, the relative amount of plasma and RBC volumes (ie, the hematocrit) ultimately influence the glucose concentration in the whole blood. Whereas BGM are calibrated within the normal range of adult hematocrit, the neonatal hematocrit is typically higher than adult hematocrit levels. This difference may increase the risk that BGM devices would incorrectly estimate plasma glucose levels. Additional clinical conditions that can affect the reliability of Inform II include hypoglycemia (frequently observed in neonates), dehydration, shock, and poor tissue perfusion.5,10,11 In these conditions where peripheral circulation is impaired, manufacturer and regulatory agency guidelines recommend against capillary sampling for BGM measurement. 5
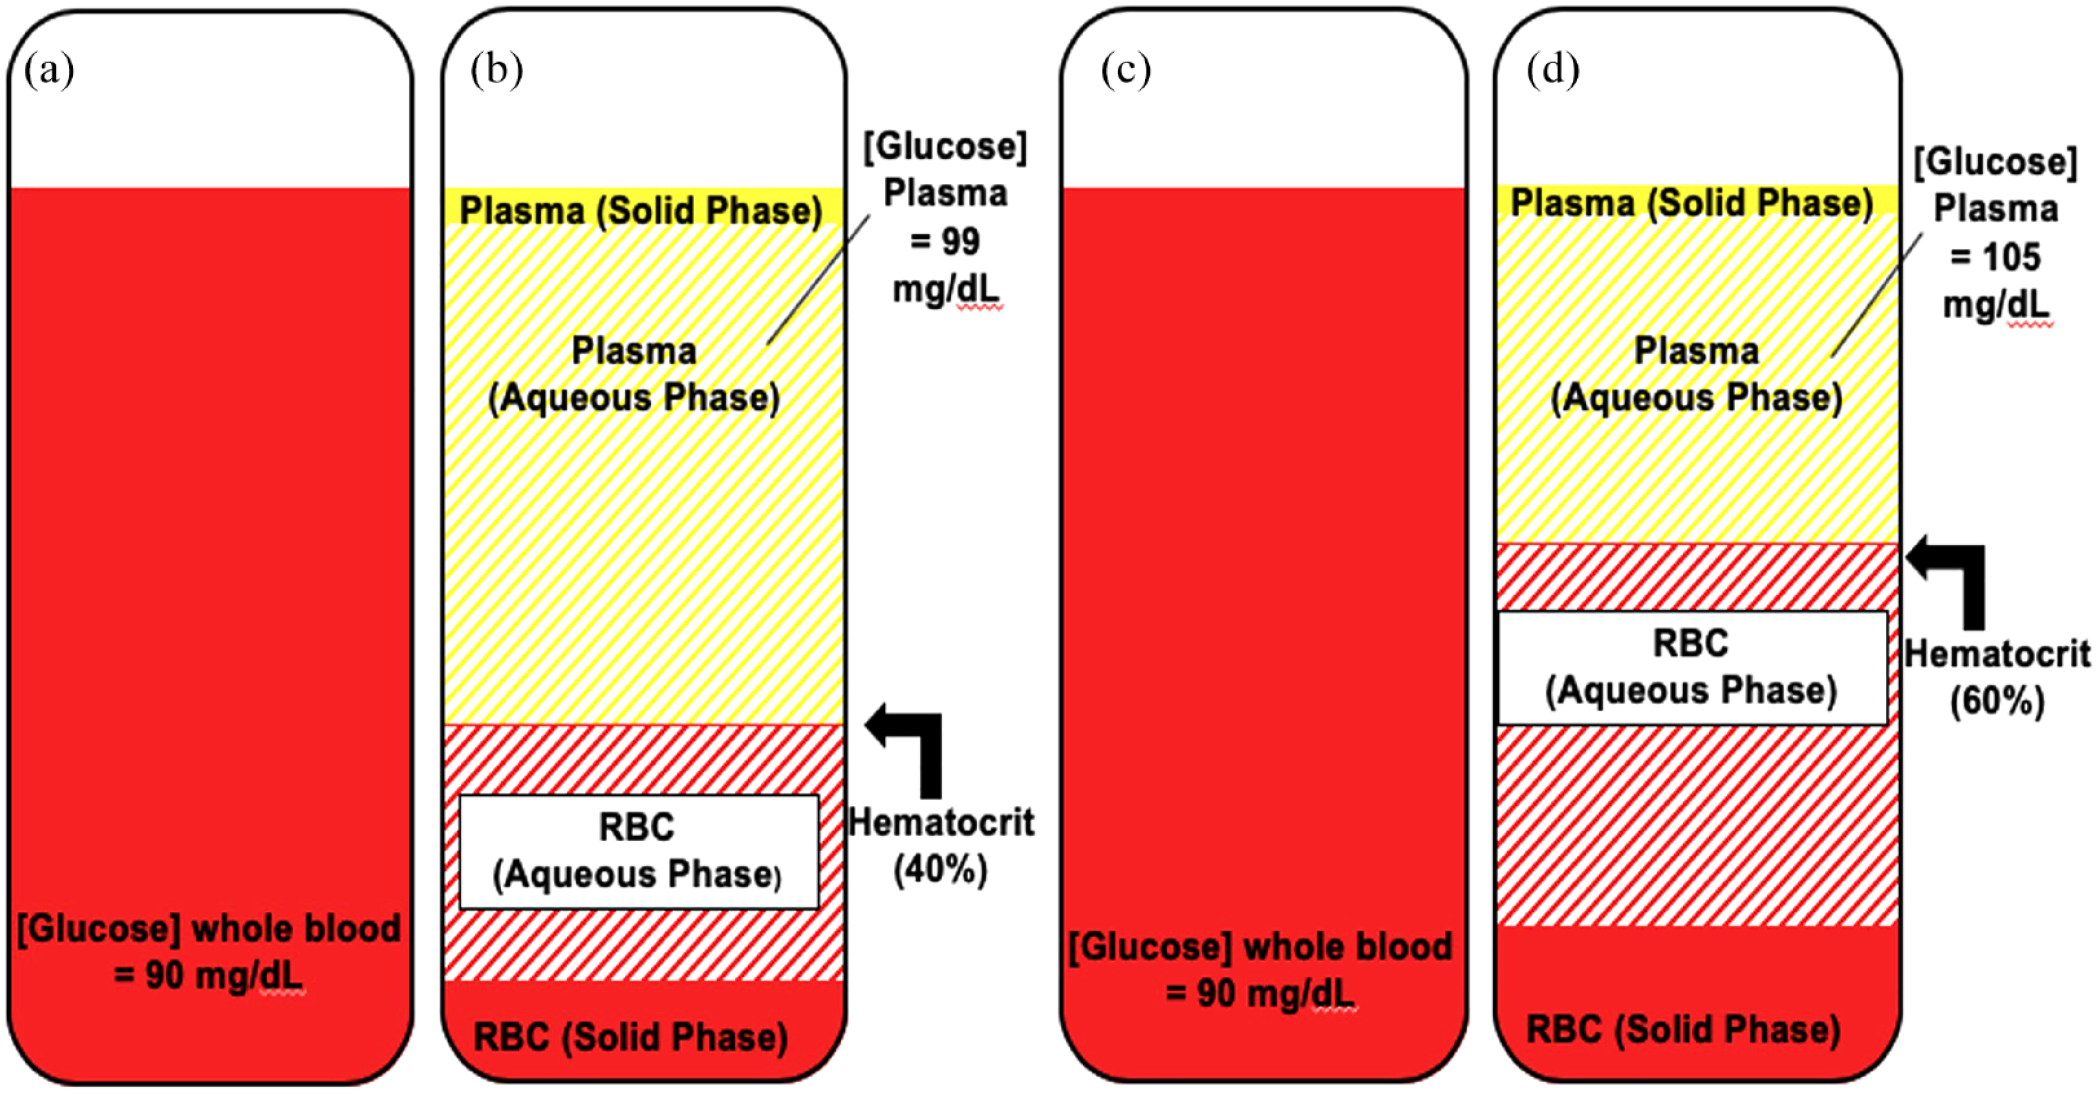
Impact of hematocrit on plasma glucose as compared with whole blood glucose. Vials (a, c): whole blood glucose in adult and neonate. Vial (b): plasma glucose in the adult sample with a hematocrit of 40%. Vial (d): plasma glucose in neonate with a hematocrit of 60%.
Although physicians commonly utilize umbilical catheters for central vascular access soon after birth, these catheters may expose neonates to the risk of infection, bleeding, thrombosis, and vessel damage resulting in extravasation. Due to these risks, experts currently recommend removing umbilical artery and umbilical venous catheters within 6 and 14 days of insertion, respectively. 12 Though neonatologists will often place a peripherally inserted central catheter (PICC) at this point, the small diameter required to fit neonatal vessels prohibits blood sampling from these catheters. Moreover, repeated venous or arterial puncture for glycemic monitoring in these medically fragile neonates is difficult and unsafe. Thus, hospital staff will often sample from heel capillaries to measure glucose on BGM when peripheral circulation is impaired despite manufacturer and regulatory agency guidance to the contrary.
Whereas BGM are frequently used in neonates, previous studies have focused on healthy, term babies.13-17 Critically ill neonates were underrepresented in these investigations. Only one study, conducted in healthy term newborns, used Inform II, a meter commonly employed in the inpatient setting. 13 Therefore, it is unclear whether clinicians should extrapolate these results to the preterm and/or ill neonate.
Because clinicians in the NICU often must rely on capillary blood obtained from the heel for glucose monitoring, the purpose of this study is to quantify differences between simultaneously collected capillary and arterial glucose concentrations in preterm or ill neonates. We utilized the Inform II BGM for capillary glucose testing to best represent how glucose monitoring is performed in the NICU. We also measured arterial glucose on the YSI 2300 STAT Plus, using this machine as a comparative reference method for glucose testing. We used glucose obtained from arterial blood for comparison as it represents the glucose concentration of the blood being delivered to vital organs. In addition, we quantified differences in glucose concentrations between aliquots from the same arterial blood sample, one measured by Inform II versus one by YSI. We hypothesized that characteristics common to preterm and ill neonates including poor tissue perfusion and abnormal hematocrit would result in clinically important differences between glucose concentrations measured from a central vessel (the umbilical artery) versus from peripheral capillary circulation.
Materials and Methods
Hospital Setting, Enrollment Criteria, and Participant Recruitment
We studied neonates in the level IV NICU at Monroe Carell Jr. Children’s Hospital at Vanderbilt, whose Institutional Review Board approved the research protocol (IRB #201920). Parental informed consent was obtained for all enrolled neonates. Recruitment occurred from July 2021 to April 2022. Neonates were eligible for study inclusion if they were admitted to the NICU and had an umbilical artery catheter or if the medical team planned to insert an umbilical artery catheter. Exclusion criteria included receiving end-of-life care and/or having an active Do Not Resuscitate (DNR) order, a diagnosis of or suspicion for galactosemia, a triglyceride level > 1800 mg/dL, previous severe anemia, or currently requiring transfusion with RBCs.
We identified mothers carrying fetuses with congenital malformations who would require NICU admission and umbilical artery catheter insertion through The Fetal Center. This multi-disciplinary prenatal clinic includes maternal-fetal medicine specialists, neonatologists, and pediatric sub-specialists. In addition, we identified neonates admitted to the NICU with umbilical artery catheters using the electronic medical record system.
Specimen and Data Collection
Inform II meters found within the NICU were used for the study and were quality controlled daily at two glucose concentrations. The hematocrit range for Inform II is 10% to 65% and interfering substances include triglycerides >1800 mg/dL, galactose >15 mg/dL, ascorbic acid > 3 mg/dL, and N-acetylcysteine >5 mg/dL. 10 To avoid accessing the umbilical artery catheter beyond what was clinically necessary, the principal investigator (PI) collected study blood concurrent with when the neonate’s medical team needed a blood sample. The workflow for specimen collection is outlined in Supplementary Figure 1 and described below. While the bedside nurse collected blood from the umbilical artery catheter, the PI performed a heel prick on a heel that had been warmed for 5 minutes. The heel was cleaned with an alcohol wipe, the alcohol was allowed the dry, and then Inform II measured BGM capillary glucose twice (Inform II glucose strip lot #480038). Between the first and second measurements, the heel was again cleaned with an alcohol wipe, and the heel was allowed the dry before the second aliquot of blood was collected from the prick site. Next, the PI used the Inform II to measure glucose from arterial blood, twice. An aliquot of the arterial blood was then transferred to a heparinized syringe and placed on ice. The PI immediately walked 10 minutes to the research lab and centrifuged the arterial whole blood sample at 13 500 g for 30 seconds. While the blood was being centrifuged the YSI was placed in “run mode,” allowing a self-calibration process to occur. Following centrifugation, plasma was separated from the remaining whole blood sample. Two plasma glucose measurements and two plasma lactate measurements were obtained using a calibrated YSI. The YSI has a hematocrit range of 17% to 70% and interfering substances can be found in Appendix C of the User’s Manual (https://usermanual.wiki/Document/YSI2300StatPlusmanualj.4159099685/html#pf5). Whole blood collected from the umbilical arterial catheter by the bedside nurse was sent to the hospital’s clinical laboratory where certified medical laboratory technicians then measured hemoglobin, albumin, triglyceride, and IgG. We obtained maternal and neonate demographics and indicators of neonate illness severity from the electronic medical record for bivariate and multivariable regression analyses.
Statistical Analysis
We performed descriptive statistics and Bland-Altman analyses and created Clarke Error Grids using a custom Microsoft Excel template. 18 Clark Error Grid Analysis is a tool used to quantify the accuracy of blood glucose measurements obtained from BGM compared with a reference value. The grid is divided into five zones: A to E. Zones A and B represent accurate or acceptable results, zone C represents results that would lead to unnecessary treatment of hyperglycemia or hypoglycemia, zone D represents a failure to detect significant hyperglycemia or hypoglycemia, and zone E represents results that would lead to erroneous treatment of hyperglycemia for hypoglycemia and vice versa. 19
Bland-Altman plots were used to investigate relationships of the discrepancies between two measurements (y-axis) and the arterial plasma glucose value (x-axis). As the YSI 2300 Stat Plus serves as a gold standard for comparison accuracy in glucose measurement, an additional, modified Bland-Altman analysis was performed comparing bias (ie, the difference between BGM glucose measurement obtained from the Inform II and plasma glucose measured by the YSI) to plasma glucose, measured by the YSI.
In both the modified Bland-Altman analyses and Clarke Error Grid analyses, we compared each individual capillary BGM (BGMc1, BGMc2) and arterial BGM (BGMa1, BGMa2) glucose measurement to the average plasma glucose concentration, as measured by YSI. We used the Clinical and Laboratory Standard Institute (CLSI) POC12-A3 20 and Food and Drug Administration (FDA) 21 guidance to determine the clinical significance for Bland-Altman analyses.
Finally, for the analysis of the relationships among multiple variables, we performed bivariate and multivariable regression analyses. We determined the Pearson correlation coefficient to analyze the bivariate relationship between bias (between the BGM and reference plasma glucose measurements from the umbilical artery catheter sample, ie, BGM glucose minus reference glucose measurements) and several prespecified potential clinical covariates (Supplementary Tables 1 and 2). For the multivariable analysis, we excluded covariates with collinearity to birthweight including gestational age at birth, birth length, and body surface area. A P value of less than .05 was considered statistically significant for all statistical tests.
Results
Patient Characteristics
Parents of 46 neonates meeting inclusion criteria provided informed consent. Six neonates were subsequently excluded because hospital staff could not establish umbilical artery access. We collected blood from the remaining 40 neonates and extracted data from the medical chart on these maternal-neonate dyads. The mean gestational age at birth of enrolled neonates was 37.6 weeks. Notably, 45% were male, 65% were non-Hispanic white, and 42.5% were born via vaginal delivery. The most common clinical illness of enrolled neonates was congenital heart disease (65%) followed by hypoxic-ischemic encephalopathy (12.5%). Maternal and neonatal demographics are summarized in Tables 1–3.
Maternal Demographics.
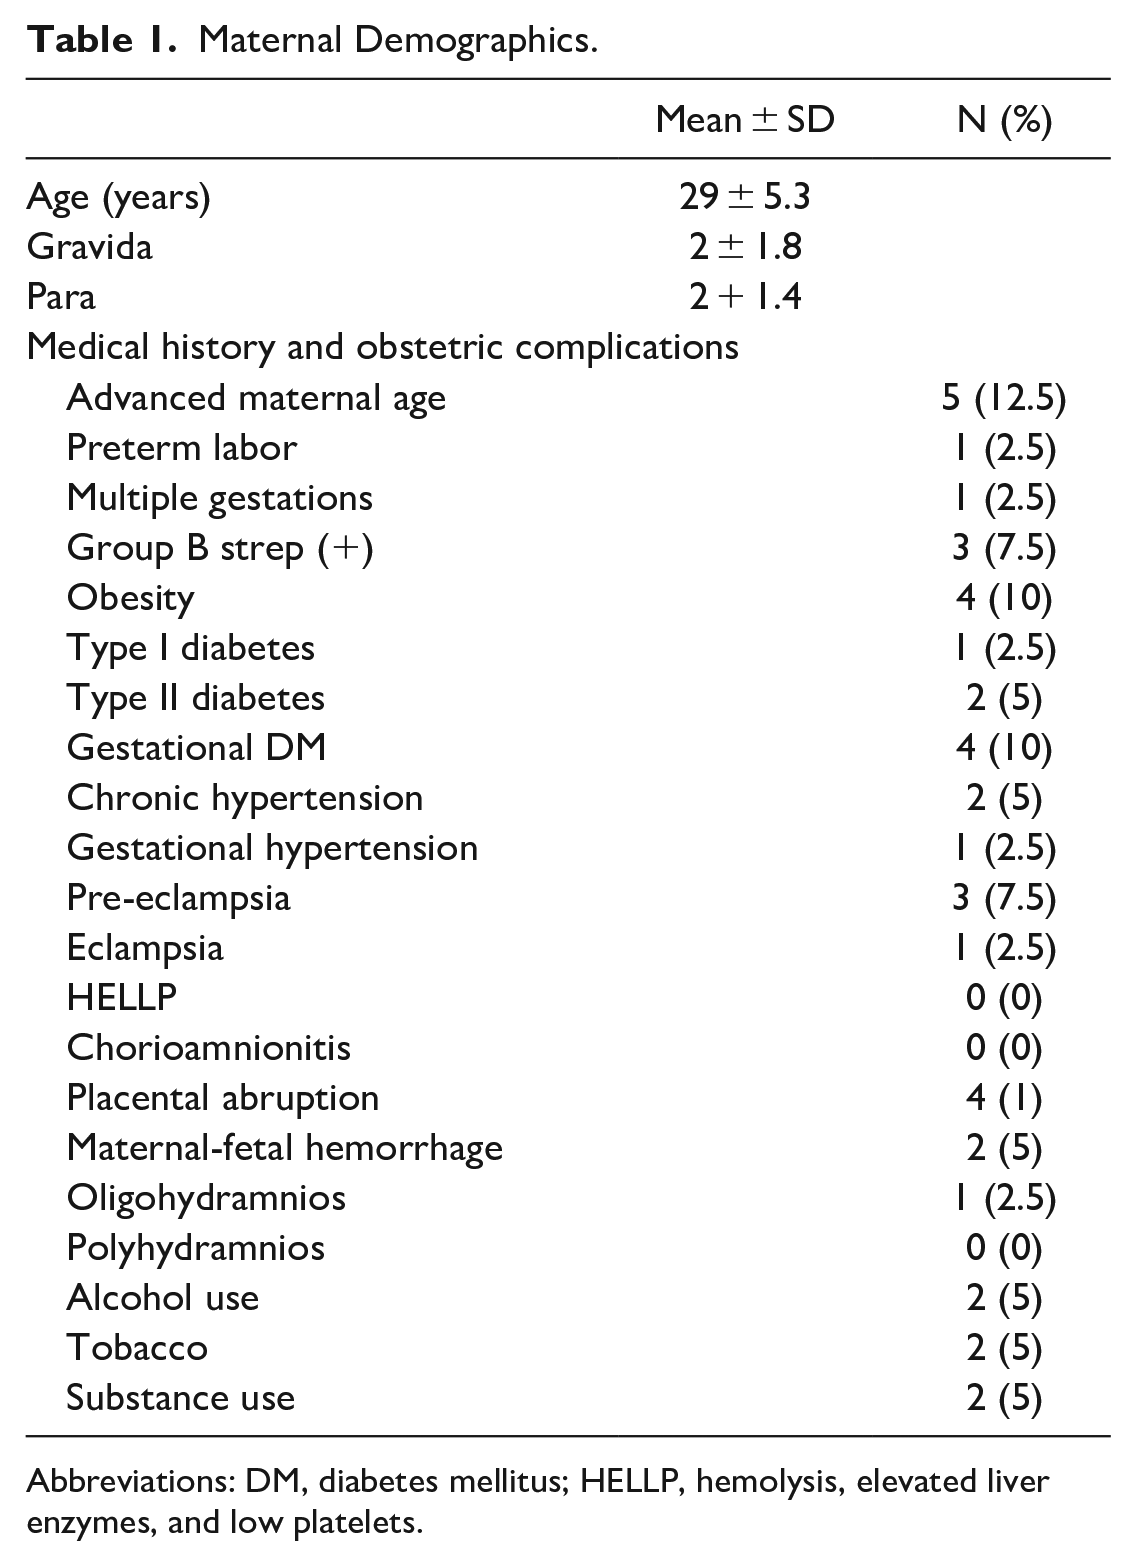
Abbreviations: DM, diabetes mellitus; HELLP, hemolysis, elevated liver enzymes, and low platelets.
Neonatal Demographics.
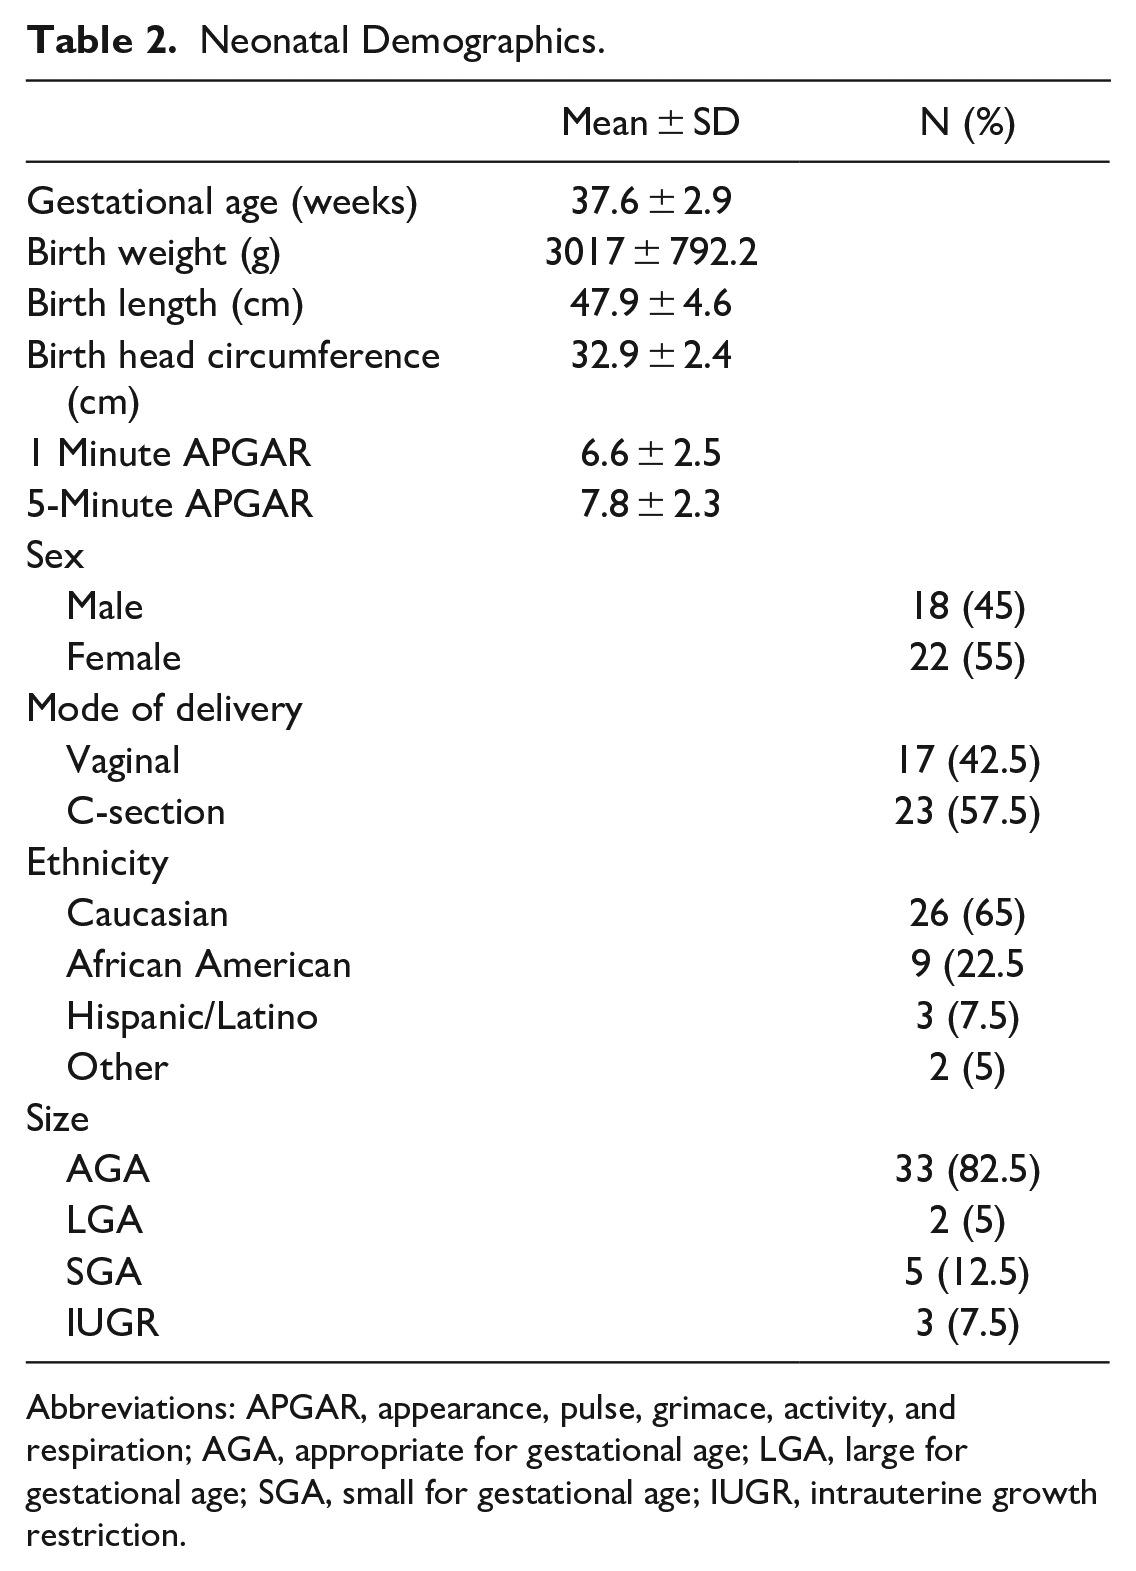
Abbreviations: APGAR, appearance, pulse, grimace, activity, and respiration; AGA, appropriate for gestational age; LGA, large for gestational age; SGA, small for gestational age; IUGR, intrauterine growth restriction.
Neonatal Illness.
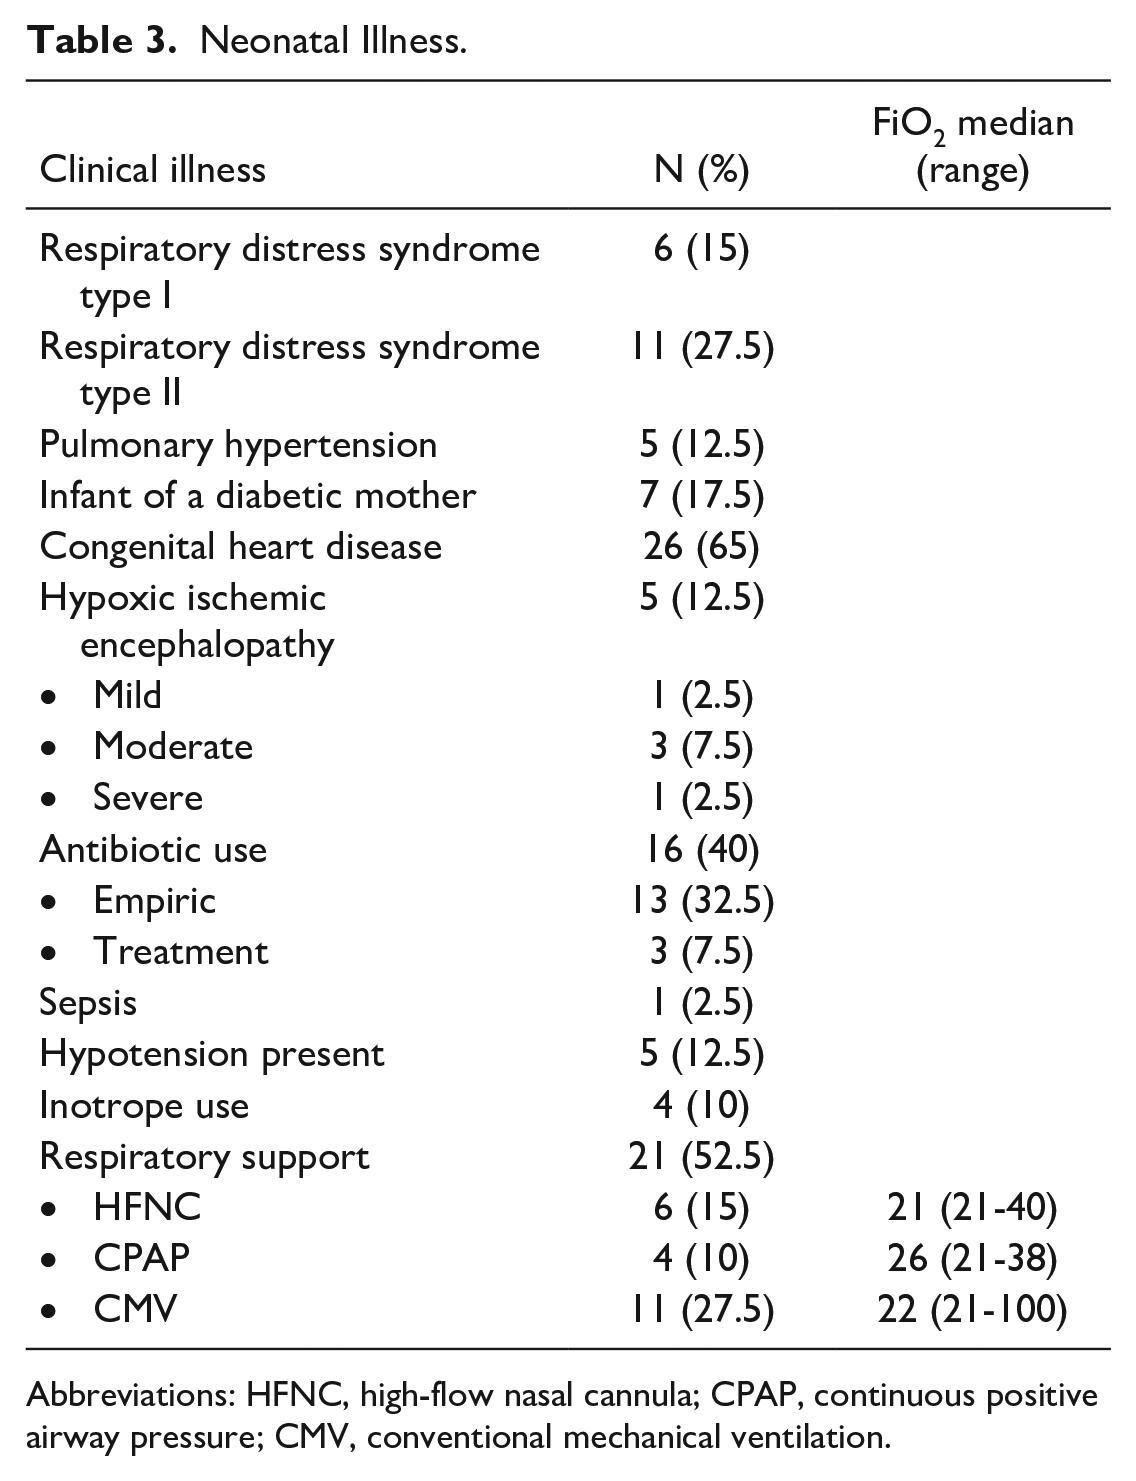
Abbreviations: HFNC, high-flow nasal cannula; CPAP, continuous positive airway pressure; CMV, conventional mechanical ventilation.
Blood Specimen Analysis
The median time after birth at which samples were collected from enrolled neonates was 19.5 hours (range 1-120 hours). The mean hemoglobin and lactate were 15.3 ± 2.5 mg/dL and 2.3 ± 0.9 mmol/L, respectively. Results for all blood tests are summarized in Table 4.
Results From Neonatal Blood Tests.
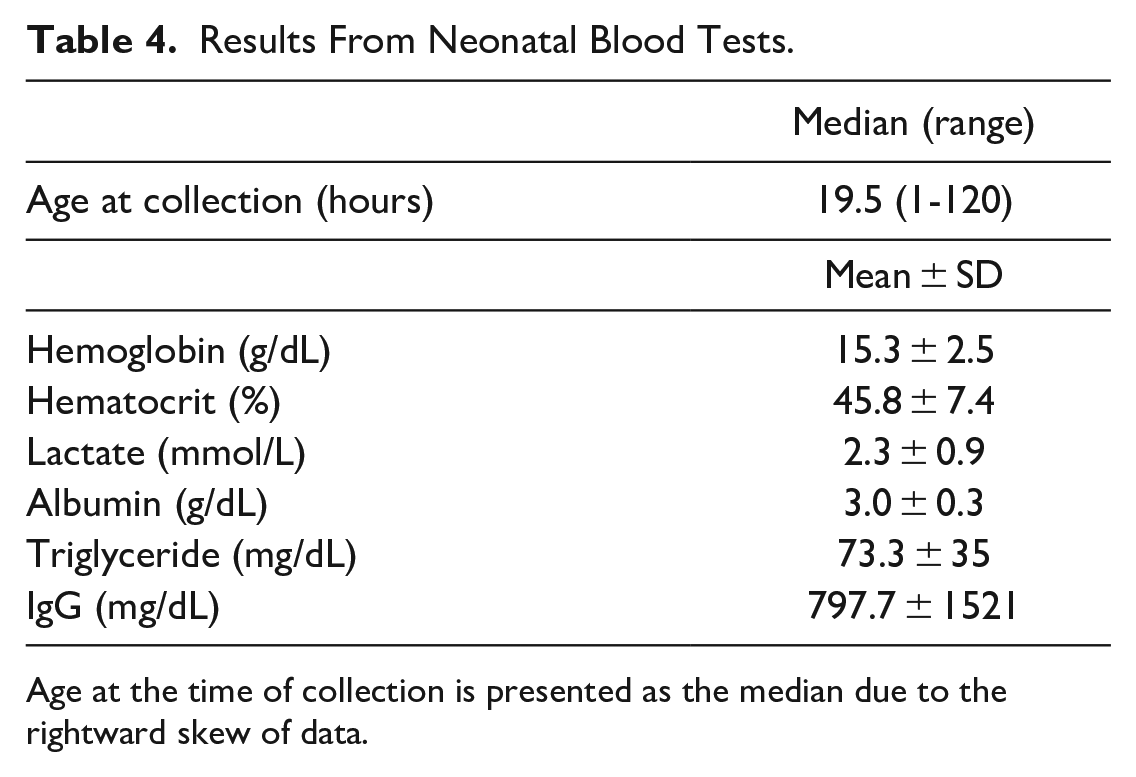
Age at the time of collection is presented as the median due to the rightward skew of data.
Bland-Altman and Clarke Error Grid Analyses
We used the CLSI POC12-A3 and FDA guidance to determine the clinical significance of Bland-Altman analyses. The CLSI recommends that 95% of the individual results from the BGM agree within 12 mg/dL of the laboratory analyzer at glucose concentrations below 100 mg/dL and within ±12.5% of the laboratory analyzer at glucose concentrations at or above 100 mg/dL. In addition, the sum of the number of individual results with (1) errors that exceed 15 mg/dL at glucose concentrations below 75 mg/dL and (2) errors that exceed 20% at glucose concentrations at or above 75 mg/dL should not exceed 2% of results. 20 The FDA recommends that 95% of all values obtained from BGM are within ±12% of the laboratory analyzer value for glucose concentrations >75 mg/dL and within ±12 mg/dL at glucose concentrations < 75 mg/dL. In addition, 98% of values obtained from the BGM should be within ±15% of the laboratory analyzer value for glucose concentrations >75 mg/dL and within ±15 mg/dL at glucose concentrations < 75 mg/dL. 21
On traditional Bland-Altman analysis, all arterial BGM glucose measurements obtained using Inform II met CLSI and FDA tolerance criteria (Figure 2a). On the modified Bland-Altman analysis, 36/40 (90%) of BGMa1 and 35/40 (87.5%) of BGMa2 measurements met the CLSI tolerance criteria with a sum of errors of <2% for BGMa1 and 5% (38/40) for BGMa2. Notably, 35/40 (87.5%) BGMa1 and 33/40 (82.5%) BGMa2 measurements met the FDA 95% tolerance criteria and 39/40 (97.5%) of BGMa1 and 36/40 (90%) of the BGMa2 measurements met the FDA 98% tolerance criteria (Figure 2b and Supplementary Table 3). On Clarke Error Grid analysis, all BGMa1 and BGMa2 measurements satisfied zone A criteria (Figure 2c1 and c2).
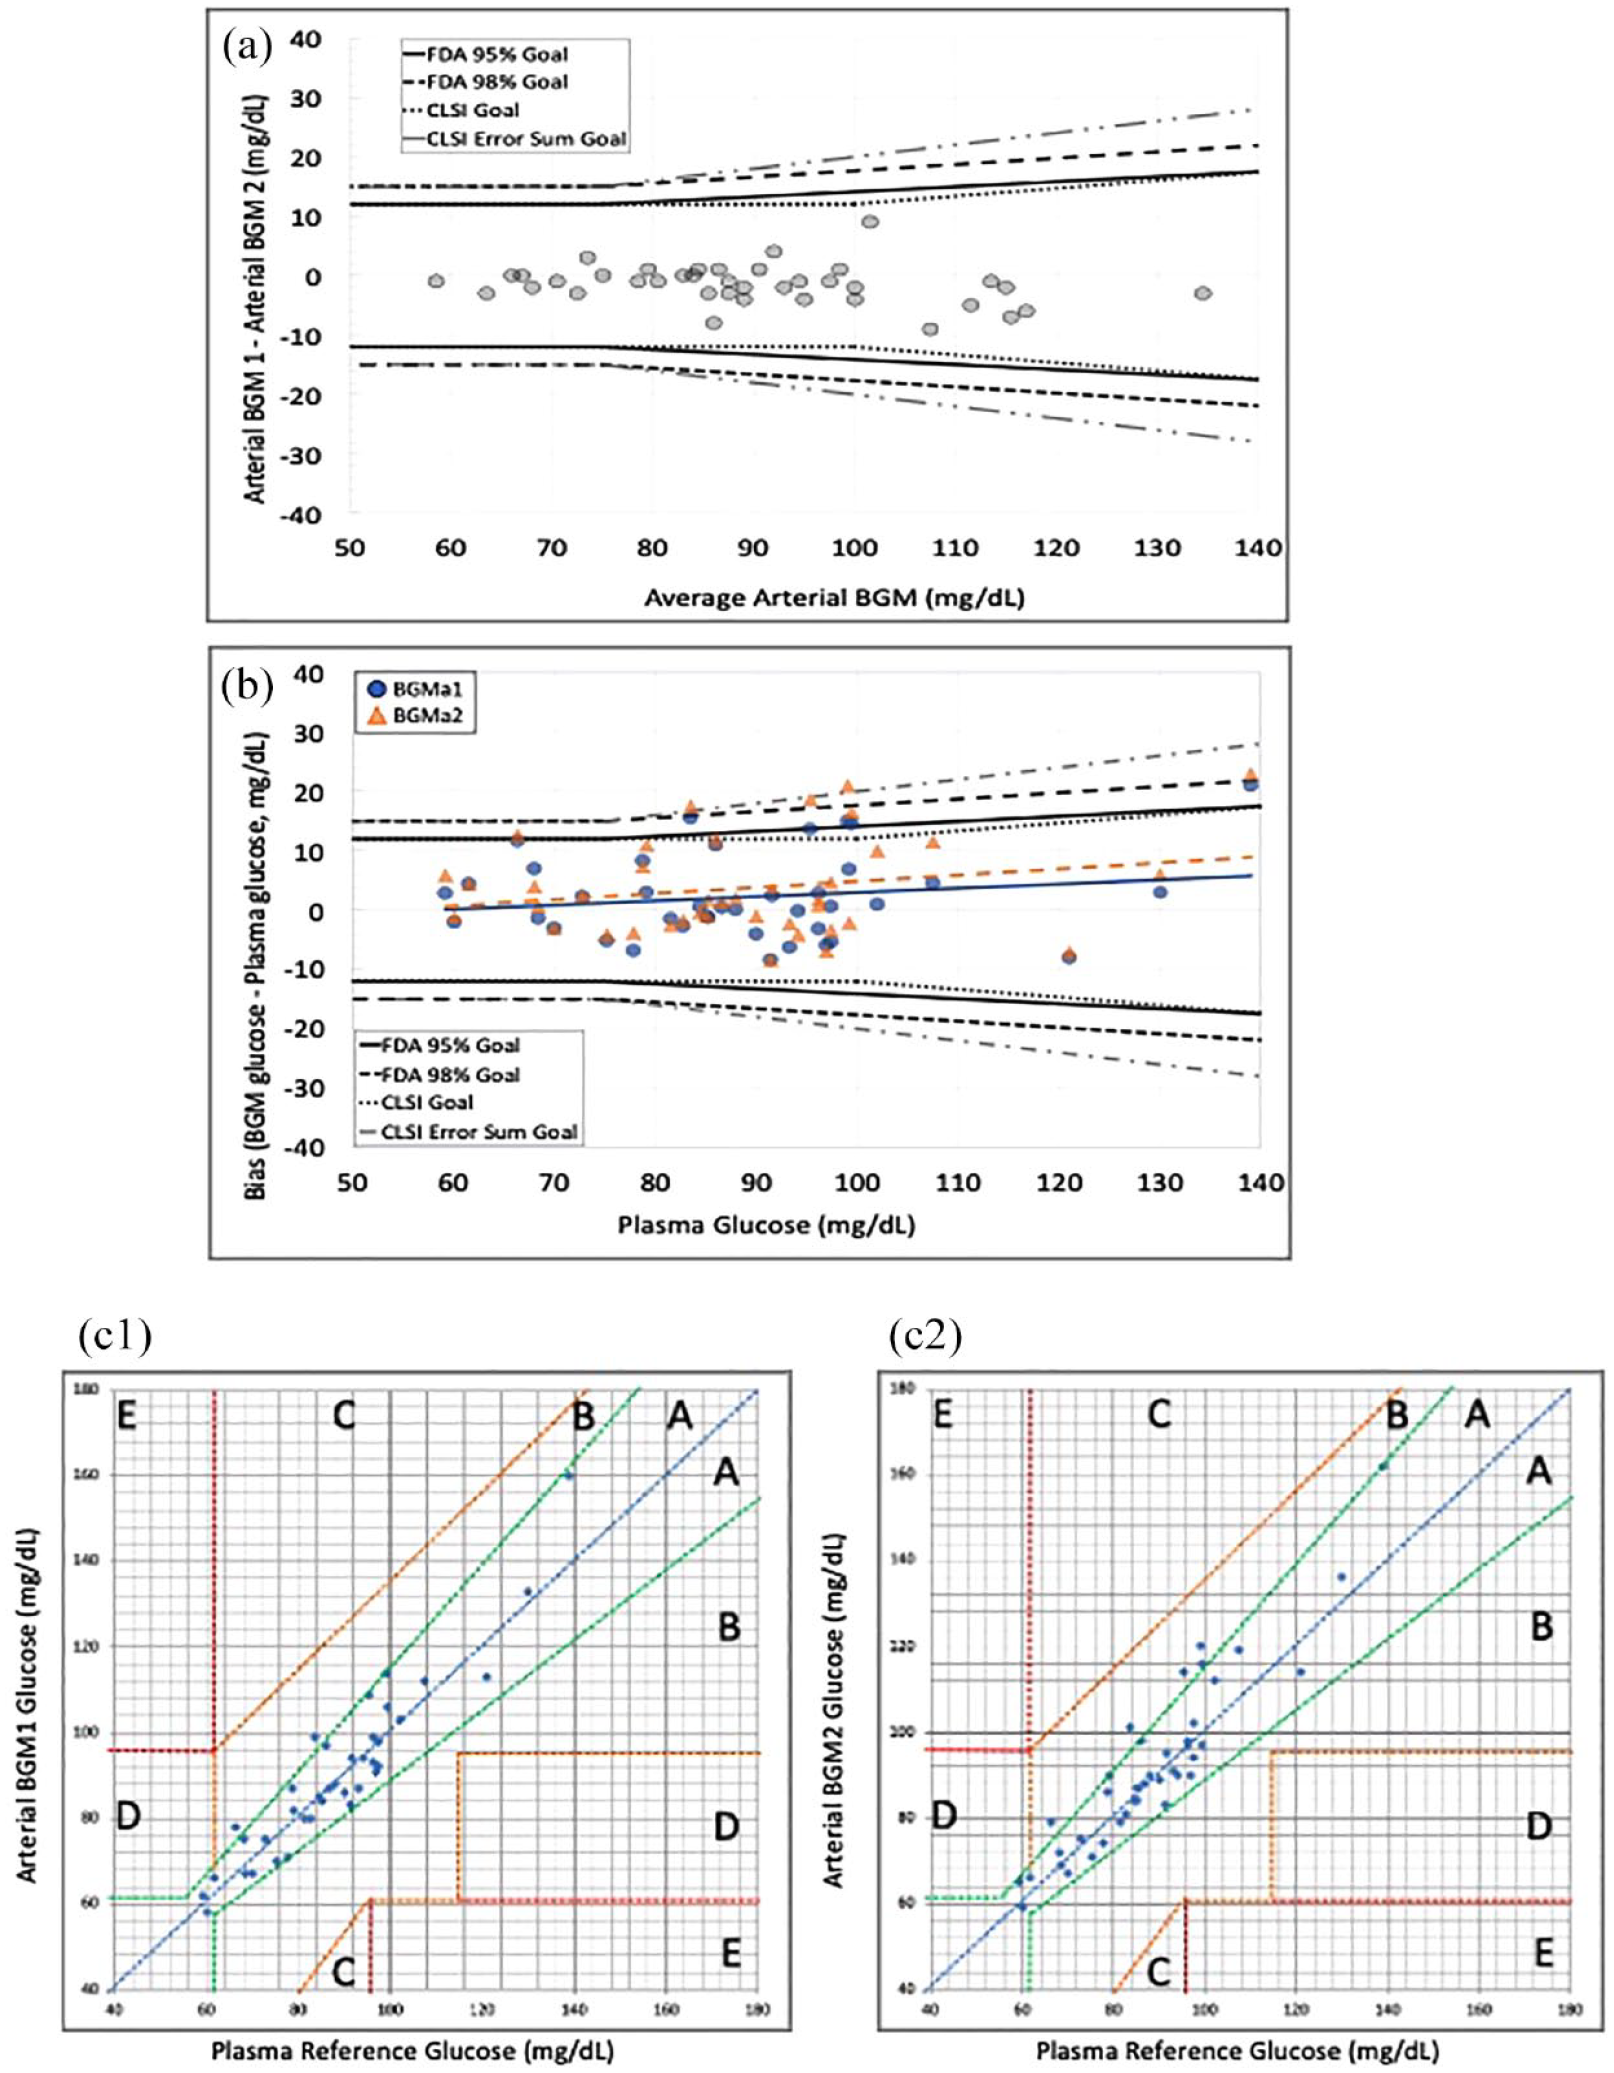
Umbilical artery sampling. (a) Bland-Altman analysis of arterial BGM glucose. (b) Modified Bland-Altman analysis of arterial bias (arterial BGM glucose minus reference arterial plasma glucose) versus reference arterial plasma glucose. Blue circles with solid trend line represent BGMa1, and orange triangles with dashed trend line represent BGMa2. (c) Clark error grid analyses. (c1) Arteriy catheter BGMa1. (c2) Arterial BGMa2.
Blood glucose monitor measurements of capillary samples were less reliable compared with measurements of the arterial glucose. On Bland-Altman analysis, 31/40 (77.5%) capillary BGM measurements met CLSI criteria with a sum of errors of 15%. Notably, 32/40 (80%) capillary BGM measurements met the FDA 95% tolerance criteria and 34/40 (85%) met the FDA 98% tolerance criteria (Figure 3a). On the modified Bland-Altman analysis, 27/40 (67.5%) BGMc1 and 29/40 (72.5%) BGMc2 measurements met CLSI criteria with a sum of errors of 20% for BGMc1 and 17.5% for BGMc2. Notably, 26/40 (65%) BGMc1 and 26/40 (65%) of BGMc2 measurements met the FDA 95% tolerance criteria and 28/40 (70%) of BGMa1 and 31/40 (77.5%) of the BGMa2 measurements met the FDA 98% tolerance criteria (Figure 3b and Supplementary Table 3). On Clarke error grid analysis, 87.5% of BGMc1 and 90% of BGMc2 measurements fell within zone A. Of the remaining measurements, 12.5% of BGMc1 and 10% of BGMc2 measurements fell within zone B (Figure 3c1 and c2).
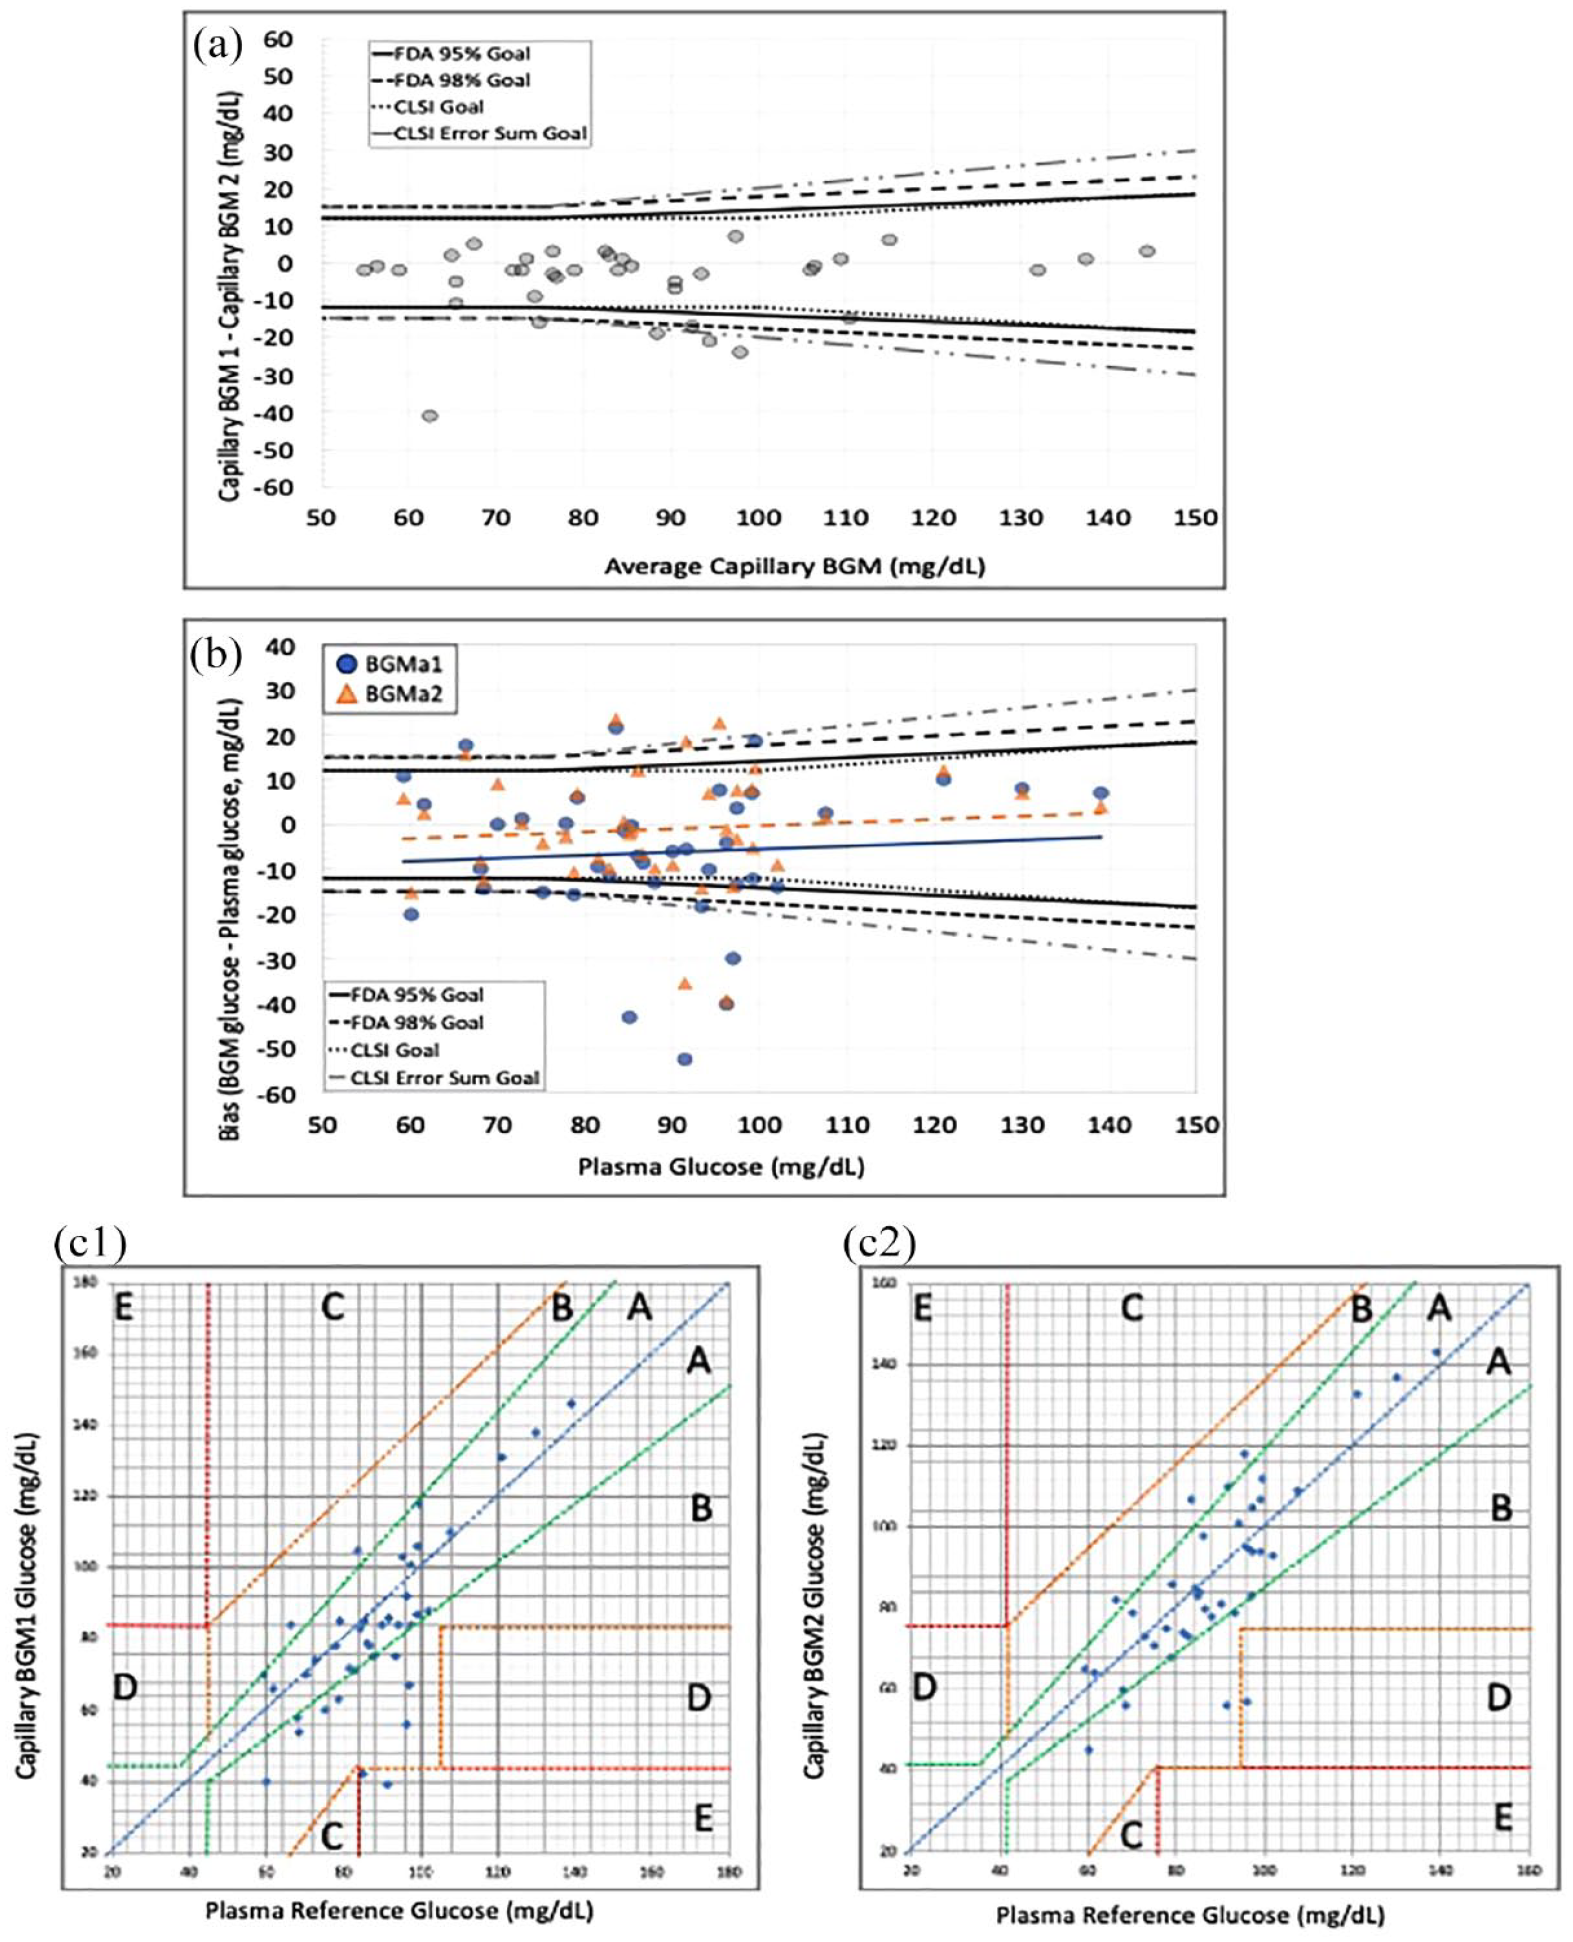
Arterialized capillary sampling. (a) Bland-Altman analysis of capillary BGM glucose. (b) Modified Bland-Altman analysis of capillary BGM bias (capillary BGM glucose minus plasma glucose) versus plasma glucose. Blue circles with solid trend line represent BGMc1, and orange triangles with dashed trend line represent BGMc2. (c) Clark error grid analyses. (c1) Capillary BGMc1. (c2) Capillary BGMc2.
Bivariate and Multivariable Analyses
We analyzed the bivariate relationship between artery bias (arterial BGM glucose minus reference arterial plasma glucose) and several prespecified potential clinical covariates. Covariates that were significantly associated with this bias included hemoglobin (r = −.55, P < .01) and birthweight (r = −.32, P = .02) (Supplementary Table 1). To further analyze these potential relationships, we then constructed a multivariable linear regression model with arterial glucose bias as the dependent variable and the prespecified covariates as the independent variables (birth weight, hemoglobin, triglyceride, and maternal age). We found that statistical significance was retained only for hemoglobin (ß = −1.54, P = .01). Because of the inverse correlation between hemoglobin and arterial glucose bias, the differences between BGM and reference glucose measurements were greatest in babies with lower hemoglobin values (Figure 4a and b).
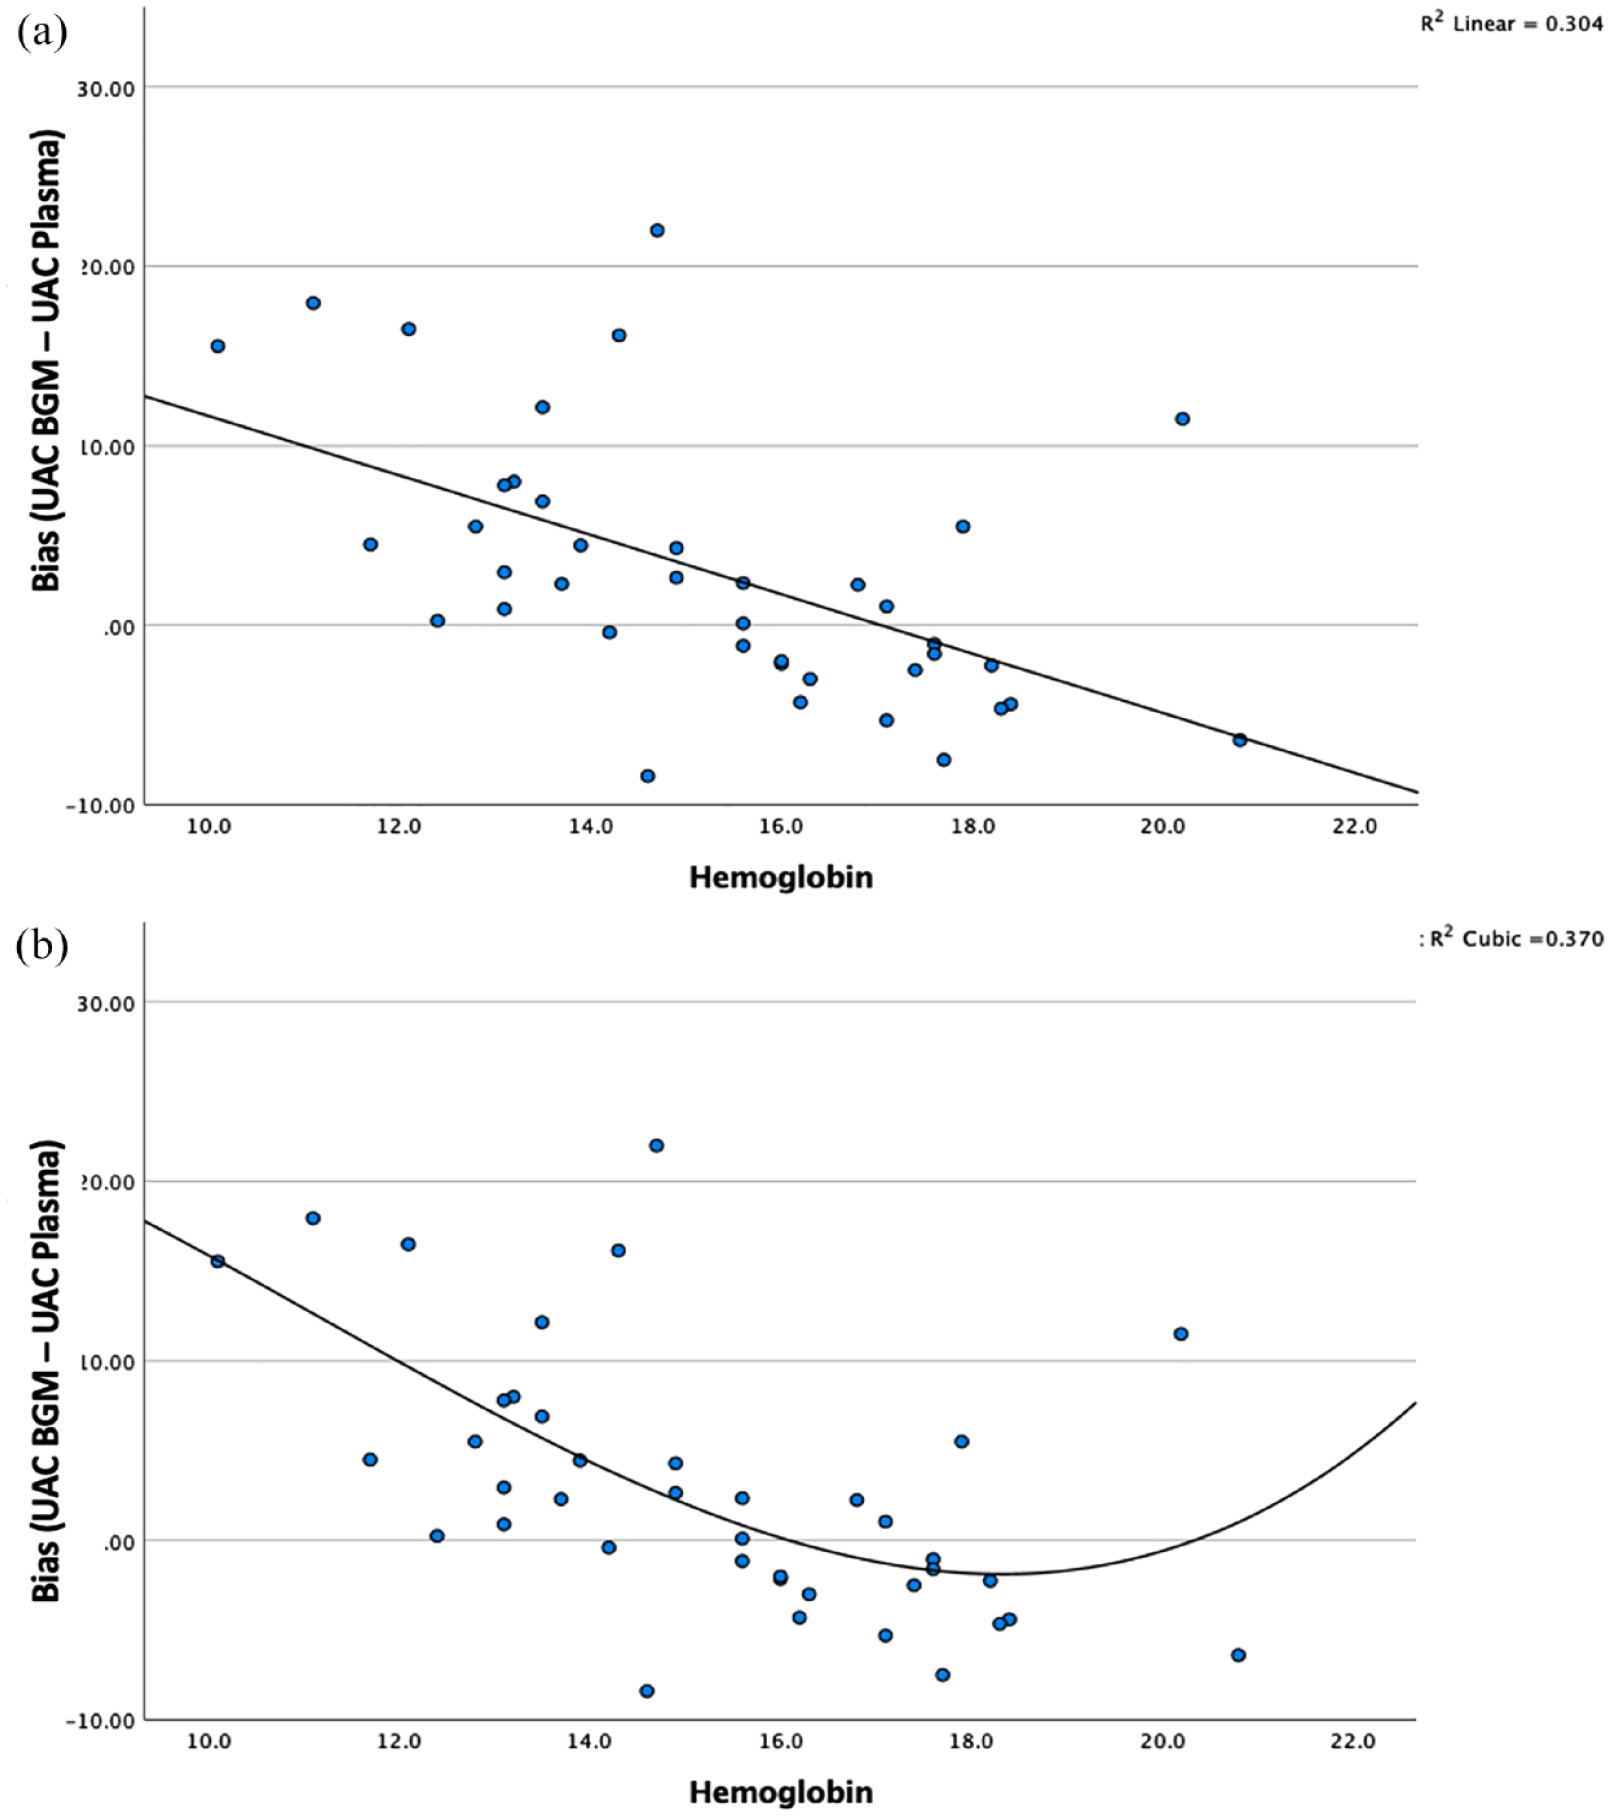
Bivariate analysis of hemoglobin (g/dL) impact on arterial bias. (a) Linear fit, R2 = .307. (b) Curvilinear fit, R2 = .37.
We also analyzed the bivariate relationship between capillary bias (between the BGM measurement from the heel capillary sample and from the reference plasma glucose measurement from the umbilical artery) and several prespecified potential clinical covariates. Covariates that were significantly associated with this bias included birthweight (r = −.42, P < .01), hemoglobin (r = −.38, P < .01), and lactate (r = .36, P = .01) (Supplementary Table 2). When we constructed a multivariable linear regression model with capillary glucose bias as the dependent variable and the prespecified covariates as the independent variables (birth weight, hemoglobin, triglyceride, maternal age, and lactate), we found that statistical significance was retained for birthweight (ß = −0.006, P = .02) with lactate approaching significance (ß = 3.619, P = .06).
Discussion
In this study evaluating the accuracy of the Inform II in preterm and ill neonates, we found that the device performs reliably on blood obtained from the arterial circulation with all arterial BGM measurements falling within CLSI and FDA tolerance criteria on traditional Bland-Altman analysis and only an average of ~3 samples (6.8%) falling outside tolerance criteria on modified Bland-Altman Analysis. The device performed less reliably on blood obtained from the capillary circulation with an average of ~7 samples (17.5%) falling outside tolerance criteria on traditional Bland-Altman analysis and ~11 samples (27.8%) outside tolerance criteria on modified Bland-Altman analysis.
To further scrutinize the clinical significance of these differences, we applied Clarke error grid analysis and found that 10% of BGM measurements of capillary blood fell within zone B. In each case of a zone B glucose measurement, the BGM reading was substantially lower than a euglycemic reference measurement. This observation highlights two important points. First, “falsely low” measurements of capillary samples by Inform II could conceivably initiate unnecessary evaluations for hypoglycemia (type I error). Second, the more dangerous possibility—that BGM capillary measurements would misguide physicians by indicating euglycemia when babies were actually hypoglycemic (type II error)—appears substantially less likely. Thus, clinicians should remember that a diagnosis of hypoglycemia derives from the broader picture of clinical information, not a single BGM glucose reading.
After establishing measurement biases in two settings, the arterial bias (ie, BGM artery whole blood glucose minus YSI plasma arterial glucose) and the capillary bias (ie, BGM capillary glucose minus YSI plasma arterial glucose), we then aimed to determine how much clinical factors interacted with those measurement biases. We first hypothesized that hemoglobin levels would significant ly interact with both measurement biases. When we analyzed bivariate relationships with umbilical artery bias, we found a strong inverse linear correlation with hemoglobin (R2 = .304). Moreover, we found that the relationship was better depicted by a polynomial curve fit (R2 = .370) (Figure 4). Our results indicate when hemoglobin decreases below 15 g/dL, the arterial bias becomes increasingly positive with the most pronounced difference being observed at anemic hemoglobin levels. In anemic neonates (hemoglobin < 14 G/dL), BGM glucose measurements may portray glucose values being higher than the arterial plasma glucose concentration. The clinical impact of this observation though is limited as there was overall strong agreement between arterial BGM and plasma glucose values as demonstrated by Bland-Altman and Clarke error grid analyses.
When we analyzed bivariate relationships with capillary bias, we found an inverse linear correlation with hemoglobin (R2 = .148) and birthweight (R2 = .177). When we conducted a multivariable regression analysis, birthweight retained its significance. This suggests that, in low-birthweight neonates, BGM glucose measurements may portray glucose values higher than the umbilical arterial plasma glucose concentration. However, results from Bland-Altman and Clarke error grid analyses indicate, in general, that, when a clinically significant difference between BGM capillary glucose values and plasma values was present, the BGM capillary glucose value was lower than the umbilical arterial plasma glucose concentration.
There are several limitations to this study. First, no arterial plasma glucose samples met the criteria for hypoglycemia (plasma glucose < 45 mg/dL in neonates less than 48 hours old). The reason for this was multi-factorial, but the biggest influence was the initiation of dextrose-containing fluids via peripheral IV prior to umbilical catheter insertion and sample collection. Second, a policy change occurred in the NICU preventing BGM testing on neonates with a gestational age of less than 27 weeks with established arterial vascular access which led to an underrepresentation of preterm neonates in our study. Third, the authors recognize that the FDA and CLSI criteria assume a sample size larger than 40 patients.
Conclusions
In this study, the Inform II provided reliable results on samples obtained from the arterial circulation. However, users should interpret hypoglycemic results obtained on samples from the capillary circulation with caution and the authors suggest confirming these results on a mixed blood sample.
Supplemental Material
sj-docx-1-dst-10.1177_19322968231207861 – Supplemental material for Reliability of Handheld Blood Glucose Monitors in Neonates: Trustworthy Arterial Readings but Capillary Results Warrant Caution for Hypoglycemia
Supplemental material, sj-docx-1-dst-10.1177_19322968231207861 for Reliability of Handheld Blood Glucose Monitors in Neonates: Trustworthy Arterial Readings but Capillary Results Warrant Caution for Hypoglycemia by David Brooks, James C. Slaughter, James H. Nichols and Justin M. Gregory in Journal of Diabetes Science and Technology
Supplemental Material
sj-jpg-2-dst-10.1177_19322968231207861 – Supplemental material for Reliability of Handheld Blood Glucose Monitors in Neonates: Trustworthy Arterial Readings but Capillary Results Warrant Caution for Hypoglycemia
Supplemental material, sj-jpg-2-dst-10.1177_19322968231207861 for Reliability of Handheld Blood Glucose Monitors in Neonates: Trustworthy Arterial Readings but Capillary Results Warrant Caution for Hypoglycemia by David Brooks, James C. Slaughter, James H. Nichols and Justin M. Gregory in Journal of Diabetes Science and Technology
Footnotes
Acknowledgements
Our sincerest thank you to the NICU nursing staff of the Monroe Carell Jr. Children’s Hospital at Vanderbilt whose help with specimen collection made this study possible.
Abbreviations
NICU, Neonatal Intensive Care Unit; BGM, Blood glucose monitor.
Author’s Note
David Brooks is also affiliated with Creighton University.
Author Contributions
David Brooks: Conceptualization, Methodology, Investigation, Formal Analysis, Writing—Original Draft, Writing—Review and Editing, and Funding Acquisition. James Nichols: Methodology and Resources. Christopher Slaughter: Formal Analysis. Justin Gregory: Conceptualization, Methodology, Formal Analysis, Writing—Review & Editing, and Supervision.
Declaration of Conflicting Interests
The author(s) declared the following potential conflicts of interest with respect to the research, authorship, and/or publication of this article: David Brooks declares no conflicts of interest, James Nichols has no conflict of interest to declare, Christopther Slaughter has no conflict of interest to declare, and Justin Gregory has served as an advisory board member for Eli Lilly, Medtronic, Dompe, vTv Therapeutics, and Mannkind Corporation and in data and safety monitoring roles for vTv Therapeutics and Medtronic.
Funding
The author(s) disclosed receipt of the following financial support for the research, authorship, and/or publication of this article: This study was supported by CTSA award No. UL1 TR002243 from the National Center for Advancing Translational Sciences. In addition, this project received funding from The John and Leslie Hooper Neonatal-Perinatal Endowment Fund. J.M.G. acknowledges support from the National Institute of Diabetes and Digestive and Kidney Diseases of the National Institutes of Health (K23DK123392), Vanderbilt Diabetes Research and Training Center (DK020593), a JDRF Career Development Award (5-ECR-2020-950-A-N), and from the Appleby Foundation. Its contents are solely the responsibility of the authors and do not necessarily represent the official views of the National Center for Advancing Translational Sciences, the National Institute of Diabetes and Digestive and Kidney Diseases, the National Institutes of Health, the JDRF, or the Appleby Foundation.
Supplemental Material
Supplemental material for this article is available online.
References
Supplementary Material
Please find the following supplemental material available below.
For Open Access articles published under a Creative Commons License, all supplemental material carries the same license as the article it is associated with.
For non-Open Access articles published, all supplemental material carries a non-exclusive license, and permission requests for re-use of supplemental material or any part of supplemental material shall be sent directly to the copyright owner as specified in the copyright notice associated with the article.