
Abstract
Background:
The magnitude and importance of higher HbA1c levels not due to mean blood glucose (MBG) in non-Hispanic black (B) versus non-Hispanic white (W) individuals is controversial. We sought to clarify the relationship of HbA1c with glucose data from continuous glucose monitoring (CGM) in a young biracial population.
Methods:
Glycemic data of 33 B and 85 W, healthy youth with type 1 diabetes (age 14.7 ± 4.8 years, M/F = 51/67, duration of diabetes 5.4 ± 4.7 years) from a factory-calibrated CGM was compared with HbA1c. Hemoglobin glycation index (HGI) = assayed HbA1c − glucose management index (GMI).
Results:
B patients had higher unadjusted levels of HbA1c, MBG, MBGSD, GMI, and HGI than W patients. Percent glucose time in range (TIR) and percent sensor use (PSU) were lower for B patients. Average HbA1c in B patients 8.3% was higher than 7.7% for W (P < .0001) after statistical adjustment for MBG, age, gender, insulin delivery method, and accounting for a race by PSU interaction effect. Higher HbA1c persisted in B patients when TIR was substituted for MBG. Predicted MBG was higher in B patients at any level of PSU. The 95th percentile for HGI was 0.47 in W patients, and 52% of B patients had HGI ≥ 0.5. Time below range was similar for both.
Conclusions:
Young B patients have clinically relevant higher average HbA1c at any given level of MBG or TIR than W patients, which may pose an additional risk for diabetes complications development. HGI ≥ 0.5 may be an easy way to identify high-risk patients.
Keywords
Introduction
Assessment of a patient’s glycemic status is very important for diagnosis and management of diabetes as well as predicting risk for complications. Ideally, detailed information about blood glucose levels over days and weeks should inform clinical management of patients. However, until recently, collection of detailed nychthemeral blood glucose data was laborious, time-consuming, expensive, and imposed considerable burden on patients. As HbA1c was found to be highly correlated with mean blood glucose (MBG) levels, easily assayed from a single sample of blood, and a predictor of diabetes complications,1,2 it became a widely used indirect estimate of glycemia in the clinic and for research studies.
Although HbA1c has often been conventionally used as an interchangeable surrogate for MBG, many factors have been recognized which can influence the level of HbA1c independently of blood glucose concentrations.3-6 Identification of factors which alter the relationship of HbA1c and MBG is important for accurate clinical interpretation of an individual patient’s glycemic control and prediction of complications based on HbA1c. Of particular note is the finding of higher HbA1c in individuals of non-Hispanic black African heritage (B) compared to individuals of non-Hispanic, white European background (W).4,7-11 Similar racial disparity in HbA1c is still evident when fructosamine is used as a surrogate for glucose levels; B patients have higher HbA1c for any given level of fructosamine. 12 The magnitude, mechanism, and clinical implications of glucose-independent racial difference in HbA1c are currently unclear and controversial.13-16 However, this disparity is potentially important as it may reflect greater risk for developing metabolic complications and occurrence of hypoglycemia in African heritage patients.14,17-20
The advent, refinement, and increasing clinical use of continuous glucose monitoring (CGM) provides a new tool to facilitate gathering and analysis of intensively collected glucose data which potentially can lead to better understanding of the relationship of HbA1c with MBG as well as the implications of between individual and between group disparities in this relationship.21,22 Glycemic metrics derived from CGM can provide a richer assessment of glucose dynamics than was possible in the past from a single or a limited number of intermittently drawn blood glucose samples.
In this project, we sought to compare patient HbA1c paired with the associated preceding glucose data obtained from CGM from a biracial population of youth with type 1 diabetes. We had several objectives for this study. First to determine the presence and magnitude of glucose-independent racial difference in HbA1c from CGM data and compare it with prior estimates based on intermittent glucose sampling.8,23-25 Are indices such as hemoglobin glycation index (HGI) and glucose management indicator (GMI), which can easily be derived from CGM data, helpful in identification and quantifying glucose-independent racial disparity in HbA1c? Does hypoglycemia occur in greater frequency in non-white patients despite their having higher HbA1c as has been suggested previously.18,26,27
Methodology
Inclusion Criteria
In this cross-sectional study, the latest glycemic metrics from CGM: mean blood glucose (MBGCGM), mean blood glucose standard deviation (MBGSDCGM), percent time in glucose range 70 to 180 mg/dL (TIR), percent time of glucose <70 mg/dL (TBR), percent sensor use (PSU) was the number of days during the 30-day CGM reporting period with at least 50% CGM readings (per Dexcom User Guide), and concordant HbA1c were collected from the medical records of patients at the Children’s Diabetes Center at the Children’s Hospital of New Orleans, Louisiana. Patients were grouped by self-identification as non-Hispanic white (W) or Non-Hispanic black/African American (B) according to the demographic information in the medical record. All patients had type 1 diabetes as verified in the recorded clinical history. Patients used a factory-calibrated Dexcom CGM system for daily use along with their insulin delivery method. The CGM data were compiled from the manufacturer’s Clarity™ data set for the 30 days prior to the patient’s clinic visit when HbA1c was drawn. Patient insulin doses were adjusted by the patient’s diabetologist based only on review of glycemic data from the CGM.
Hemoglobin A1c
Venous blood for HbA1c from patients was drawn on the day of the clinic visit, and paired with CGM uploaded data HbA1c was assayed in the clinical lab at the Children’s Hospital of New Orleans by an immunoassay method certified by the National Glycohemoglobin Standardization Program.
GMI
GMI is the predicted HbA1c calculated from CGM mean blood glucose based on a population regression model from the report of Bergenstal et al. 22 GMI (%) = 3.31 + (0.02392 × MBGCGM).
Hemoglobin glycation index (HGI) = (mHbA1c − pHbA1c) where mHbA1c is the HbA1c measured by assay from blood drawn at the clinic visit, pHbA1c is the predicted HbA1c based on the patient’s MBGCGM from the CGM. HGI can be easily calculated as = (mHbA1c − GMI), HGIGMI. HGI was also calculated as has been done previously using the predicted HbA1c for each patient derived from the regression equation of HbA1c on MBGCGM from this study population, 28 HGIPOP.
Data were analyzed using SAS 9.4 and Stata. Simple comparison between B and W patient groups was performed using PROC TTEST for normally distributed variables or PROC NPAR1WAY for variables not normally distributed. Correlation between variables of interest was performed using Spearman correlation (rs is Spearman correlation coefficient, there is no assumption of normality or linearity of the data) in PROC CORR. Multiple variable models were performed to adjust the influence of race and for MBGCGM, MBGSDCGM, TBR, TIR, PSU, gender, age, and insulin delivery method using PROC GLM. Further analyses used a hierarchical approach to model development to account for both additive and interactive effects, especially by race of potentially confounding variables on HbA1c. These analyses employed a general linear modeling approach that supported the choice of underlying distribution (Gaussian) and data transformations (log) to meet the normality assumption. The choice of the covariables, including interactive effects, in the final model was based on magnitude and statistical significance, especially interactions, on the estimation of the effect of race on HbA1c.
This study was reviewed and approved by the LSUHSC New Orleans and Children’s Hospital of New Orleans Institutional Review Boards (IRBs). The authors confirm that the data supporting the findings of this study are available within the article and/or its supplementary materials.
Results
Characteristics of Patients
Table 1 contains characteristics of the patients. There was no difference between groups for chronologic age at clinic visit, age of diabetes diagnosis, duration of diabetes, body mass index (BMI), male-to-female ratio, or mode of insulin delivery.
Characteristics of Patients.
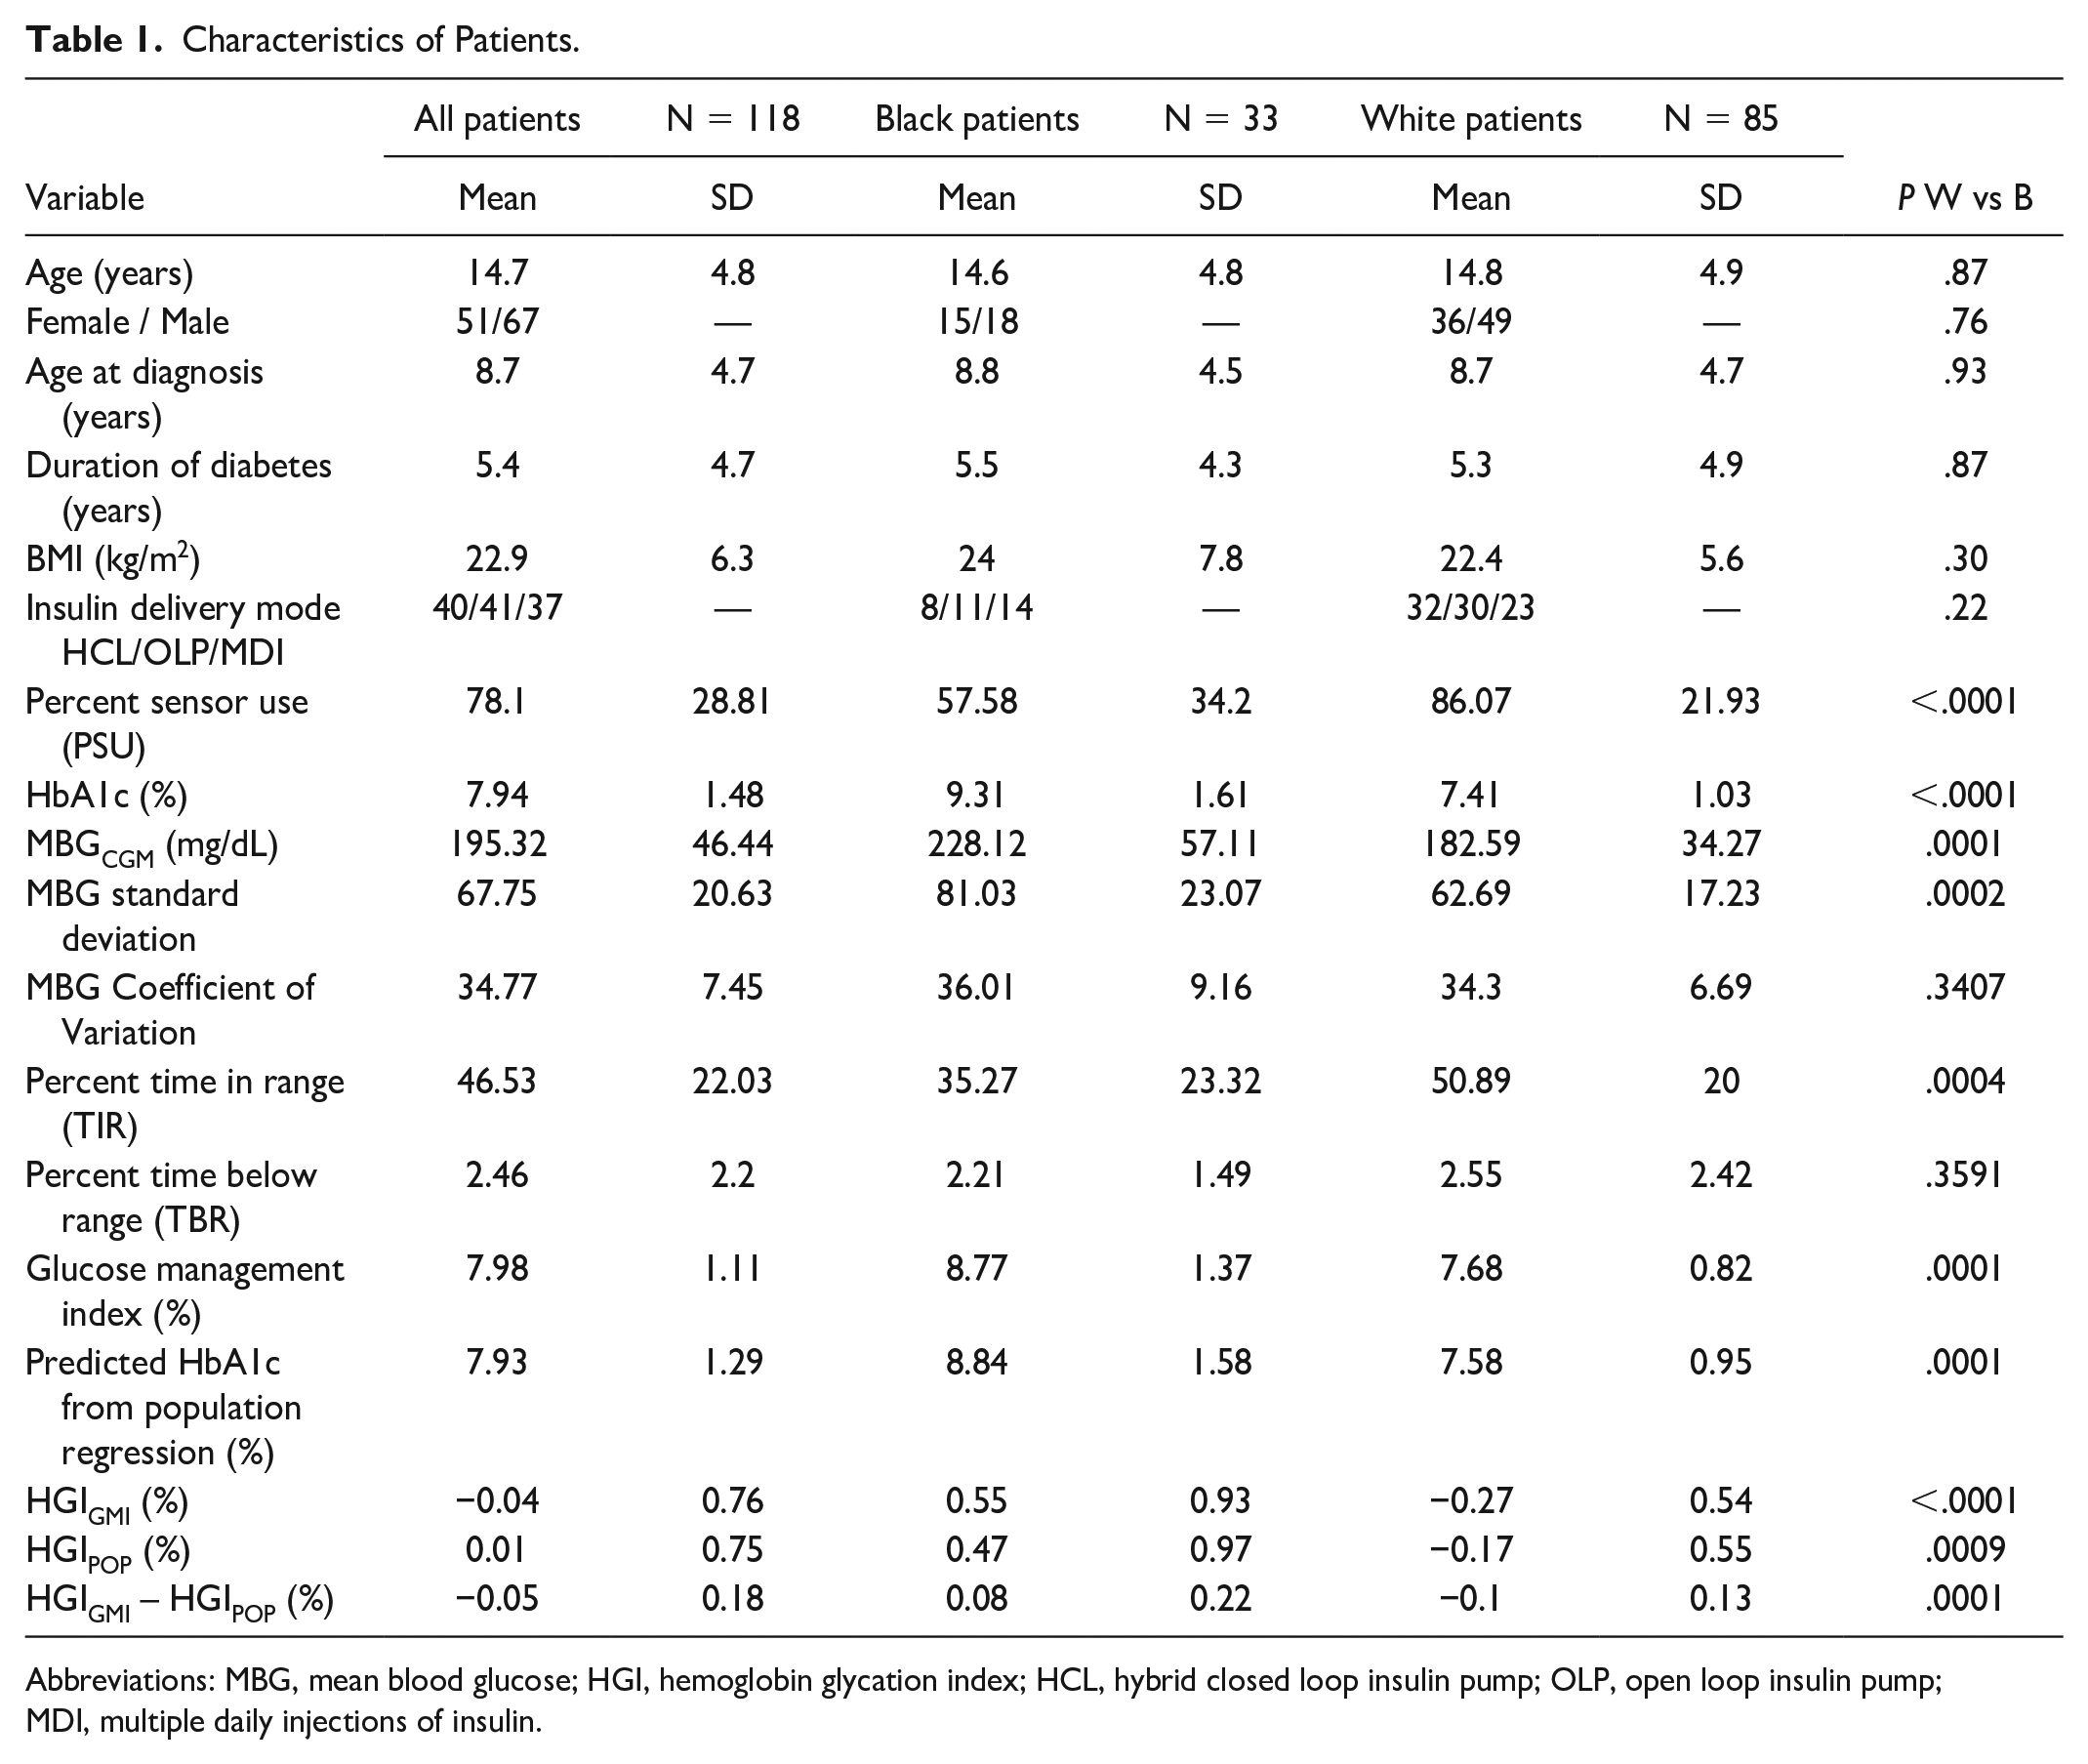
Abbreviations: MBG, mean blood glucose; HGI, hemoglobin glycation index; HCL, hybrid closed loop insulin pump; OLP, open loop insulin pump; MDI, multiple daily injections of insulin.
Correlation of Glycemic Variables
HbA1c was highly correlated with MBGCGM, MBGSDCGM and inversely correlated with glucose time in range (TIR), and was moderately correlated with PSU. HbA1c was also highly or moderately correlated with indices, GMI, and HGI, which use HbA1c or a variable correlated with HbA1c for their calculation. MBGCGM was highly inversely correlated with TIR and moderately inversely correlated with PSU (rs = −0.40, P < .0001). HGIPOP calculated directly from the current population regression equation had no correlation with MBGCGM (rs = −0.02, P = .79) whereas HGIGMI which was derived from GMI and hence MBGCGM had a weak correlation with MBGCGM (rs = 0.20, P = .0304). Chronologic age was inversely correlated with PSU (rs = −0.31, P < .0007). Duration of a patient’s diabetes was weakly correlated with HbA1c (rs = 0.22, P = .0178), MBGCGM (rs = 0.23, P = .0113), and TIR (rs = −0.26, P = .0043). Supplemental Table 1 displays overall correlation (Spearman) of glycemic metrics of interest.
Comparison of Glycemic Characteristics Between Groups and Impact of Duration of Sensor Use
Table 1 contains statistically unadjusted glycemic data of the patients overall and by group with simple comparison between B and W patients. HbA1c, MBGCGM, MBGSDCGM, GMI, HGIGMI, HGIPOP were all higher in B patients compared to W. While TIR and PSU were higher in W compared to B patients.
HbA1c was further evaluated by race adjusting for other covariables of interest. As both HbA1c and MBGCGM are both higher in B versus W patients, further analysis is needed to detect factors in addition to MBGCGM which would have an independent influence on HbA1c levels. Figure 1 depicts HbA1c versus MBGCGM by group. In a simple model (Figure 1a) MBGCGM (P < .0001) and race (P < .0001) were statistically significant with an overall R2 = .80 (P < .0001). In the Figure 1a, the combined effect of MBGCGM and race on HbA1c can be seen. HbA1c increases in a linear fashion with increasing levels of MBGCGM for patients in both groups. In general, B patients have higher HbA1c than W patients at any given level of MBGCGM. There was no interaction of MBGCGM and race.
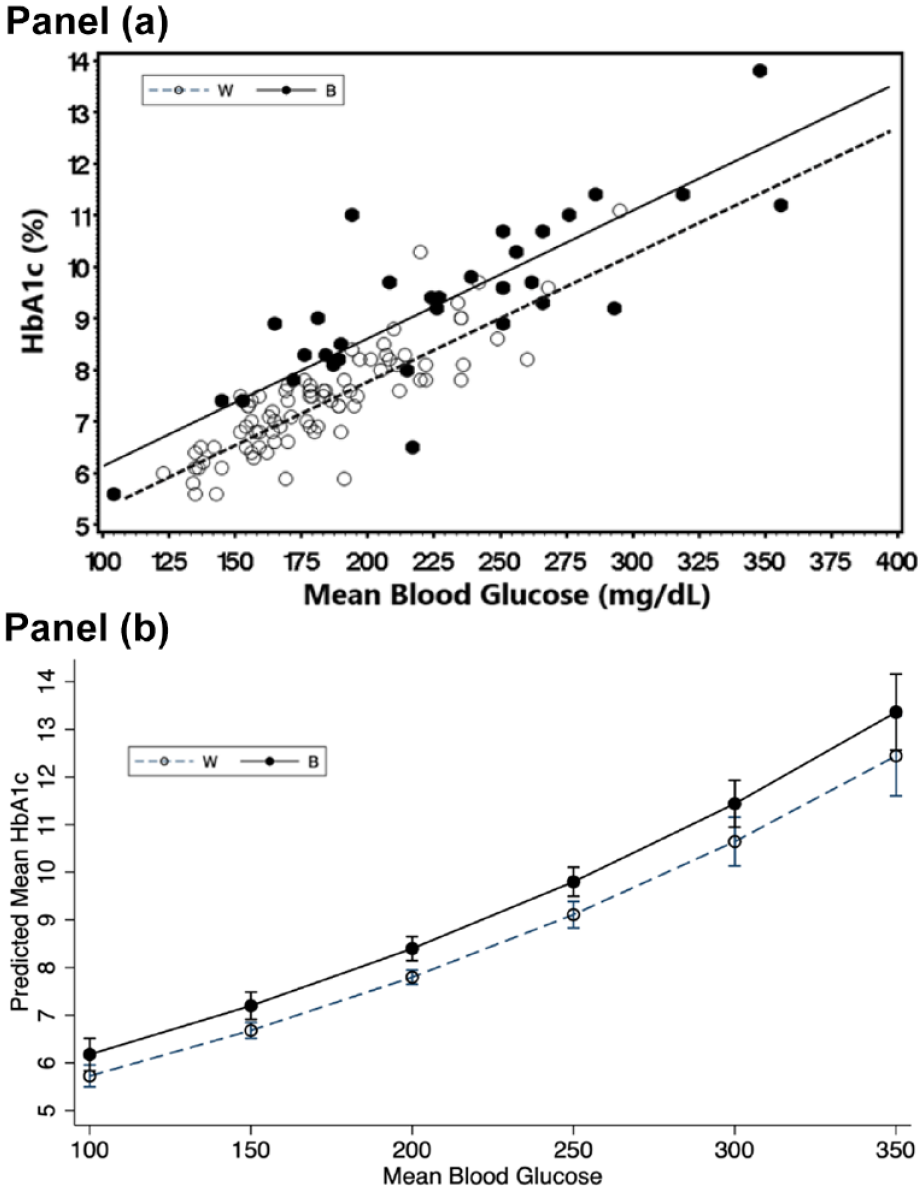
The relationship of HbA1c with CGM derived Mean Blood Glucose (MBGCGM) by race. (a) Relationship between HbA1c versus MBGCGM by race. HbA1c is influenced by both MBGCGM and race (P < .0001). HbA1c increases linearly with increasing MBGCGM (P < .0001), and Non-Hispanic blacks (B) have higher HbA1c than Non-Hispanic white (W) patients at any given level of MBGCGM (P < .0001). MBGCGM and race account for 80% of the variation in HbA1c. (b). Predicted Levels of HbA1c by MBG and Race Based on Hierarchical Regression Modeling. Independent covariates included in the model were MBGCGM, Race, Percent sensor use (PSU), age, gender, insulin delivery mode and 2-way interactions of race and PSU and PSU with MBG. The difference of HbA1c by race at any given level of MBG was statistically significant (P < .0001) after adjustment for the other covariates and interaction terms
Figure 1b depicts the Predicted HbA1c from the hierarchical analysis. Percent sensor use, a metric of sensor usage, was lower in B patients compared to W. Potentially CGM sampling differences between B and W patients might have artifactually led to lowered MBGCGM in B patients which would lead to higher than anticipated levels of HbA1c in B compared to W at any given level of MBGCGM as well as greater HGI levels. A more complex model was developed where HbA1c was the dependent variable and race, gender, insulin delivery method, chronologic age and PSU were included as independent variables. A hierarchical approach was used to estimate the effect of race on HbA1c. Initially the possibility of a 3-way interaction involving race by PSU by MBG was examined. The model included all 2-way and main effects involved in the 3-way interaction as well as effects of age, sex and mode of insulin delivery. Because the 3-way interaction effect was not statistically significant (P = .734) it was dropped from the model and only the model with all the 2-way interactions was evaluated. The interaction between race and MBG (P = .208) was also removed resulting in the final model, which included 2-way interactions by race and PSU, PSU and MBG and their main effects. Figure 1b depicts the prediction HbA1c by race for increasing levels of MBG adjusted for the other effects and interactions in this model, accounting for a very large proportion of the variation in HbA1c (R2 = .86). HbA1c is higher in B patients versus W at all MBG levels. Supplemental Table 2 contains the predicted numeric estimates for HbA1c with standard errors by race from this model.
The relationship of PSU with MBG is presented in Figure 2. Here, predicted MBG is depicted as calculated from the regression model where PSU was further adjusted for age, race, gender, and insulin delivery method. Increasing PSU was associated with declining MBG, and B patients had higher MBG at any level of PSU (P < .0001). There was no evidence for PSU being associated with lower MBG in B patients which would have artifactually led to an observation of higher HbA1c in B patients at any given level of MBG.
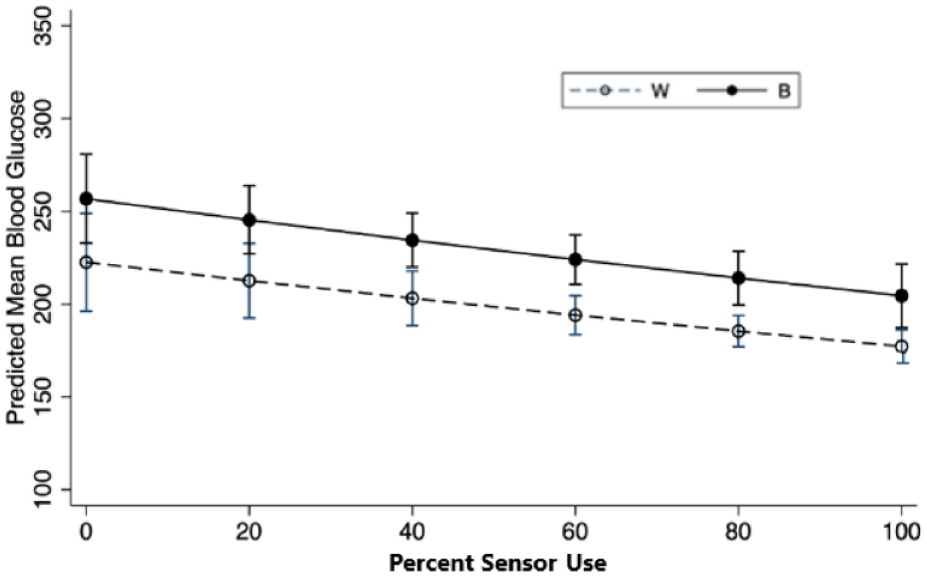
The relationship of Predicted CGM Mean Blood Glucose level and Percent Sensor Use (PSU) by race. PSU is the percent of days during the observation period with CGM sensor data for greater or equal to 50% of the day. The model was adjusted for race, gender, age, mode of insulin delivery in addition to PSU. Mean blood glucose decreased with increased sensor use (P = .0001). Black patients had higher MBG at any level of PSU (P < .0001).
Figure 3 depicts the relationship of HbA1c versus percent time in range (TIR) for both groups. In this simple model TIR (P < .0001) and race (P < .0001) were statistically significant with an overall R2 = .65 (P < .0001). There was a trend in the interaction of race and TIR (P = .08). The relationship of HbA1c with TIR and race is depicted in Figure 2a. A more complex model was evaluated where HbA1c was the dependent variable and race, TIR, gender, insulin delivery method, age and PSU were independent variables, along with a 2-way interaction of TIR with PSU (R2 = .67). The predicted HbA1c from TIR adjusted for the other covariates is presented in Figure 2b. The adjusted least squares means and standard error for HbA1c predicted from this model for B and W patients are presented in Supplemental Table 3, B patients had higher levels of HbA1c than W at all levels of TIR (P < .0001).
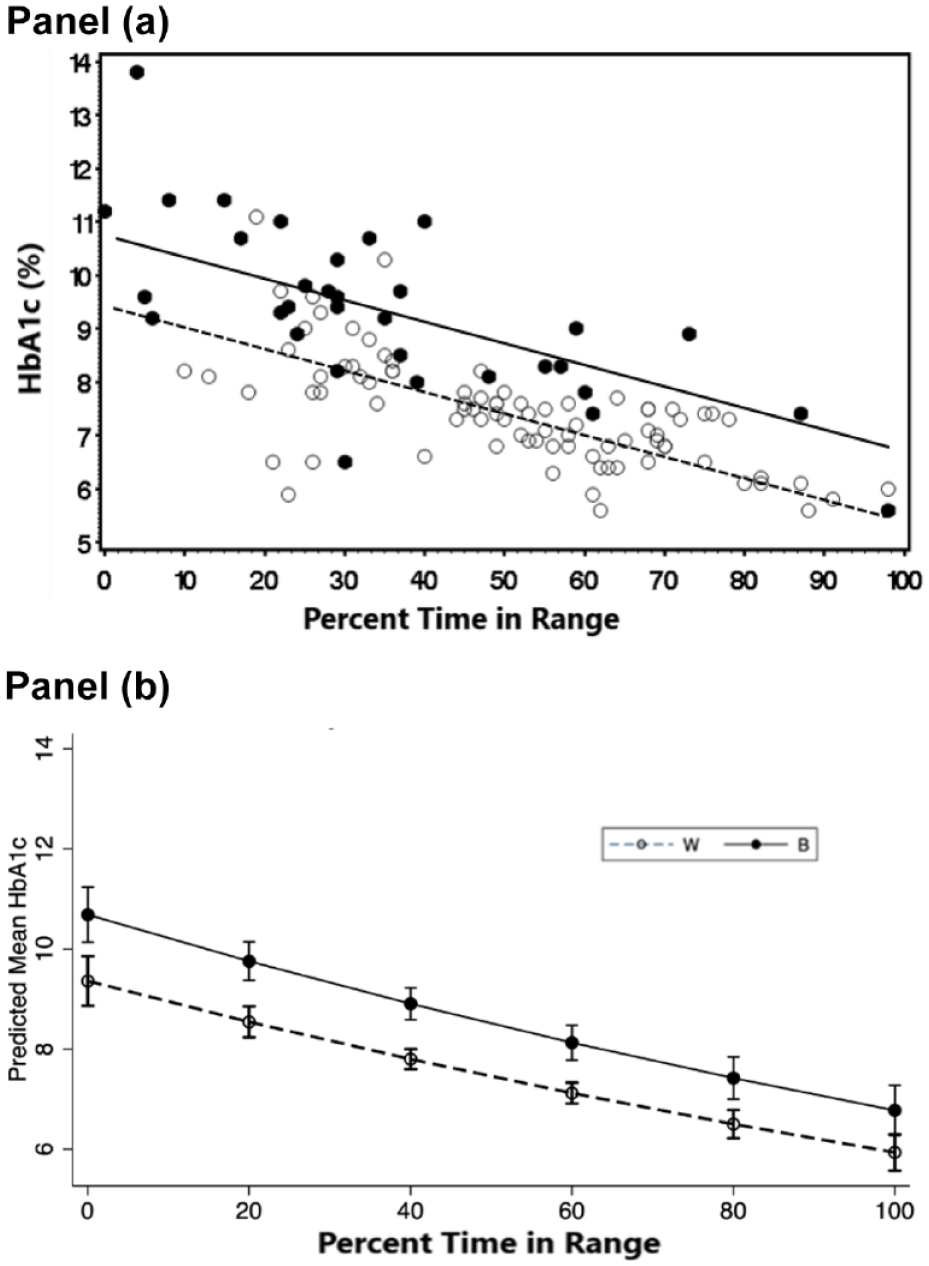
The relationship of HbA1c with Percent Time in Glucose Range 70 to 180 mg/dL (TIR) by Race. (a) Relationship of HbA1c versus TIR by race. HbA1c is influenced by both TIR and race (P < .0001). HbA1c decreases inversely with increasing TIR (P < .0001), and Non-Hispanic blacks (b) having higher HbA1c than Non-Hispanic white (W) patients at any given level of TIR (P < .0001). There was a trend for interaction of race and TIR (P = .08). (b) Predicted Levels of HbA1c by TIR and race based on hierarchical regression modeling. Independent covariates included in the model were TIR, Race, Percent sensor use (PSU), chronologic age, gender, insulin delivery mode and 2-way interactions of race and PSU and PSU with MBG. The difference of HbA1c by race at any given level of TIR was statistically significant (P < .0001) after adjustment for the other covariates and interaction terms.
HGI and GMI
Hemoglobin glycation index derived from GMI (HGIGMI) and the HGI derived from the sample population (HGIPOP) were highly correlated (Supplemental Table 1). MBGCGM was correlated with HGIGMI but not HGIPOP. GMI was correlated with HGIGMI but not HGIPOP (Supplemental Table 1). GMI, HGIGMI, and HGIPOP were all higher in B compared to W patients (Table 1). A comparison of HGIGMI and HGIPOP for B and W patients is presented in Supplemental Figure 1.
Hypoglycemia
Percent time below range was moderately correlated with MBGSDCGM and MBGCOV (Supplementary Table 1). TBR was not different for B and W patients (Table 1). In a multiple variable model (R2 = .23, P = .0004) TBR was associated with MBGCGM (P < .0001) and MBGSDCGM (P < .0001) but not race, insulin delivery mode, gender, age, or PSU. The relationship of TBR versus MBGCGM and MBGCOV by race is depicted in Supplemental Figure 2 panels A and B.
Discussion
Continuous glucose monitoring provides a rich nyctohemeral sample of glucose data and eliminates potential bias in study sampling protocols where only a single glucose or a limited number of intermittently drawn glucose blood samples were obtained. Using glucose metrics from CGMs, this study clearly documents that in addition to the well-known high correlation between HbA1c and MBGCGM there is a large clinically relevant and statistically significant difference in HbA1c (0.45%-0.92% depending on MBGCGM) between otherwise healthy B and W youth with type 1 diabetes which is independent of MBGCGM and other covariates. The combination of MBGCGM and race accounts for a very large amount of the variation in HbA1c in the study population. These data confirm findings from many prior reports of glucose-independent racial disparity in HbA1c which relied on a limited number of blood glucose samples for comparison.
Although we found a clear racial disparity in HbA1c which was independent of MBGCGM in this study, four prior studies which examined the relationship of race and MBGCGM on HbA1c using different CGM systems were not all as definitive. The A1C-Derived Average Glucose Study (ADAG) using a Medtronic CGM reported the adjusted difference in HbA1c between Caucasian and African ancestry adult patients nearly statistically significant P = .07. 21 A second study which included children and adults with type 1 diabetes only calculated MBGCGM using Abbott FreeStyle Libre Pro Flash Glucose Monitoring system and reported a 0.4% average difference in HbA1c between blacks and whites after adjustment for MBGCGM and other covariates. 10 A third study in older adults with both type 1 and type 2 diabetes using Abbott FreeStyle Libre Pro CGM reported a higher percentage of non-white patients having HGIGMI ≥0.5% compared to white patients. 18 A secondary analysis of adults with type 2 diabetes and sleep apnea performed CGM using Abbott FreeStyle Libre Pro and Dexcom G4 Platinum. There was no difference in HbA1c between black and white patients. 29 Potentially differences between studies may be influenced by population differences, proportion of type 1 versus type 2 patients, patient age, comorbidities and other drugs taken, methodology of HbA1c, and glucose measurement. 30
Time in range has been advocated as a clinical guide to diabetes management and is readily available from CGM statistics. 31 In the current study, TIR had a strong inverse correlation with both MBGCGM and HbA1c. It is likely that the correlation of TIR with HbA1c is due to TIR’s close relationship with MBGCGM . However, the strength of the correlation of TIR with HbA1c was less than the correlation of MBGCGM with HbA1c. Again, B patients had higher HbA1c at any given level of TIR than W patients. Thus racial disparity in HbA1c is evident when TIR is used as a metric of glucose control instead of MBGCGM.
The HGI is a simple way to quantify the size and direction of patient differences in HbA1c at any given level of MBG. 28 HGI is calculated from a patient’s measured HbA1c minus the patient’s predicted HbA1c from a population derived regression equation for HbA1c versus MBG.28,30 HGI has several useful properties one of which is complete statistical independence from MBG.28,32,33 HGI is easy to calculate for patients using CGM, as HGI = observed HbA1c- Glucose Management Index (GMI) It should be pointed out that the underlying reference population for GMI was predominantly of non-Hispanic white background. 22 In this study, GMI underestimated actual observed HbA1c for B patients leading to higher HGIGMI for B compared to W patients which is in agreement with the analyses of MBGCGM and TIR on HbA1c. However, we found that HGIGMI or HGIPOP were not the same. For example, HGIGMI was correlated with MBG whereas HGIPOP was not. These differences likely represent differences in populations studied and methods of HbA1c and CGM. This should be kept in mind when calculating HGI using GMI in the clinic.
An HGI of 0.5% would appear to be a clinically useful threshold for patients who would need further evaluation. An HGI of 0.5% would be over the 95 percentile for the W patients in our study population. This level of HGI or higher may confer added risk of chronic diabetes complications even when the MBG and TIR are similar between groups. 32
Prior studies have suggested that young B patients with T1D have higher occurrence of hypoglycemia than W despite having higher HbA1c.18,26,27 In this study, there was no difference in TBR, ie, glucose <70 mg/dL, for B and W patients. There was also no difference in TBR associated with the method of insulin delivery. We surmise that use of CGM monitoring and adjustment of insulin dose based on glucose metrics helped to prevent an excessive amount of hypoglycemia in B patients. 17
The importance of racial disparity in HbA1c which is independent of MBG is controversial.14,15 However, there is evidence that HbA1c disparities are better predictors of complications than MBG or TIR.19,20,32,33 Glucose-independent racial disparity in HbA1c might suggest that B patients have greater risk for diabetes complications at any given level of MBG than W patients. Even though CGM provides comprehensive data on tissue glucose exposure, HbA1c may still have usefulness and provide additional information in addition to CGM data for prediction of diabetes complications. This is certainly a hypothesis that deserves further investigation.
Conclusions
This study demonstrates the presence of a clinically important, higher level of HbA1c which is independent of MBG and other covariates in young patients of self-identified African heritage. The mechanism of this difference is unclear. Potentially factors which increase HbA1c above levels predicted by MBGCGM may contribute to risk for diabetes complications among African heritage patients.
Supplemental Material
sj-docx-1-dst-10.1177_19322968231199113 – Supplemental material for Determination of Glucose-Independent Racial Disparity in HbA1c for Youth With Type 1 Diabetes in the Era of Continuous Glucose Monitoring
Supplemental material, sj-docx-1-dst-10.1177_19322968231199113 for Determination of Glucose-Independent Racial Disparity in HbA1c for Youth With Type 1 Diabetes in the Era of Continuous Glucose Monitoring by Nicholas J. Christakis, Marcella Gioe, Ricardo Gomez, Dania Felipe, Arlette Soros, Robert McCarter and Stuart Chalew in Journal of Diabetes Science and Technology
Footnotes
Abbreviations
B, non-Hispanic black; CGM, continuous glucose monitoring; GMI, glucose management indicator, a predicted HbA1c from MBGCGM; HGIGM, Hemoglobin Glycation Index using GMI as the predicted HbA1c; HGIPOP, hemoglobin glycation index using the population regression equation to predict HbA1c; MBGCGM, Mean Blood Glucose by continuous glucose monitoring; rs, Spearman correlation coefficient; PSU, percent sensor use = the percent of days during the 30-day reporting period with at least 50% CGM readings; MBGSDCGM, standard deviation of the mean blood glucose by continuous glucose monitoring; TBR, percent time sensor glucose level <70 mg/dL; TIR, Percent time sensor glucose level 70-180 mg/dL; T1D, type 1 diabetes; W, non-Hispanic white.
Declaration of Conflicting Interests
The author(s) declared no potential conflicts of interest with respect to the research, authorship, and/or publication of this article.
Funding
The author(s) disclosed receipt of the following financial support for the research, authorship, and/or publication of this article: Dr SC received support from NIH research grants 1R21DK118643-O1A1 and U54 GM104940. Mr NJC is a recipient of a Research Experience for Graduate and Medical Students (REGMS) award from the Endocrine Society. The content of this paper is solely the responsibility of the authors and does not necessarily represent the official views of the National Institutes of Health, the Louisiana Clinical and Translational Science Center or the Endocrine Society.
Supplemental Material
Supplemental material for this article is available online.
References
Supplementary Material
Please find the following supplemental material available below.
For Open Access articles published under a Creative Commons License, all supplemental material carries the same license as the article it is associated with.
For non-Open Access articles published, all supplemental material carries a non-exclusive license, and permission requests for re-use of supplemental material or any part of supplemental material shall be sent directly to the copyright owner as specified in the copyright notice associated with the article.