
Abstract
Diabetes Technology Society organized an expert consensus panel to develop metrics for research in the use of continuous glucose monitors (CGMs) in a hospital setting. The experts met virtually in small groups both before and after an April 13, 2023 virtual meeting of the entire panel. The goal of the panel was to develop consensus definitions in anticipation of greater use of CGMs in hospital settings in the future. Establishment of consensus definitions of inpatient analytical metrics will be easier to compare outcomes between studies. Panelists defined terms related to 10 dimensions of measurements related to the use of CGMs including (1) hospital hypoglycemia, (2) hospital hyperglycemia, (3) hospital time in range, (4) hospital glycemic variability, (5) hospital glycemia risk index, (6) accuracy of CGM devices and reference methods for CGMs in the hospital, (7) meaningful time blocks for hospital glycemic goals, (8) hospital CGM data sufficiency, (9) using CGM data for insulin dosing, and (10) miscellaneous factors. The panelists voted on 51 proposed recommendations. Based on the panel vote, 51 recommendations were classified as either strong (43) or mild (8). Additional research is needed on CGM performance in the hospital. This consensus report is intended to support that type of research intended to improve outcomes for hospitalized people with diabetes.
Introduction
Interest in the use of continuous glucose monitors (CGMs) in the hospital setting has been growing in recent years. The COVID-19 pandemic led to an acceleration of use of this technology. Although the pandemic is currently waning, an increasing number of hospitals are developing programs to use this technology. Hospitals are using various metrics to report their outcomes with CGM related to the amount of time spent in various glycemic ranges and amounts of time necessary to draw conclusions. The inpatient experience compared to the outpatient experience is characterized generally by greater acuity and a much greater fluctuation in severity of underlying diseases that can affect glycemic control. Thus, some of the metrics related to the target levels of glycemia or the amount of time necessary to collect data on outpatients wearing a CGM may not be appropriate for inpatients wearing a CGM.
An expert consensus panel consisting of 13 physician experts in the use of CGMs in the hospital (12 were from the United States and one was from Switzerland) met both before and after an April 13, 2023 virtual meeting of the entire panel, which was also attended by an audience of experts in treating diabetes in the hospital. The goal of the panel was to develop consensus definitions in anticipation of greater use of CGMs in hospital settings in the future. Panelists reviewed available evidence on the inpatient use of CGMs. They defined terms related to nine dimensions of measurements related to the use of CGMs including (1) hospital hypoglycemia, (2) hospital hyperglycemia, (3) hospital time in range, (4) hospital glycemic variability, (5) hospital glycemia risk index, (6) accuracy of CGM devices and reference methods for CGMs in the hospital, (7) meaningful time blocks for hospital glycemic goals, (8) hospital CGM data sufficiency, (9) using CGM data for insulin dosing, and (10) miscellaneous factors.
Recommendations were proposed by the panelists and then reviewed by the entire panel for favorability. Recommendations receiving at least 80% favorable votes were classified as strong recommendations, proposals receiving 60% to 79% favorable votes were classified as mild recommendations, and proposals receiving less than 60% favorable votes were classified as recommendations that failed to receive consensus support.
CGM Use in the Hospital
Following the incremental use of CGM in ambulatory setting in subjects with type 1 diabetes (T1D) and type 2 diabetes (T2D) as well as in the inpatient setting during the COVID-19 pandemic, the utilization of CGM in the hospital has emerged as an important area of clinical and research interest. 1 Bedside capillary point-of-care (POC) glucose monitoring has been the standard of care to assess glycemic control in the hospital. Although POC testing can be performed every one hour in the intensive care unit (ICU) setting, in the general wards clinical guidelines recommend bedside POC testing before meals and at bedtime to assess glycemic control and to adjust insulin therapy. However, POC testing leaves extended intervals of time when glucose is not monitored, leading to missed information about glucose excursions and episodes of hypoglycemia and hyperglycemia.2,3 The use of CGM overcomes the POC limitations by providing a more complete glycemic profile during the hospital stay.
With the increased use of CGM among ambulatory patients, one can expect an increasing number of patients wanting to use CGM while hospitalized. Data from clinical studies in the hospital indicate that the use of CGM technology improves detection of asymptomatic hypoglycemia and hyperglycemia, which in turn might improve outcomes in hospitalized patients with diabetes. However, CGM use in the hospital setting is still considered investigational and CGM devices are not cleared by the Food and Drug Administration (FDA) for inpatient use. Lack of clearance is in part due to concern about the accuracy of CGM devices in critically ill patients (including those with hypotension, hypoxemia, acidosis, anasarca, or vasoconstriction) 3 as well as the limited data from accuracy studies comparing CGM measurements with laboratory measurements. Ongoing assessment of CGM accuracy will be necessary to better understand the clinical applications of CGM in the hospital setting and to develop statistical methods able to account for potential discrepancies between glucose measurements.
Especially after the COVID-19 declaration,4,5 there has been an abundance of studies performed in the hospital setting utilizing CGM devices, reporting different CGM metrics as outcomes. 6 This Consensus Report is intended to provide guidance of how CGM data derived from inpatient use can be standardized to a common set of measures for analytic and reporting purposes.
Standardized CGM metrics can be utilized to provide recommendations to researchers, clinicians, and hospital administrators of how CGM data should be reported and interpreted for research and clinical purposes. In the research inpatient setting, using widely acceptable metrics will make it easier to compare different CGM studies about clinical outcomes, such as, for example, the incidence of hypoglycemia as well as a determination of whether different CGM-based interventions were able to reduce inpatient hypoglycemia. In the clinical setting, standardized CGM metrics may help hospitals and physicians to compare glycemia among different hospitals or even among specific units in the same hospital and identify whether new policies and educational efforts need to be utilized improve glucose control. Although consensus statements reporting CGM metrics are available for the ambulatory setting,7-9 there are no similar publications for the inpatient setting. These recommendations for the outpatient setting cannot be utilized for the hospital setting because of differences between the two environments. For example, calculating glucose management indicator (GMI) requires 14 days of CGM data, which is significantly more than the typical inpatient length of stay.
While the accuracy of CGM is established in ambulatory settings, leading to regulatory approvals worldwide, there is lack of consensus and guidance for validating CGM among hospitalized patients, nor is there yet regulatory approval. Several case series and pilot studies were published during the COVID pandemic and presented preliminary data on accuracy of factory-calibrated CGM devices in this setting (see table below). Most of these studies used capillary POC BG as the comparator/reference method, and less commonly venous or arterial glucose values. The heterogeneity of the population, the number of paired-data point of CGM and comparator, and the number of patients included limits the ability to make conclusions. This consensus report will identify the most important metrics to measure in CGM studies of hospitalized patients, and the report will recommend target values for these inpatient metrics.
Hospital Hypoglycemia
Similar to the outpatient setting7,8 several metrics of inpatient hypoglycemia are proposed in this document.1,10-15 Inpatient hypoglycemia has been associated with adverse outcomes such as prolonged length of stay, higher hospital charges and increased risk for readmission as well as mortality.10,16-19 Reducing hypoglycemia in the hospital is important because it can improve the safety and the qual-ity of health care delivery, leading to better clinical out-comes, reduced nursing workload, and decreased hospital expenses. 20 To best prevent inpatient hypoglycemia, which is defined as glucose values below 70 mg/dL, low CGM hypoglycemic alarms need to be set up at higher thresholds, which can be as high as 85 mg/dL.1,10 As these low glucose alarms are customizable, even higher low glucose thresholds may be selected by nursing staff and/or providers as clinically indicated in very high risk for hypoglycemia patients. It should be noted that CGM accuracy is lower with glucose values in the hypoglycemia range. When the above metrics are utilized among subjects using un-blinded CGM devices, evaluation with POC may be needed to confirm hypoglycemia noted by CGM devices. Concerns about accuracy of CGM devices in the hypoglycemia range can be offset by the continuous monitoring of the glucose values, allowing CGM devices to be utilized like a “safety net” for preventing hypoglycemia—a safety net that currently is not available in the hospital setting.
Lack of standardized metrics can actually lead to under- or over- estimating hypoglycemia. For example, defining a hypoglycemia event as an event that requires continuous CGM values <70 mg/dL for more than 20 minutes, instead of this report’s recommended period of 15 minutes (please see below definitions), which most studies also have used, may lead to underestimation of hypoglycemic events. Similarly, using different times periods for nocturnal hypoglycemia (22:00-06:00 hours instead of 23:00-07:00 hours) or lower values for hypoglycemia thresholds (60 mg/dL instead of 70 mg/dL) may lead to increased and decreased incidence of hypoglycemia, respectively.
Recommendations
Strong Recommendations
Mild Recommendations
Hospital Hyperglycemia
In patients without a prior history of diabetes, inpatient hyperglycemia is defined by any blood glucose concentration >140 mg/dL (>7.8 mmol/L). Measurement of HbA1c at time of hospital admission is indicated in people with hyperglycemia without a history of diabetes to differentiate between stress-induced hyperglycemia and previously undiagnosed diabetes. The definition of inpatient hyperglycemia (glucose concentrations >140 mg/dL) is in accordance with those of the American Diabetes Association (ADA), 21 American Association of Clinical Endocrinologists (AACE) consensus, 22 and the Endocrine Society consensus. 23
In patients with a history of diabetes, hyperglycemia is defined as glucose concentrations >180 mg/dL (>10.0 mmol/L). 9 Level 1 hyperglycemia refers to glucose concentrations between 180 and 250 mg/dL (10.1 to 13.9 mmol/L), whereas Level 2 hyperglycemia is defined by any glucose concentration >250 mg/dL (>13.9 mmol/L). These definitions are in line with the CGM consensus guidelines developed for outpatients with diabetes.
The cause of hyperglycemia is multi-factorial, incorporating patient-specific, illness-specific, and treatment-specific factors (Figure 1). Metabolically, hyperglycemia develops because of one or several of three processes: (1) increased hepatic glucose production, (2) decreased peripheral glucose utilization, or (3) deficient insulin secretion or insufficient exogenous insulin availability (Figure 1). 24
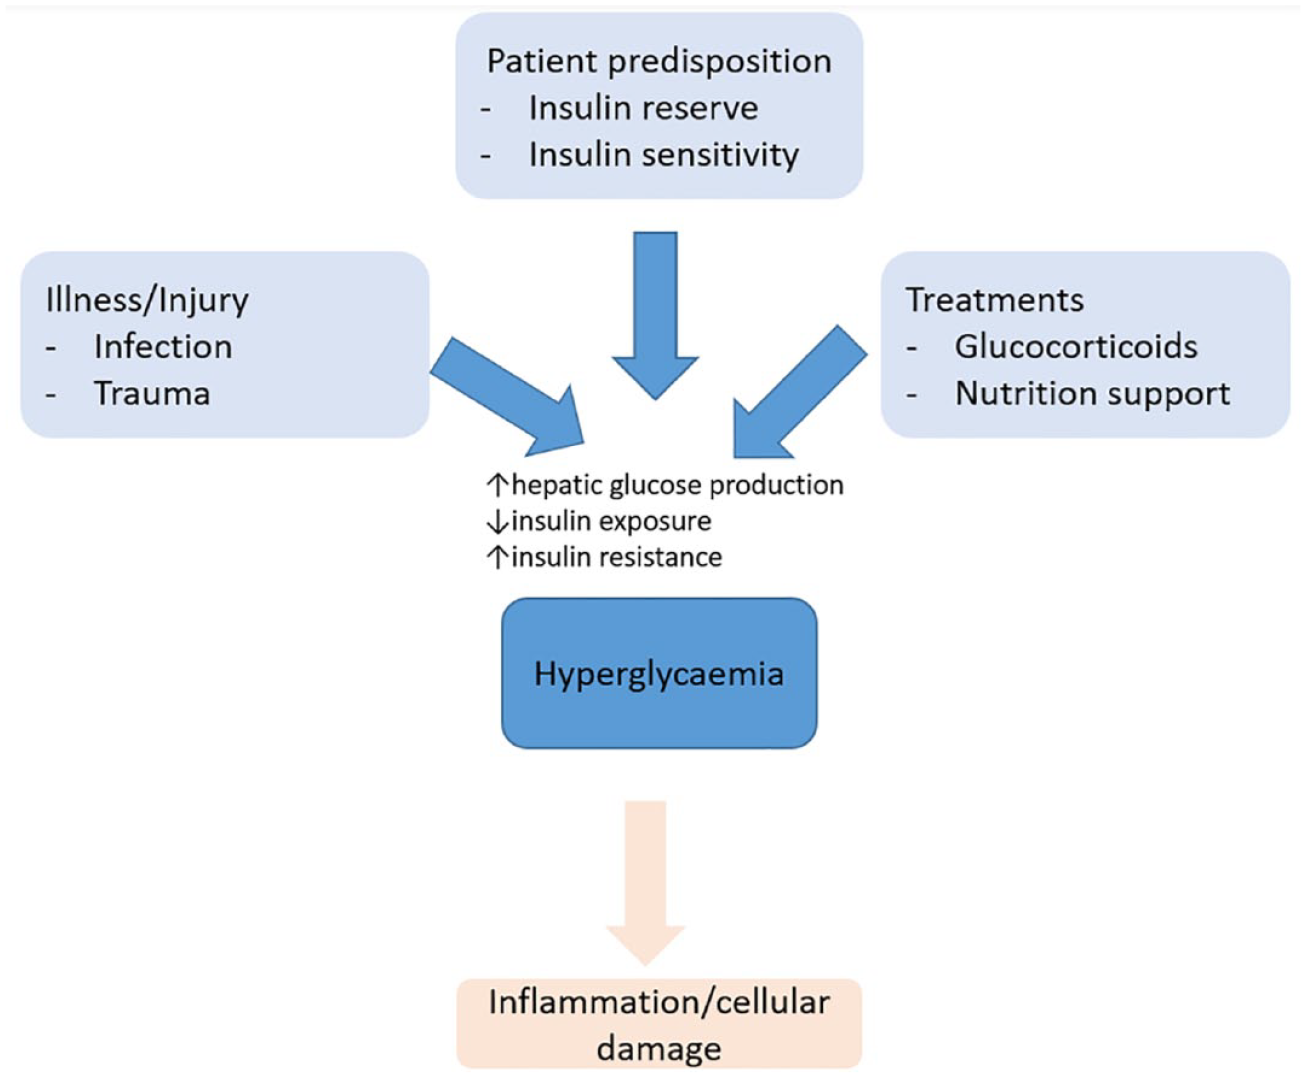
Pathophysiology of hyperglycemia in the hospital.
Hyperglycemia in critical and non-critical care patients upregulates inflammatory and oxidative stress markers.25,26 The interplay between inflammation, oxidative stress, and hyperglycemia may predispose to vascular and immune dysfunction, thus contributing to poor clinical outcomes, such as infections, organ dysfunctions, and mortality.27,28 In particular, glucose concentrations >200 mg/dL (11.1 mmol/L) increase the risk for infectious complications. 29 Thus, various clinical societies suggest to keep the blood glucose concentration in the non-hyperglycemic range (defined as <200 mg/dL, 180 mg/dL, or <140 mg/dL, respectively). Most guidelines suggest initiating insulin at blood glucose concentrations >180 mg/dL (checked on two occasions).
Recommendations: Hyperglycemia
Strong Recommendations
A hyperglycemic event in the hospital should be defined as sensor glucose value >180 mg/dL [10.0 mmol/L] of at least 15 minutes duration for people with pre-existing diabetes and ≥140 mg/dL [7.8 mmol/L] for those with normal glucose concentrations pre-admission. If CGM values are all <180 mg/dL for at least 15 minutes, then subsequent hyperglycemia with CGM values >180 mg/dL for at least 15 minutes would be considered a separate event.
The burden of hyperglycemia in the hospital should be reported as both proportion of time (%) and number of minutes spent with sensor glucose values above the hyperglycemic threshold and the number of events with hyperglycemic sensor values.
Time spent in hyperglycemia should be reported as a proportion of time (%) and number of minutes, per day and per the entire hospital admission.
Hyperglycemia should be further subdivided into Level 1 (181-250 mg/dL [10.1 mmol/L-13.9 mmol/L]) and Level 2 hyperglycemia (>250 mg/dL [>13.9 mmol/L]).
Mild Recommendations
Prolonged hyperglycemia is considered a Level 2 hyperglycemic event (>250 mg/dL [>13.9 mmol/L]) continuously for at least 120 minutes.
Hospital Time-in-Range
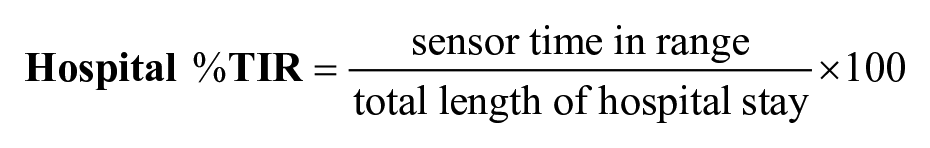
Time in Range is the duration of time spent in an acceptable glucose range over a defined time. This value is measured using CGM generated glucose data (sensor glucose values every one to five minutes). Percent TIR (%TIR) is calculated by dividing the total time that sensor glucose values were in range by a specified total time (hours or days), then multiplying by 100. TIR may be calculated over different defined time periods based on clinical utility/relevance or planned statistical analyses.
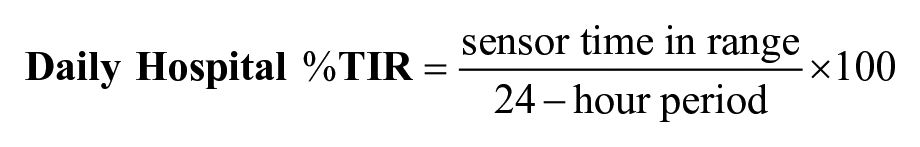
Calculating daily hospital %TIR provides a summary of daily data most relevant for clinical decision-making and shorter term regimen adjustments, while multiple-day (or overall) hospital %TIR provides longer term glycemic control patterns to help identify necessary changes in glycemic management strategy or clinical factors impacting glycemic control. Shorter timeframes for %TIR analysis, such as eight- or 12-hour periods coinciding with hospital staff shift changes, may also be considered.
Defining TIR in the hospital involves the following:
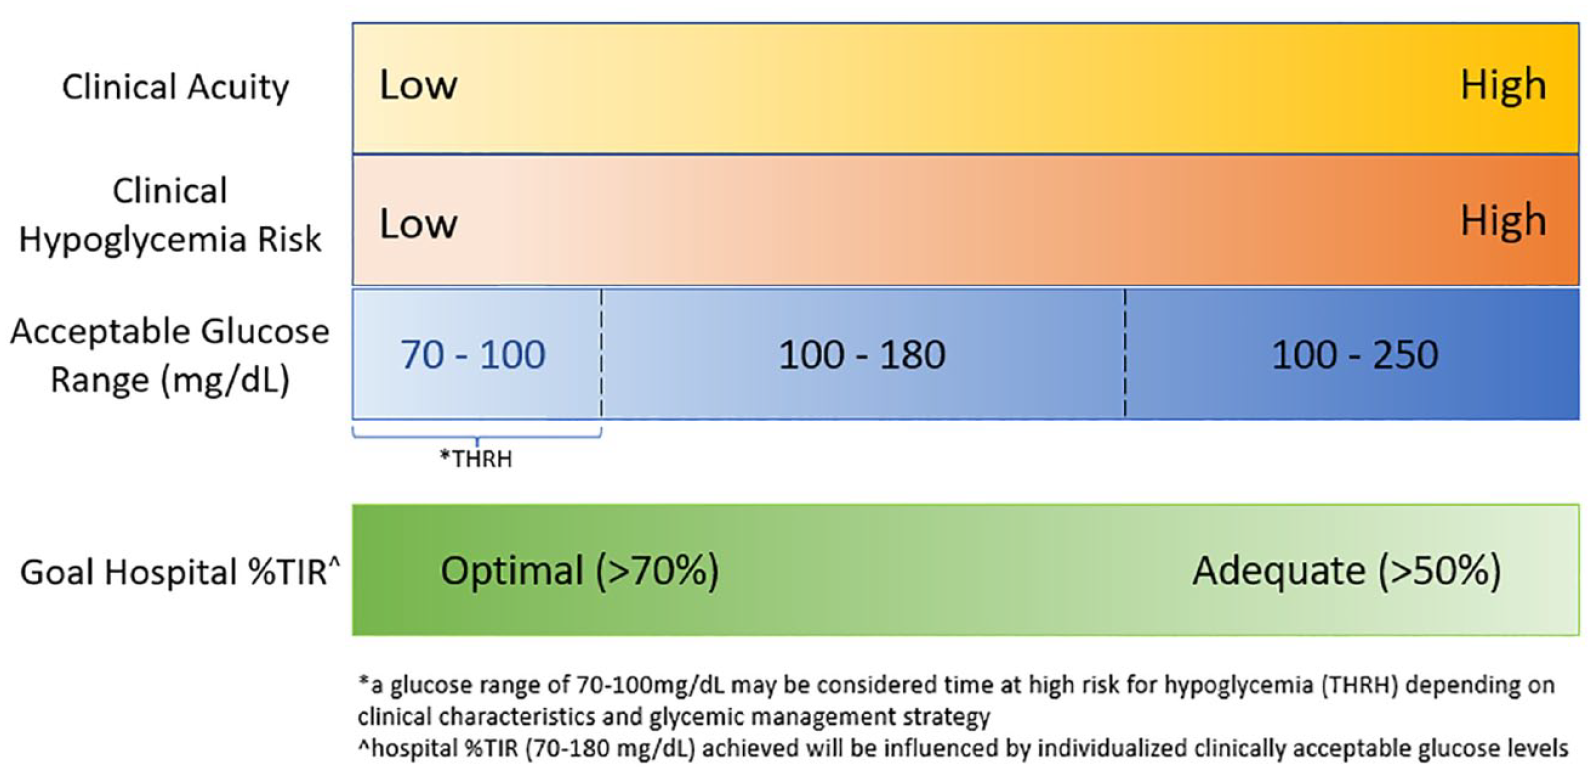
Relationship between clinical presentation (acuity, hypoglycemia risk), clinically acceptable glucose target ranges and goal hospital %TIR.
For certain patients, the range of glucose values between 70 and 100 mg/dL may be considered a time at high risk for hypoglycemia (THRH) depending on clinical factors and glycemic treatment regimen. Contrastingly, there may be situations where a more stringent upper-range glucose limit is desired for tighter glycemic control (ie, 140 mg/dL in cardiac surgical patients). Assessment of percentage of time spent within these specific glucose ranges may be considered separately from the TIR metric in statistical analyses.
Hospital %TIR provides a summarized estimation of overall achieved glycemic control during hospitalization. Although targets may be more difficult to achieve during acute illness, assessment of hospital %TIR can facilitate a longitudinal assessment of glycemic control during the hospitalization, and response to therapy.13,14,32-34 Although %TIR goals outlined below may be difficult to achieve in a subpopulation of patients depending on clinical factors and management regimen complexity, this approach highlights the need for individualization of %TIR goals. Standardization of this metric for defining ranges for research purposes might not apply to target glycemia for the care of individual patients. Individualized goals for various types of patients may be needed to minimize both hyper- and hypoglycemia associated with poor hospital outcomes. These goals may include individually recommended target glucose ranges, %TIR (70-180 mg/dL), and optimal data adequacy for TIR calculation. Determining these goals will require additional investigation.
Recommendations: Hospital TIR
Strong Recommendations
There should be an emphasis on separating the defined hospital TIR glucose range (70-180 mg/dL) from clinically acceptable glucose target ranges used for clinical care and inpatient glucose monitoring and interventions (ie, CGM hypo- and hyperglycemia alert settings).
Individualized clinically acceptable target glucose ranges may vary based on clinical utility (safety, efficacy, clinical alerts). Example ranges can include the following: From 100 to 180 mg/dL (most of the hospitalized patients) From 100 to 250 mg/dL (clinical instability, high hypoglycemia risk, limited life expectancy) For certain patients, glucose values of 70 to 100 mg/dL may be considered as time at high risk of hypoglycemia (THRH), prompting changes to guide clinical care and monitoring of glycemic control to prevent hypoglycemia. Although this glucose range is included in the %TIR metric, analysis of THRH separately from %TIR may be further investigated. Similarly, there may be situations where analysis of %TIR using a more stringent upper range glucose limit is needed. Analysis of percentage of time in specific glucose ranges may be considered.
The hospital %TIR (70-180 mg/dL) achieved will reflect individualized clinically acceptable target glucose ranges. A lower %TIR achieved would be expected for those with higher acceptable glucose ranges intended to minimize hypoglycemia risk. In addition, %TIR is expected to change based on other range metrics (TAR, TBR).
The use of hospital %TIR will include options for assessment over variable timeframes that coincide with meaningful durations of wear for the inpatient setting; suggested timeframes include: Per shift (eight or 12 hours) 24 hours/daily Entire duration of the hospital admission
Hospital Glycemic Variability
Glycemic variability (GV) can be defined as the presence of fluctuations or oscillations of glucose levels over time. In addition to hyperglycemia and hypoglycemia, increased GV has been identified as an independent predictor of morbidity and mortality in critically and non-critically ill hospitalized patients.35-37 Since the adoption of CGM, the availability of frequent determinations of glucose values now allows for a more accurate representation of GV, especially when compared to the conventional point of care fingerstick blood glucose (POC BG) monitoring.
Despite multiple proposed methods to measure GV, no consensus has been reached as to which is most precise or clinically significant. Standard deviation (SD), coefficient of variation (CV), and MAGE (mean amplitude of glucose excursion) have been the most studied approaches. 38 While SD (expressed as mg/dL or mmol/L) measures the amount of variation or dispersion of glucose values in relation to the mean, CV (expressed as % and calculated as the SD divided by the mean) is meant to adjust for the mean and has been identified as a strong predictor of hypoglycemia. 39 MAGE, on the other hand, was designed to capture postprandial glucose excursions and is calculated using the difference between sequential glucose peaks and nadirs and is expressed as mg/dL or mmol/L. 38 Of these 3 measures, CV and SD are commonly available in CGM download reports, whereas MAGE requires special calculation and its applicability in clinical practice has been limited by the lack of standardization with respect to its definitions, algorithms, and methods for its determination. The clinical significance of GV within specific intervals of time is also not clearly understood. For example, for hospitalized patients, GV could be determined as glucose fluctuations within each 24-hour block (intra-day GV), differences of GV between days (inter-day GV), or across the complete length of the hospital stay (total GV) (Figure 3).40,41 Most studies measuring GV in hospitalized patients using CGM have used all available sensor data values throughout the stay.42-45
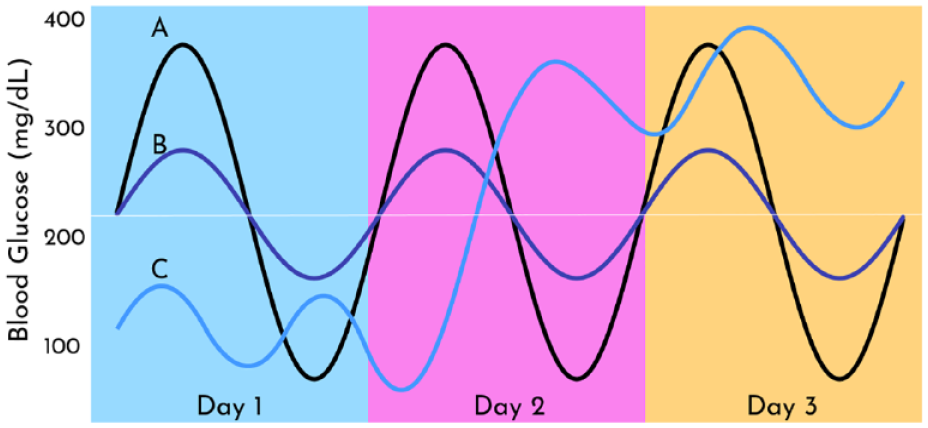
Three different hypothetical patient glucose profiles with the same mean glucose over three days.
Several studies in critically ill and non-critically ill hospitalized patients have shown the independent association between high GV and poor clinical outcomes.35-37,42,43,45,46,47 Although studies assessing GV have usually included all value points during hospital stay, evaluation of daily data on hospitalized patients may provide sufficient information to make therapeutic changes when needed. Though multiple metrics have been suggested to measure GV, CV, and SD are the most commonly reported. Given that CV inherently adjusts for the mean glucose, high CV has been strongly associated to the risk of hypoglycemia. On the contrary, SD is known to be highly correlated with the mean glucose, and it may be also useful when the effects of GV are intended to be separated from those of hypoglycemia. 37 In the ambulatory glucose profile (AGP) of the two most commonly used CGMs, Abbott Libre and Dexcom, currently only CV is available in the Libre AGP, while both CV and SD are available in the Dexcom AGP (Figure 4). Although no recommendations currently exist as to how to interpret GV metrics from inpatient CGM, in the ambulatory setting it has been suggested that a CV value <36% represents low GV and a relatively stable glucose profile, whereas a CV value ≥36% indicates an unstable glucose profile and higher risk of hypoglycemia. 48
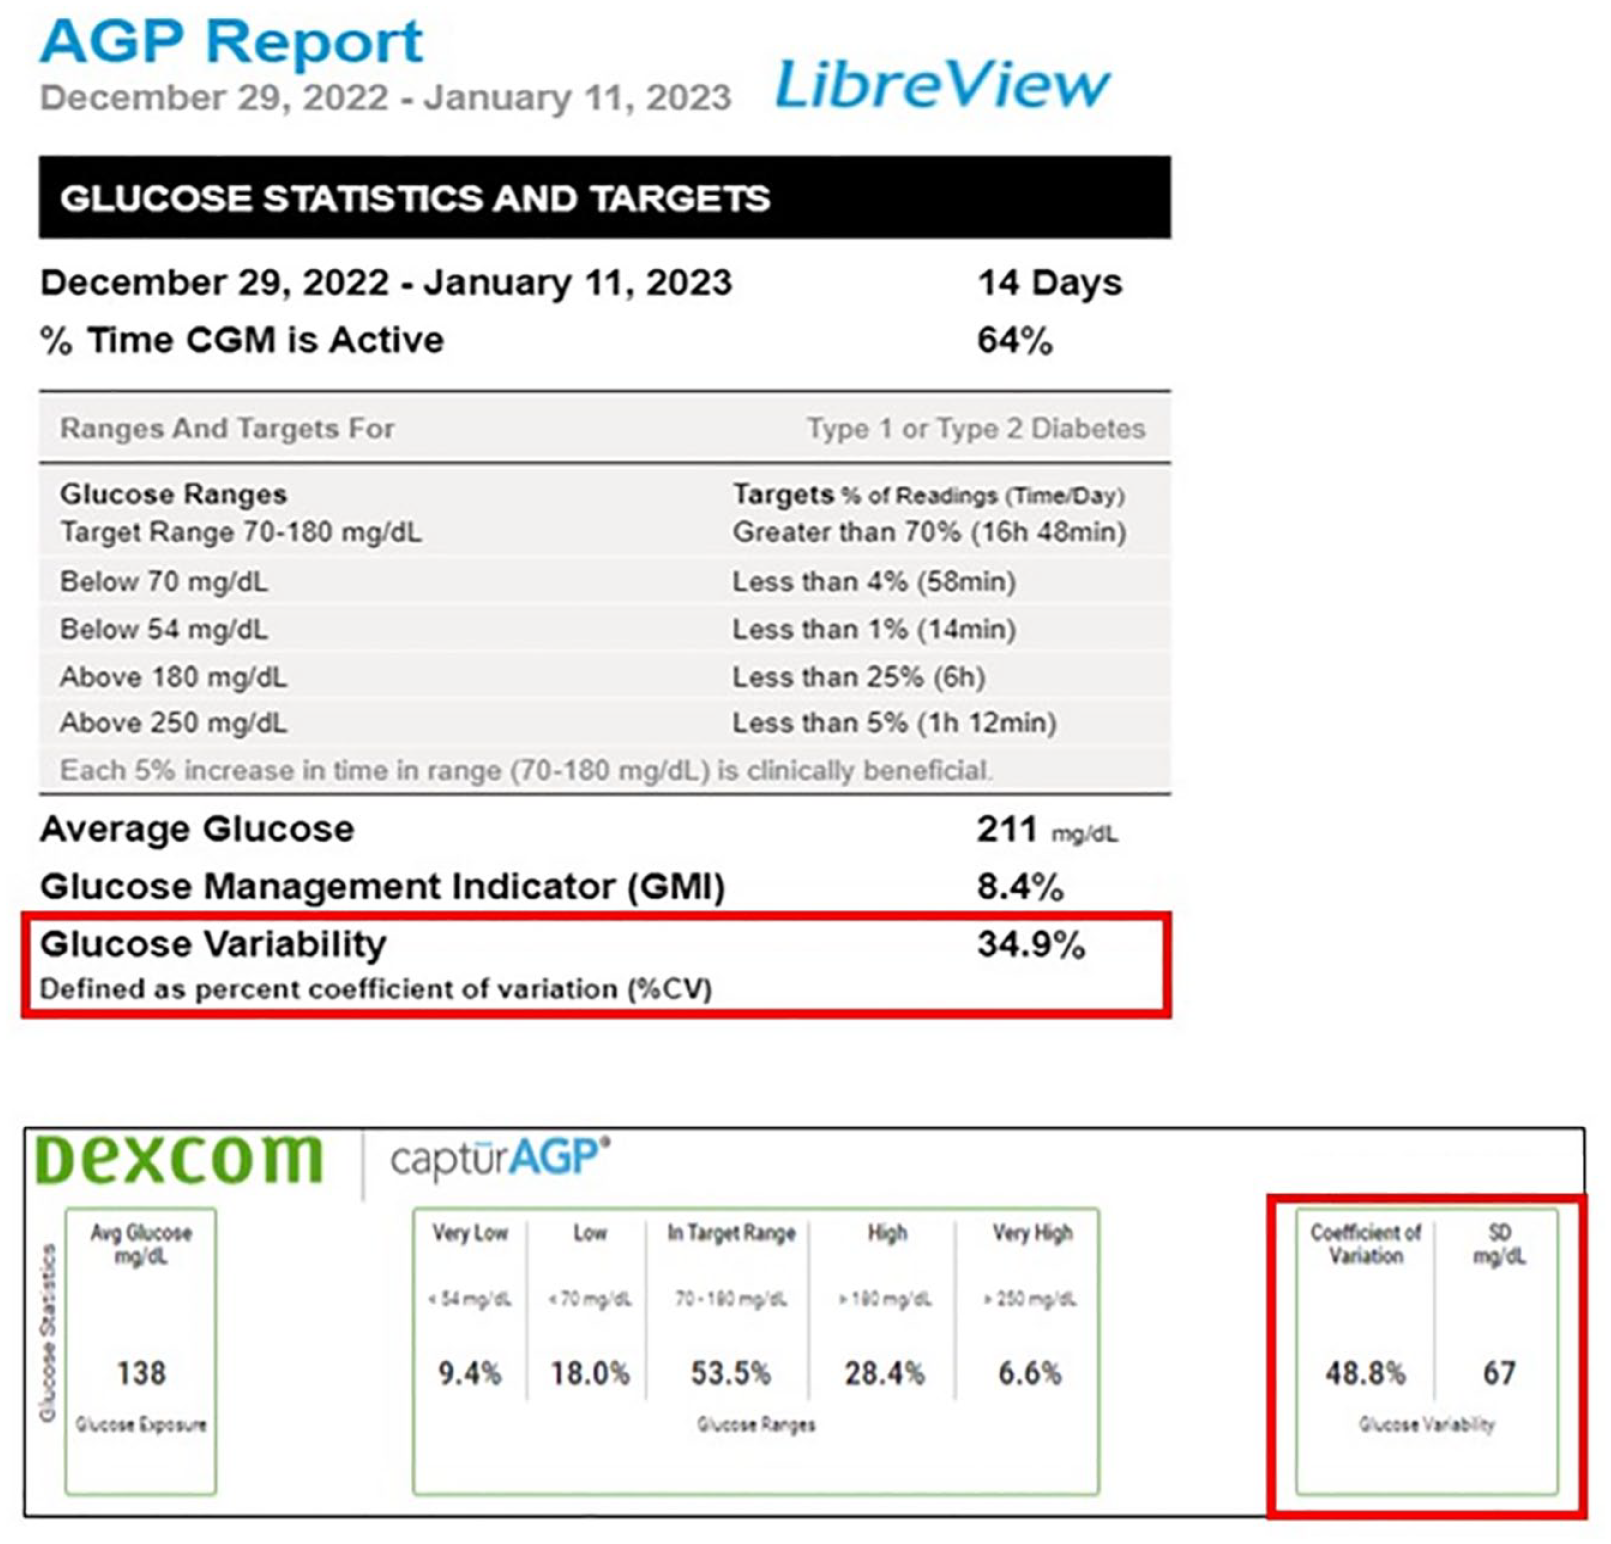
Ambulatory glucose profiles (AGP) of Abbott Libre CGM on the top and Dexcom CGM on the bottom with their available glycemic variability metrics. LibreView is a trademark of Abbott or its related companies. Top image reproduced with permission of Abbott, 2023. All rights reserved. Bottom image reproduced with permission from Dexcom. This image and data are for illustration purposes only.
With respect to the SD, given that glucose values are usually not normally distributed, there is not a specific threshold value that has been recommended. Instead, aiming for an SD that is lower than the result of the mean glucose divided by three, it has been suggested as a reference to assume low GV and a stable glucose profile.49,50 In summary, GV has shown to be a strong independent predictor of poor clinical outcomes in hospitalized patients, and CV and SD appear to be the most useful tools to assess and determine GV in this population. Given that CV correlates directly with risk of hypoglycemia and SD informs on the overall variability around the mean, these two metrics could be used in combination to allow the interpretation of CGM data and GV assessment. In the new era of inpatient CGM, abundance in glucose data will hopefully allow for more in-depth analyses of how GV may be involved in the detrimental pathways of dysglycemia, and how to generate strategies to decrease GV and improve outcomes in hospitalized patients.
Recommendations: Glycemic Variability
Strong Recommendations
It is important to recognize the potential association between increased glycemic variability and poor clinical outcomes in hospitalized patients independent from hyperglycemia and hypoglycemia.
Standard deviation and CV should be used as the main metrics to assess GV in patients using CGM based on their ease of calculation and availability on CGM reports. SD varies linearly with mean glucose while CV does not.
One can measure GV in various intervals of time, such as assessing glucose fluctuations within each 24-hour block (intra-day GV), differences of GV between days (inter-day GV), and across the complete length of the hospital stay (total GV).
Use of mean amplitude of glycemic excursions (MAGE) should be limited, given the lack of standardization with respect to its definitions, algorithms, and methods for determination.
Given that CV correlates directly with risk of hypoglycemia while SD informs on the overall variability around the mean, a researcher can consider the complementary use of the two metrics to allow for a more complete assessment of potential GV effects on study outcomes.
Hospital Glycemia Risk Index (GRI)
Glycemia Risk Index (GRI)
The GRI is a proposed indicator of quality of glycemia based on duration and severity of hypoglycemia and hyperglycemia from the last two weeks of CGM data. During the development of GRI, 14-day CGM tracings from 225 insulin-treated adults with diabetes were ranked from best to worst by 330 highly experienced clinicians. 51 The GRI was developed using principal component analysis and multiple regression and was strongly associated with the clinician’s ranking of overall quality of glycemia (r = 0.95). 51 The GRI can be measured using the published formula (GRI = [3.0 × % time below 54 mg/dL] + [2.4 × % time below 70 mg/dL] + [1.6 × % time above 180 mg/dL] + [0.8 × % time above 250 mg/dL]) as well as using online calculator available at the Diabetes Technology Society website (https://www.diabetestechnology.org/gri/). The GRI ranges from 0 to 100, the lower GRI is better. GRI can also be displayed using visual grid (Zone A to E where Zone A is better while Zone E is worse; Figure 5). 51
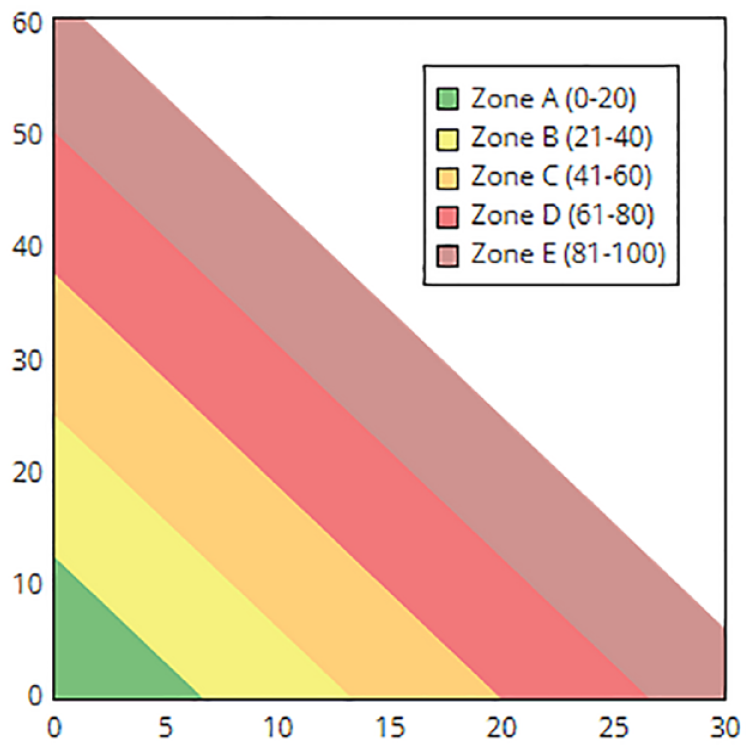
Glycemia Risk Index (GRI) grid showing five distinct zones of glycemic quality. Zone A represents the best while Zone E represents the worse glycemic quality based on exposure to hypoglycemia (X-axis) and hyperglycemia (y-axis). GRI score ranges from 0 to 100 where a lower number is better. Image is adapted from Diabetes Technology Society. https://www.diabetestechnology.org/gri/
Considering the limited utility of HbA1c in day-to-day management of diabetes, the CGM metrics and goals are recommended by the international consensus to optimize diabetes management. 7 CGM provides much detailed data as compared to finger stick glucose data or HbA1c that are easy to visualize, interpret, and helpful to optimize glycemic controls. However, solitary CGM metrics are not without limitations. First, currently defined time in range (TIR; % time spent between 70 and 180 mg/dL) is wide and at any given TIR, there could be wide variations in HbA1c (eg, at 70% TIR, 95% confidence interval [CI] for estimated HbA1c would be 5.6%-8.3%). 52 The current definition of TIR is based on expert consensus 7 and may evolve overtime as new evidence emerges from clinical trials. Finally, TIR alone without other CGM metrics such as time below range (TBR, % time spent below 70 mg/dL) may have limited value in managing patients with diabetes. Therefore, various CGM metrics such TIR and TBR should be evaluated together to interpret CGM data and make meaningful recommendations to patients for optimizing glycemic outcomes.
Considering limitations of TIR, Klonoff and colleagues have developed a composite CGM metric, glycemia risk index (GRI) that encompasses both hypoglycemia and hyperglycemia and provides a single numerical value to indicate quality of glycemia 51 as described in the Methods section above.
GRI can be useful evaluating glycemia quality of patients over time in clinical as well as in research settings. A recent study has suggested that CGM sampling duration of 7 days is reasonably good enough to evaluate GRI in ambulatory settings. 53 Therefore, GRI can be useful in research settings where intervention is expected to improve glycemic control (either improvement in TIR or reduction in TBR) in a short span. However, optimal CGM duration for GRI estimation in hospital setting is currently unknown. Another advantage of GRI is that changes in GRI is expected to be greater than changes in TIR alone because GRI takes both hyperglycemia and hypoglycemia in account. In post hoc analyses of 3 randomized clinical trials of ambulatory patients that used hybrid closed loop among 45 patients with T1D who had >5% time below 70 mg/dL during open loop, glycemic quality by GRI improved more than TIR (−13.2 percentile vs +5.1%) during closed loop. 54 In another study comparing glargine-300 U/mL and glargine-100 U/mL in children and adolescents with T1D, there was a significant improvement in GRI (−9 percentile, P < .05) while there was a slight increase in TIR (+6%, P = .05). 55
Similar to HbA1c and TIR, GRI has a few limitations. First, GRI development cohort lacked the data on individuals with pregnancy and diabetes and thus, use of GRI during pregnancy may require caution. Second, GRI does not distinguish by time of day and therefore, improvement in GRI with an intervention cannot be separated by the time of the day (eg, daytime vs night or preprandial vs postprandial). Since GRI is a relatively new CGM metrics, current evidence of GRI use in inpatient settings is lacking. Inpatient glycemic metrics may be different from CGM metrics recommended for outpatient settings. Therefore, there is a need to develop a modified GRI for inpatient settings and future studies in inpatient settings evaluating GRI/modified GRI and its association with hospital outcomes are required.
Recommendations: GRI
Strong Recommendations
Glycemia Risk Index, a composite metric of individual AGP measurements, may be used in clinical and/or research setting to assess the quality of glycemic control.
A minimum of 24 hours of sensor duration is suggested to calculate GRI.
Day-to-day change in GRI may help clinicians to evaluate the progress of diabetes management.
More research is needed to evaluate GRI and its association with outcomes in inpatient settings.
Accuracy of CGM Devices and Reference Methods for CGMs in the Hospital
The current standard-of-care for glycemic monitoring in patients admitted to the hospital is point-of-care capillary blood glucose (POC BG). 21 This method has been widely implemented in most hospitals in the United States. However, POC BG is intensive, with high demands on nursing effort/time, requiring intensive quality control and much training of hospital personnel. 56 Furthermore, POC BG provides a limited assessment of glycemic excursions during the 24-hours, particularly for identifying asymptomatic and nocturnal hypoglycemic events.1,11,57 Since CGM systems measure glucose every 1 to 5 minutes, several studies have demonstrated that CGM can improve detection of hypoglycemic events, hyperglycemic excursion, and more importantly, prolonged hypoglycemic events (eg, lasting for 120 minutes), asymptomatic hypoglycemia and nocturnal glycemic excursions.7-9
Among studies comparing the accuracy of newer CGMs in non-critically ill patients, the overall mean absolute relative difference (MARD) was reported from 9.4% to 15.6%, with a Clark Error Grid (CEG) analysis demonstrating >90% to 97% of values within Zones A and B (safety zones). Studies of newer CGM sensors in critically ill patients are scarce (Table 1).
Studies Comparing the Accuracy of CGMs With a Comparator.
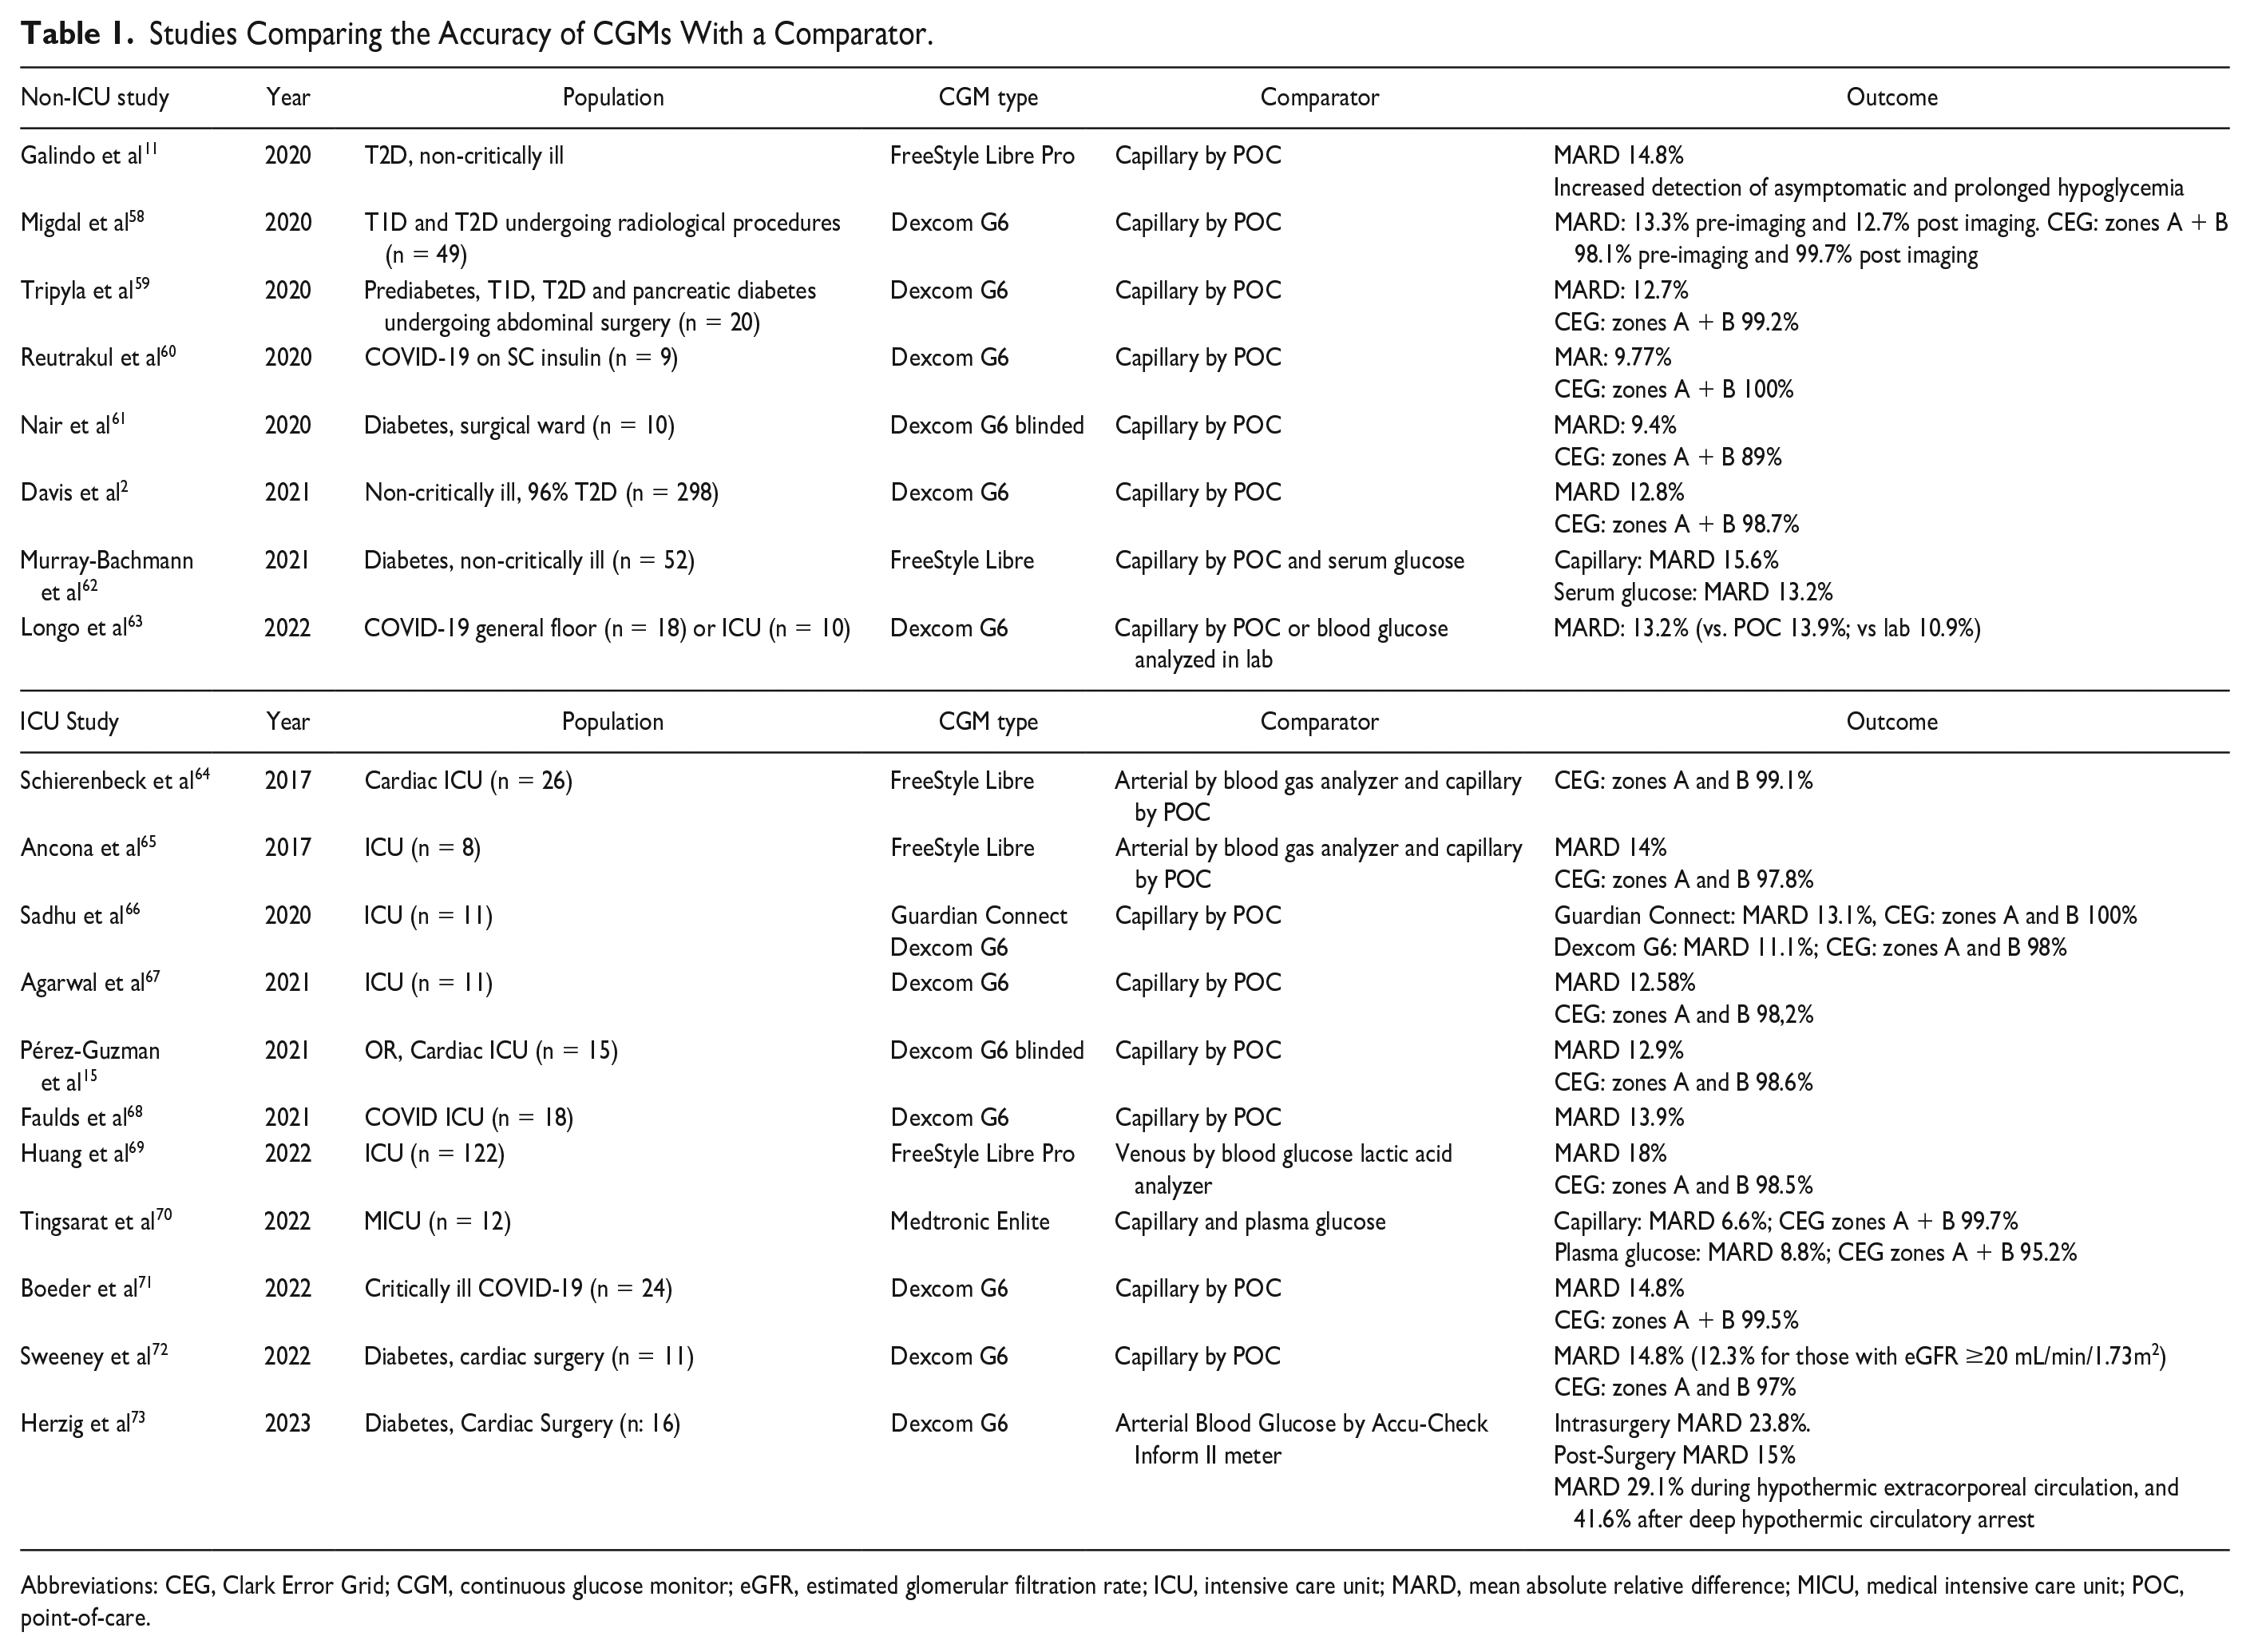
Abbreviations: CEG, Clark Error Grid; CGM, continuous glucose monitor; eGFR, estimated glomerular filtration rate; ICU, intensive care unit; MARD, mean absolute relative difference; MICU, medical intensive care unit; POC, point-of-care.
Using POC BG as the reference method for studies on accuracy of CGM in the hospital has some limitations:74-77 (1) not all glucose meters are approved for POC BG testing in the hospital, particularly in critical care settings; (2) real-world studies have shown inaccuracy of commercially available glucose meters 78 ; and (3) POC BG is not con-sidered the gold-standard for glucose measurement or adequate for regulatory clearance, but selected benchtop glucose analyzers or laboratory analyzers can be used as reference instruments to measure plasma glucose obtained for either fingerstick or venous blood samples. Another major knowledge gap is the lack of guidance for standards of CGM accuracy in the hospital. Specifically for the hospital setting, it is unclear what accuracy metrics are adequate, whether established targets for those accuracy metrics for ambulatory can be extrapolated, and which is the best comparator/reference.
The accuracy needed for adjunctive use of CGM does not need to be as stringent as for nonadjunctive use. Some situations where CGM can be used adjunctively include (1) detection of hypoglycemia, (2) detection of clinically relevant hyperglycemia,9,13 and (3) hybrid protocols68-70,79 consisting of periodic POC glucose measures at key time points when CGM values are most likely to have clinically relevant deviations from POC BG concentrations. For example, a protocol developed for use during the COVID-19 pandemic specifies that CGM could be used safely non-adjunctively in ICU patients receiving IV insulin after two consecutive hourly CGM glucose values were within ±20% of the concurrent POC BG value for POC BG >100 mg/dL or within ±20 mg/dL for POC BG <100 mg/dL. Thereafter, POC BG was required every six hours, for high/low threshold alerts or predicted alerts, or in case of important changes in clinical status such as initiation of vasopressors or intubation. Another strategy used CGM non-adjunctively after 24 hours following confirmation of accuracy by the endocrine team. Intravenous insulin adjustments were then made with POC BG alternating with CGM values every other hour, and additional POC BG was required for hourly glucose rate of change >100 mg/dL or if there was any >20% difference between POC and CGM. Among floor patients, POC BG was obtained every 12 hours. 80
Traditionally, the MARD or mean absolute difference (MAD), analyses, and the “15%/15 mg/dL or 20%/20 mg/dL” have been used for accuracy assessment of CGM in ambulatory settings and in recent pilot CGM studies in the hospital. 77 It should be noted that the Clarke, Parkes, and Surveillance Error Grids were developed for BG monitor accuracy and were published before CGM systems were widely used, particularly factory-calibrated system. However, there is a lack of recommendations on what MARD or MAD and median ARD values are considered adequate for hospital use and furthermore, for insulin dosing in this setting.
Guidelines from the FDA for CGM accuracy testing published years ago recommended that >87% of overall CGM values were ±20% of the reference standard, for CGM values <70 mg/dL, >85% of values should be within ±15 mg/dL of the reference method, for values between 70 and 180 mg/dL, >70% of values should be within ±15% of the reference standard, and for values >180 mg/dL, >80% of values should be within ±15% of the reference standard (Figure 6).77,81
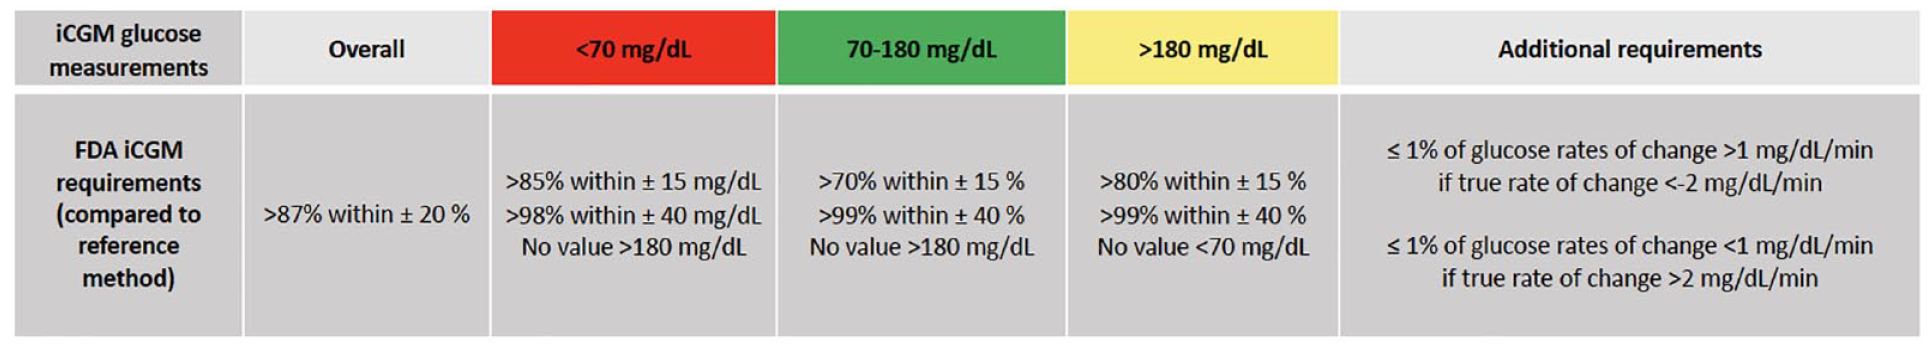
Summary of FDA requirements for Integrated CGM (iCGM) Systems in Ambulatory Settings. 82
A prior consensus report in 2013 prior to development of the types of CGM sensors now used in hospitals recommended the same specific minimum standards for measuring the accuracy of both glucose meters and CGM systems in critical care settings. This report recommended that 98% of values of glucose values are within 12.5% of a reference (or within ±10 mg/dL for readings <100 mg/dL); with the remaining 2% within 20%. 63 This target exceeds the capabilities of current CGMs used in both outpatient and inpatient settings. Future studies, consensus panels, or regulatory guidance should determine realistic targets for modern CGM systems in a hospital ward setting and an ICU setting.
Another area of future research should include potential interferences from chemical and mechanical causes, including exposure to radiological studies, low and high oxygen concentration situations. These situations are expected to be more commonly seen in the hospital. 83
Recommendation: Accuracy of CGM Devices
Strong Recommendation
For CGM data analysis, only raw CGM data, such as a CSV file viewable in a spreadsheet program, should be used. The use of CGM statistics from device software platforms should be avoided.
Meaningful Time Blocks for Hospital Glycemic Goals
Inpatient rates of both hyper- and hypoglycemia can be time dependent. Overnight hypoglycemia is a barrier to effective glycemic management. Glycemic reporting aligned with shift schedules is recommended. Use of in hospital CGM could mitigate much of overnight hypoglycemia.
Traditionally, inpatient glycemic metrics derive by measuring the number of point–of-care capillary blood glucose (POC-BG) determinations in a specific range. Several organizations have developed consensus for POC-BG targets for optimal inpatient care. POC-BG of 100 to 180 mg/dL (which is the target range for most general medical /surgical patients), hypoglycemia: less than 70 mg/dL, severe hypoglycemia: less than 54 mg/dL, hyperglycemia: greater than 180 mg/dL, each divided by the total number of blood glucose tests.21,23 Although the percentage of total readings is one way to present data, day weighted or stay weighted presentations may be more clinically meaningful. This metric is generally easy to obtain and follow for evaluation of inpatient hyperglycemia glycemic management but likely misses many important clinical events.21,84 While nocturnal hypoglycemia is a frequent and often clinically missed event—no specific recommendations exist for glucose targets based on time of day for inpatients. The rapid introduction of CGM into the inpatient care area has provided more detailed information as to the frequency and timing of hyperglycemic events and hypoglycemia.13,84,85
Studies examining traditional POC BG to either real-time CGM or blinded CGM have demonstrate general reliability and an increase in the detection of nocturnal hypoglycemia.11,13,84,85 Glucose values in hospitalized patients vary by time of day. The overnight period is associated with the highest rate of hypoglycemia and the least amount of BG tests. Different studies have defined “nocturnal” as the period between 24:00 and 06:00 hours. Alternatively, hyperglycemia, hypoglycemia, and severe hypoglycemia rates can be reported as a function of nursing shift and insulin use. This could allow for simplified EHR based dashboards and development of glycemic improvement projects focusing on a provider team (eg, night shift). We recommend use of these periods as a standard practice.
Glucose values in hospitalized patients vary by time of day. Day and evening shifts, 07:00 to 15:00 hours and 15:00 to 23:00 hours, associated with meals and associated hyperglycemic events and overnight or nocturnal, 23:00 to 07:00 hours associated with higher rates of hypoglycemia. Hypoglycemia events measured by blinded Libre CGM found that approximately one of three of subjects who were entered into a trial of inpatient CGM experienced a hypoglycemic event (CGM glucose <70 mg/dL). Using the suggested time point cut offs, most (60%) of hypoglycemic events occurred during the night shift/nocturnal period), compared to during the combined time blocks of days and evenings, which amounted to almost twice as much time observed in a hypoglycemic range in the nocturnal block than in the other two blocks combined. Hypoglycemic events were observed to be longer and more frequent in the nocturnal time block. In total, 12% of CGM values were recorded below 70 mg/dL in insulin-treated patients with 25% of the occurrences noted in the overnight period lasting on average 270 minutes, range 130 to 470 minutes. 4 This would be expected as the same predictors of hypoglycemia: age, lean body mass index (BMI), End-stage renal disease (ESRD), and liver disease all also track to persons with low glycogen stores—making the overnight, generally an unfed state, a high-risk period to develop hypoglycemia. Unfortunately, nights are traditionally understaffed, and fewer POC BG tests may be obtained. This may result in patients having unrecognized overnight hypoglycemia. Real-time use of CGM could have detected these events on average three hours prior to the low POC-BG reading. Using the suggested metrics by this consensus group, data are displayed for an inpatient basal-bolus insulin-treated subject group by percent of time in glucose ranges and by time of day. Interestingly, studies designed to use CGM to prevent nocturnal hypoglycemia have failed to show statistically significant impact on lowering the nocturnal hypoglycemia rate, perhaps because of small sample sizes. 13 Use of in-hospital CGM could mitigate much of overnight hypoglycemic events and needs larger studies to validate. This resonates with the Endocrine Society’s recent recommendation for initiation of CGM in the inpatient setting for patients at high risk for hypoglycemia.23,86 As providers transition from traditional POC BG testing to use of inpatient CGM, defining targets for CGM data will become increasingly important. Tables 2 and 3 are unpublished examples of how CGM data metrics (as shown in Table 2) differ from traditional reporting POC metrics (as shown in Table 3). These tables report the incidence of hypoglycemia by eight-hour time blocks. They demonstrate how the percentage of time spent in hypoglycemia, as detected by CGM (unlike detected by POC BG) is heavily weighted to nocturnal time frames.
Percent CGM Values by Time of Day (in Hours) for 2 Basal Bolus Subjects. Average Duration of CGM Use is 2.9 Days.
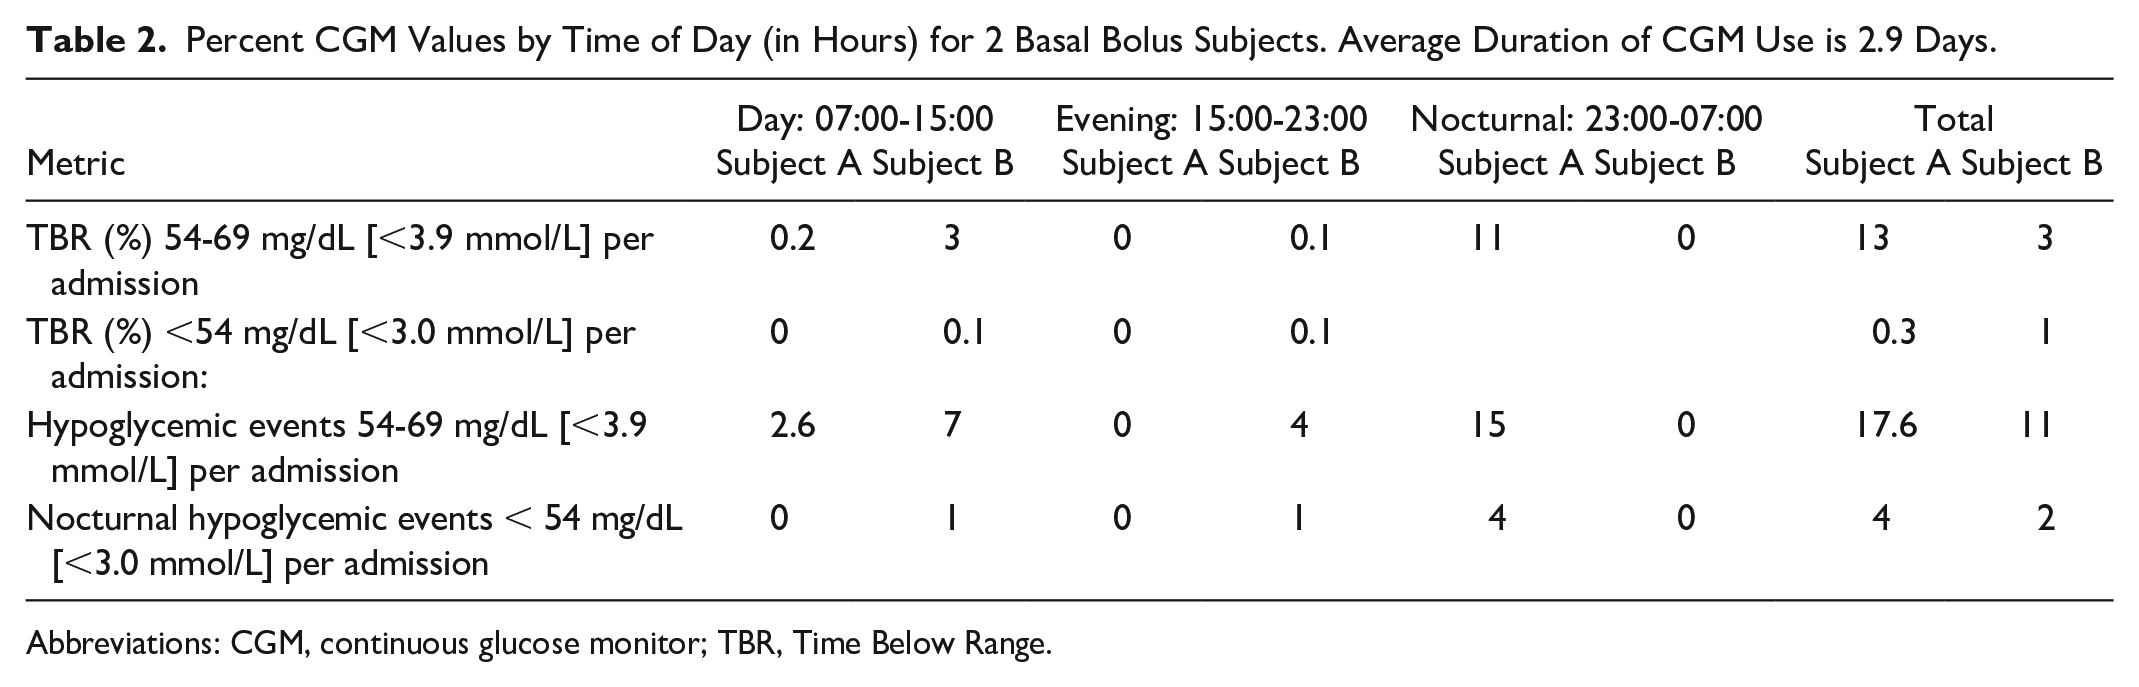
Abbreviations: CGM, continuous glucose monitor; TBR, Time Below Range.
Percent POC BG Values by Time of Day.
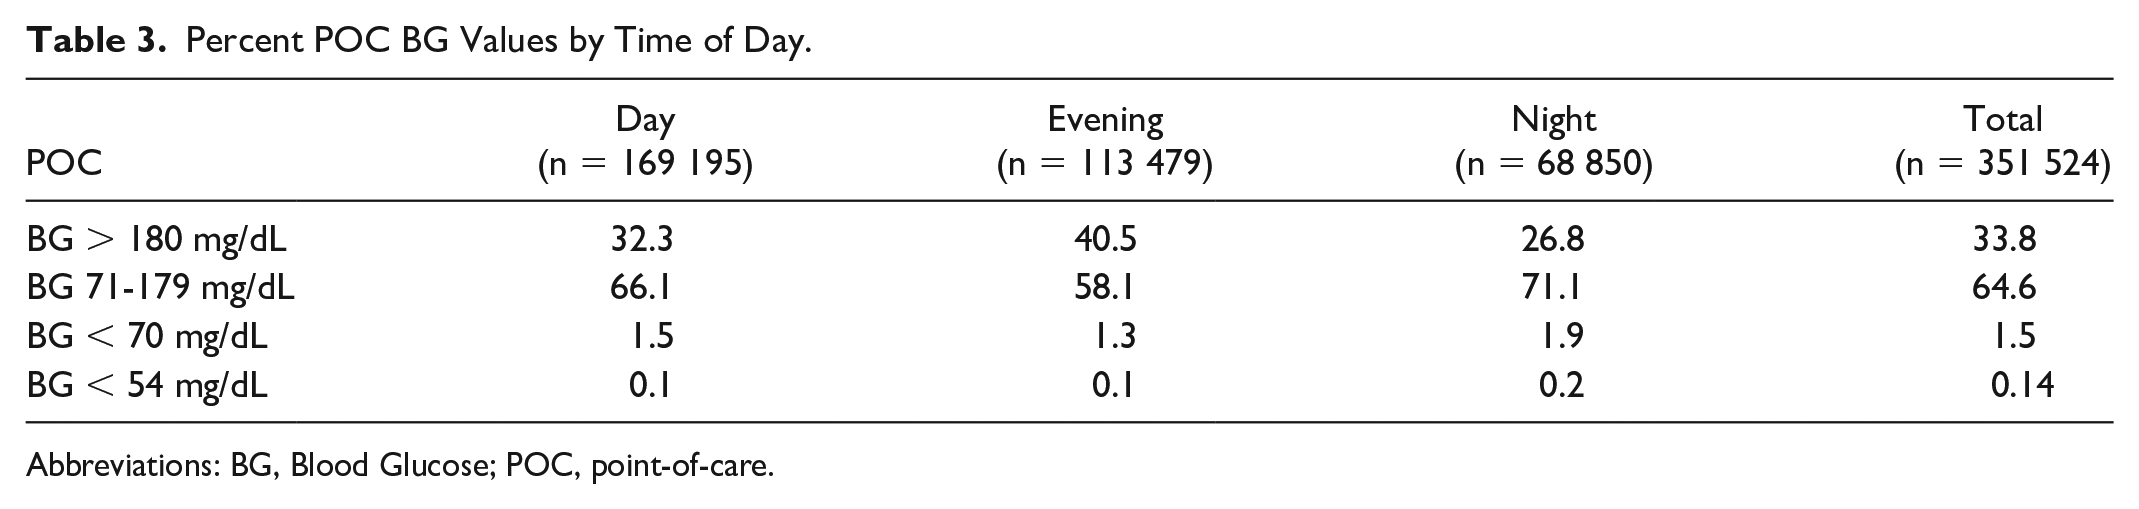
Abbreviations: BG, Blood Glucose; POC, point-of-care.
Recommendations: Time Blocks
Mild Recommendations
Glucose metrics should be reported for time blocks by eight-hour shifts (07:00-15:00 hours, 15:00-23:00 hours, 23:00-07:00 hours{nocturnal}).
Hospital CGM Data Sufficiency
The minimum requirements for CGM values depend upon the intended use, and may vary in terms of timing, frequency, and granularity. Considerations include both gaps in data and delays in availability of data for real-time use as well as for storage in the electronic medical record and/or retrospective review. Causes of delays or gaps in CGM data are presented in Table 4.
Causes of Delays or Gaps in CGM Data.
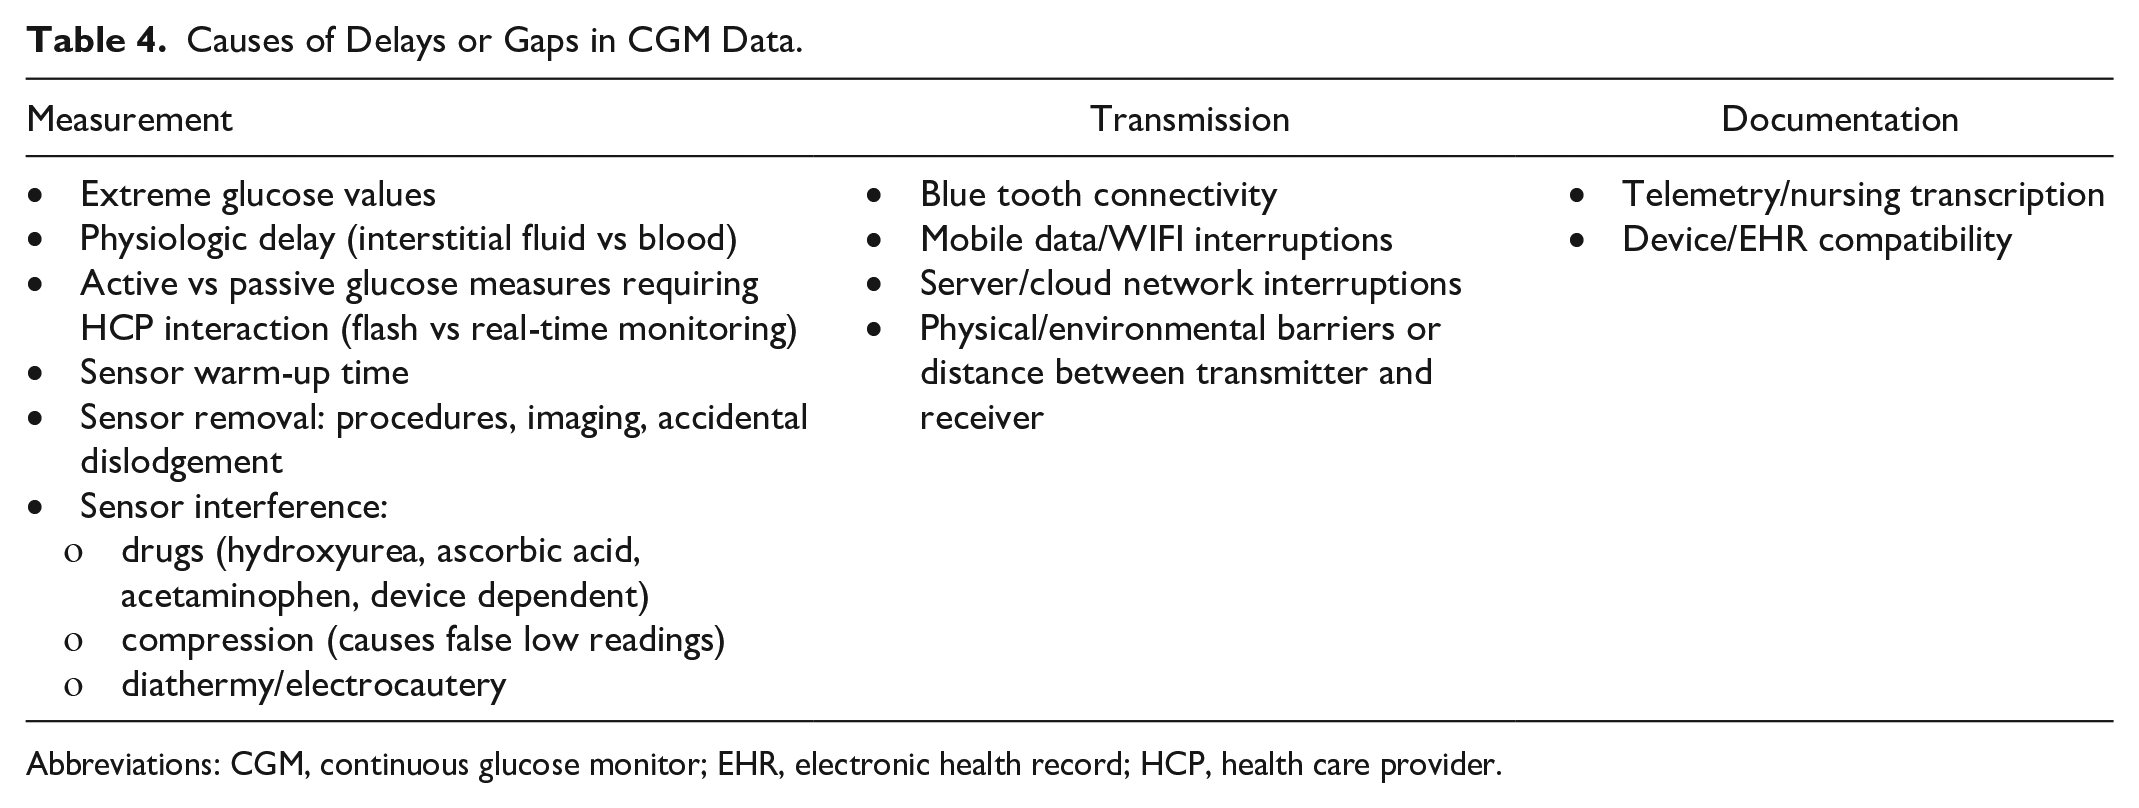
Abbreviations: CGM, continuous glucose monitor; EHR, electronic health record; HCP, health care provider.
Real-time refers to availability of CGM values on a nearly continuous basis (typically every one to five minutes) without the need for interaction with the device. 79 Real-time CGM data should be accessible at the bedside via a receiver or telemetry14,32,33,87 with less than five-minute delay to ensure timely treatment decisions.
Real-Time Use
At the bedside, some situations necessitate real-time access (either by the bedside nurse, or the patient in the case of patient-owned devices) to CGM values. These include the following:
Threshold alerts for hypoglycemia or severe hyperglycemia: real-time alerts ensure timely treatment decisions, in conjunction with established protocols.
Protocols for frequent nonadjunctive use of CGM: For example, CGM may directly inform adjustments of insulin infusions, although this has been limited to research settings13,88-90 or in response to the COVID-19 pandemic.91,92 Protocols typically require periodic POC glucose measures, often at a lesser frequency than otherwise would be performed in clinical practice.
Calibrations (where performed) should be entered within five minutes of obtaining the POC value to avoid introducing sensor error.
Retrospective Use
A core set of data elements consisting of a daily glucose profile graph and summary statistics are sufficient for many uses of CGM where real-time data are not necessary. 79 Core data elements from the iCoDE standards 93 and an adapted core data set for hospital use are shown in Table 5.
Core Data Set for EHR Documentation.
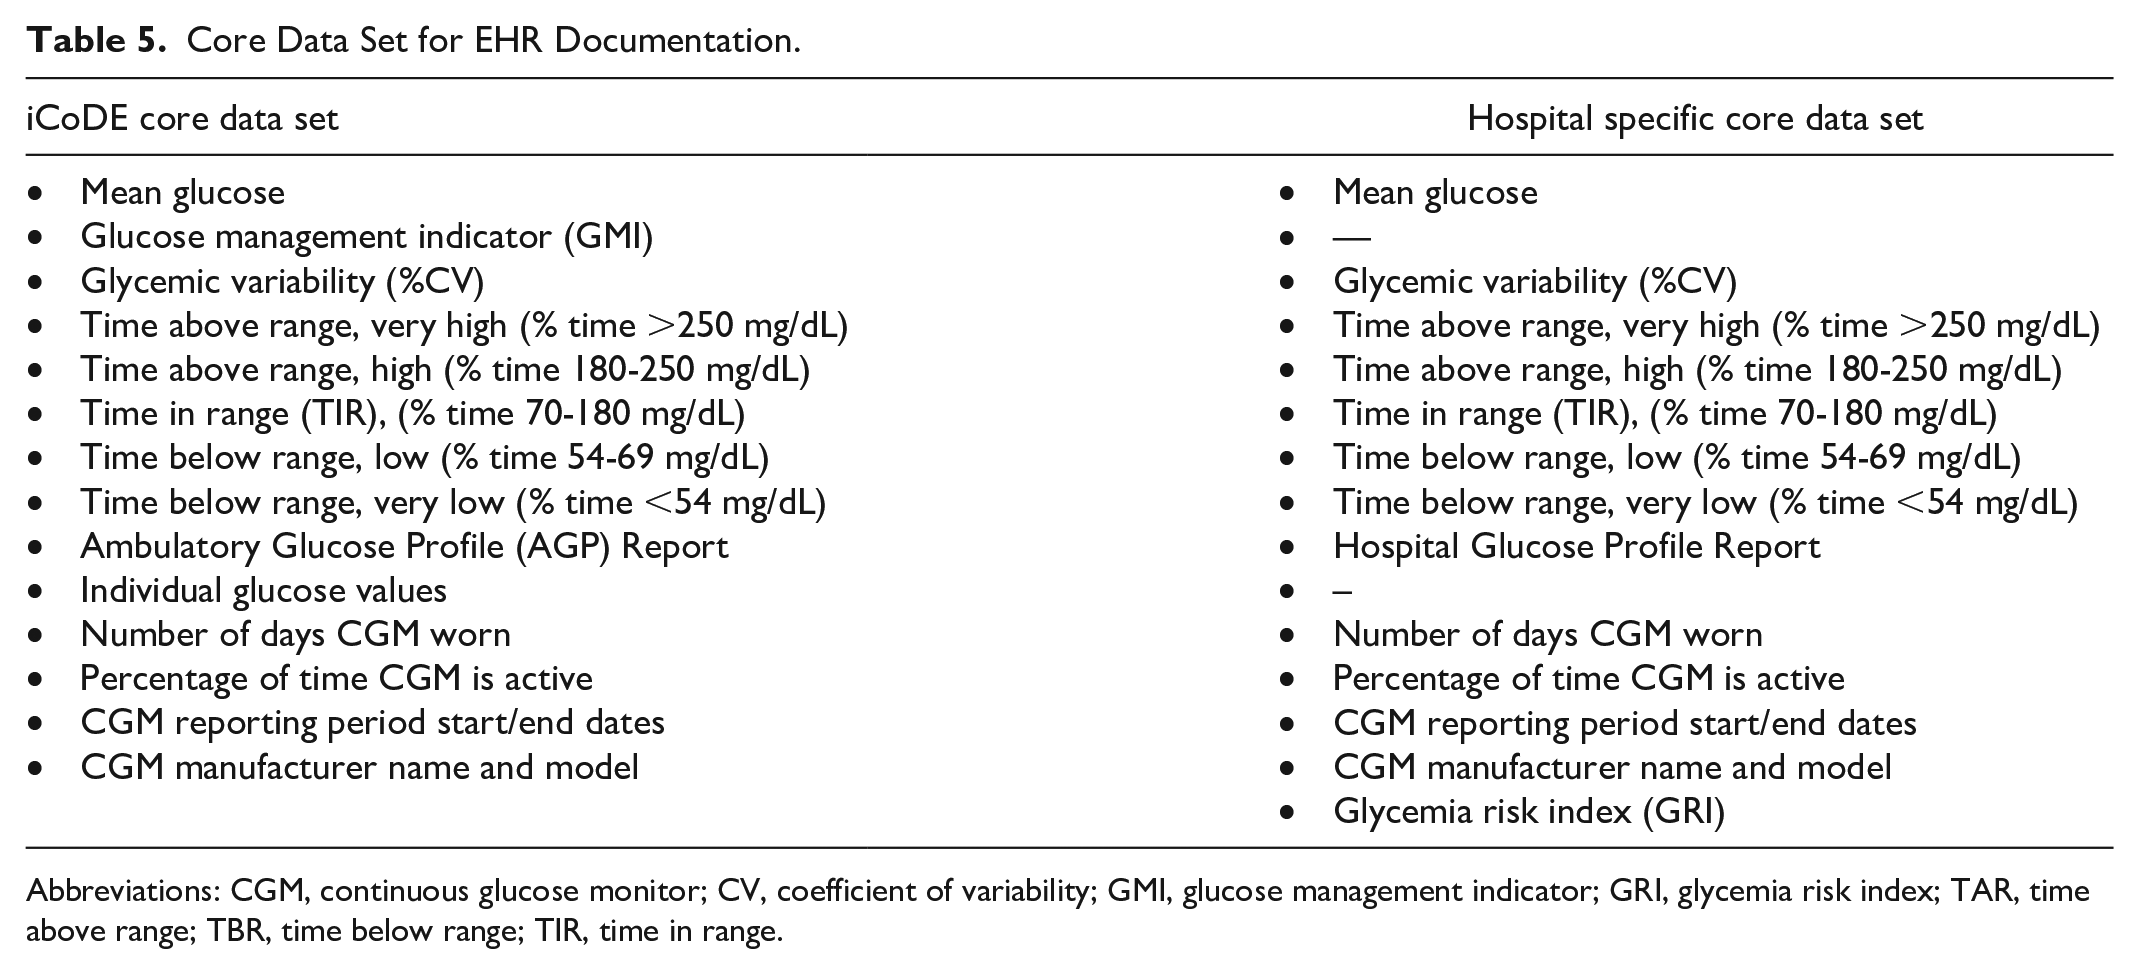
Abbreviations: CGM, continuous glucose monitor; CV, coefficient of variability; GMI, glucose management indicator; GRI, glycemia risk index; TAR, time above range; TBR, time below range; TIR, time in range.
Such reports should be easily accessible (ideally integrated directly or indirectly within the electronic health record [EHR]), standardized and interpretable. 12
Pattern recognition and insulin management: Among patients receiving subcutaneous insulin, CGM data may be viewed at periodic intervals for adjusting insulin orders; 21 short delays in the availability of data do not significantly affect care.
EHR documentation: The need for documenting CGM data more closely resembles that of vital signs as opposed to discrete laboratory values because it is not useful nor feasible to document each individual glucose value. 1 At a minimum, data need to be stored in a HIPAA compliant manner using an approach that distinguishes CGM values from POC or laboratory glucose measures.1,94
Research: Traditionally, 70% or more of the data from a 14-day report is considered acceptable for estimating HbA1c.7,30,31 However, in the hospital setting, duration of use is expected to be much shorter and short-term changes in glucose are common. In an analysis of 291 ambulatory participants with type 1 diabetes, random loss of up to 50% of single CGM values or up to 30% loss of data that includes larger data gaps up to one hour had minimal effect on median % absolute error. However longer gaps in data greater than one hour required greater sampling intervals, particularly in the hypoglycemia and hyperglycemia ranges. 95 Similar findings were reported in another analysis of 100 participants with type 1 diabetes. 96 In general, variables with a non-normal (skewed) distribution such as %TBR and CV will be disproportionately affected by longer gaps in data than those with normal distribution, such as %TIR and mean glucose. There are multiple means of addressing missing data; researchers should pre-specify the methods employed. 97 One recently reported statistical software package removes days with gaps in data of more than 20 minutes and interpolates data in shorter gaps. 98 Additional research is needed to determine the minimum data requirements for assessing hospital-specific glucometrics and outcomes.
Recommendations: CGM Data Sufficiency
Strong Recommendations
Nonadjunctive use of CGM should incorporate real-time access to CGM values and periodic POC glucose values based upon clinical status.
CGM data should be stored in the EHR in a manner that distinguishes CGM values from POC or laboratory values.
A core set of standardized data elements should be utilized for retrospective CGM use.
A plan for addressing missing data should be pre-specified in research protocols.
A minimum of 70% of data per patient day and a minimum of 24 hours in sensor duration should be the thresholds for data analysis.
Using CGM Data for Insulin Dosing
Significance of Using CGM Data for Insulin Dosing in the Hospital
The traditional approach to treat hyperglycemia in the hospital is with multiple daily insulin (MDI) injections for non-critically ill patients and with continuous insulin infusion (CII) for critically ill patients. On hospital floors, blood glucose is commonly monitored four times a day (every six hours for patients NPO or before meals and bedtime for patients on a diet), while in the ICU glucose is tested hourly during CII. 99 There has been increasing interest in using CGM to guide insulin therapy in the hospital setting. With data obtained from CGM (with readings every one to five minutes), hospital staff can visualize trends in real time and receive alarm warning about potentially dangerous hypoglycemia or hyperglycemia. However, it is not clear yet how to act on 288 to 1440 readings in a day either with MDI or with CII.
Previous studies (with Medtronic Real-time CGM or FreeStyle Navigator CGM devices, both of which have been discontinued) used CGM data to guide insulin therapy in the ICU setting with CGM guided adjustments at least every two hours 100 or with a computerized algorithm for insulin dosing. 20 These studies reported non-inferiority in glycemic control using CGM vs POC,20,100 with estimations of potential reductions in nursing workload (17 versus 36 minutes; P < .001) and costs (−12 EUR in favor of CGM use vs not) related to glycemic control. 20 CGM has also been used to detect hypoglycemia when targeting euglycemia in critically ill patients. In trials testing the impact of tight glycemic control on outcomes in pediatric intensive care patients the use of CGM, although not intended for insulin dosing, appears to prevent severe hypoglycemia during CII by sounding alarms based on the rate of glucose change, or to facilitate early treatment reducing the duration of events, particularly when using higher alarm thresholds.101,102
In a recent study, Beardsall et al (2021), used CGM to optimize nutritional (dextrose infusion) and insulin delivery in preterm infants aiming at maintaining glucose levels between 2.6 and 10 mmol/L (46.8-180 mg/dL) vs standard of care. Overall, CGM use reduced exposure to prolonged or severe hyperglycemia and hypoglycemia. 103
During the COVID-19 pandemic, reports have emerged on the use of protocols combining CGM and POC to guide intravenous insulin therapy; however, the safety of this approach needs further investigation. 92 Similarly, studies including patients with COVID-19 in non-ICU settings have focused on the feasibility of remote CGM use to decrease the burden of diabetes care, but there has been limited data on insulin dosing.
What Have We Learned From Recent Clinical Trials Using CGM for Insulin Dosing?
Four recent randomized clinical trials have tested the use of CGM to guide clinical care in non-ICU settings.10,13,14,33 Three studies used relatively similar protocols to adjust insulin and detect or prevent hypoglycemia with alarms,10,13,14 while one clinical trial (patients with COVID-19) allowed for adjustments based on usual practice in both treatment arms. 33 See Table 6 for a description of protocols used in these 4 clinical trials.
Protocols Used for Insulin Therapy Strategies in Four Randomized Clinical Trials Using CGM Data to Care for Non-ICU Hospitalized Patients.
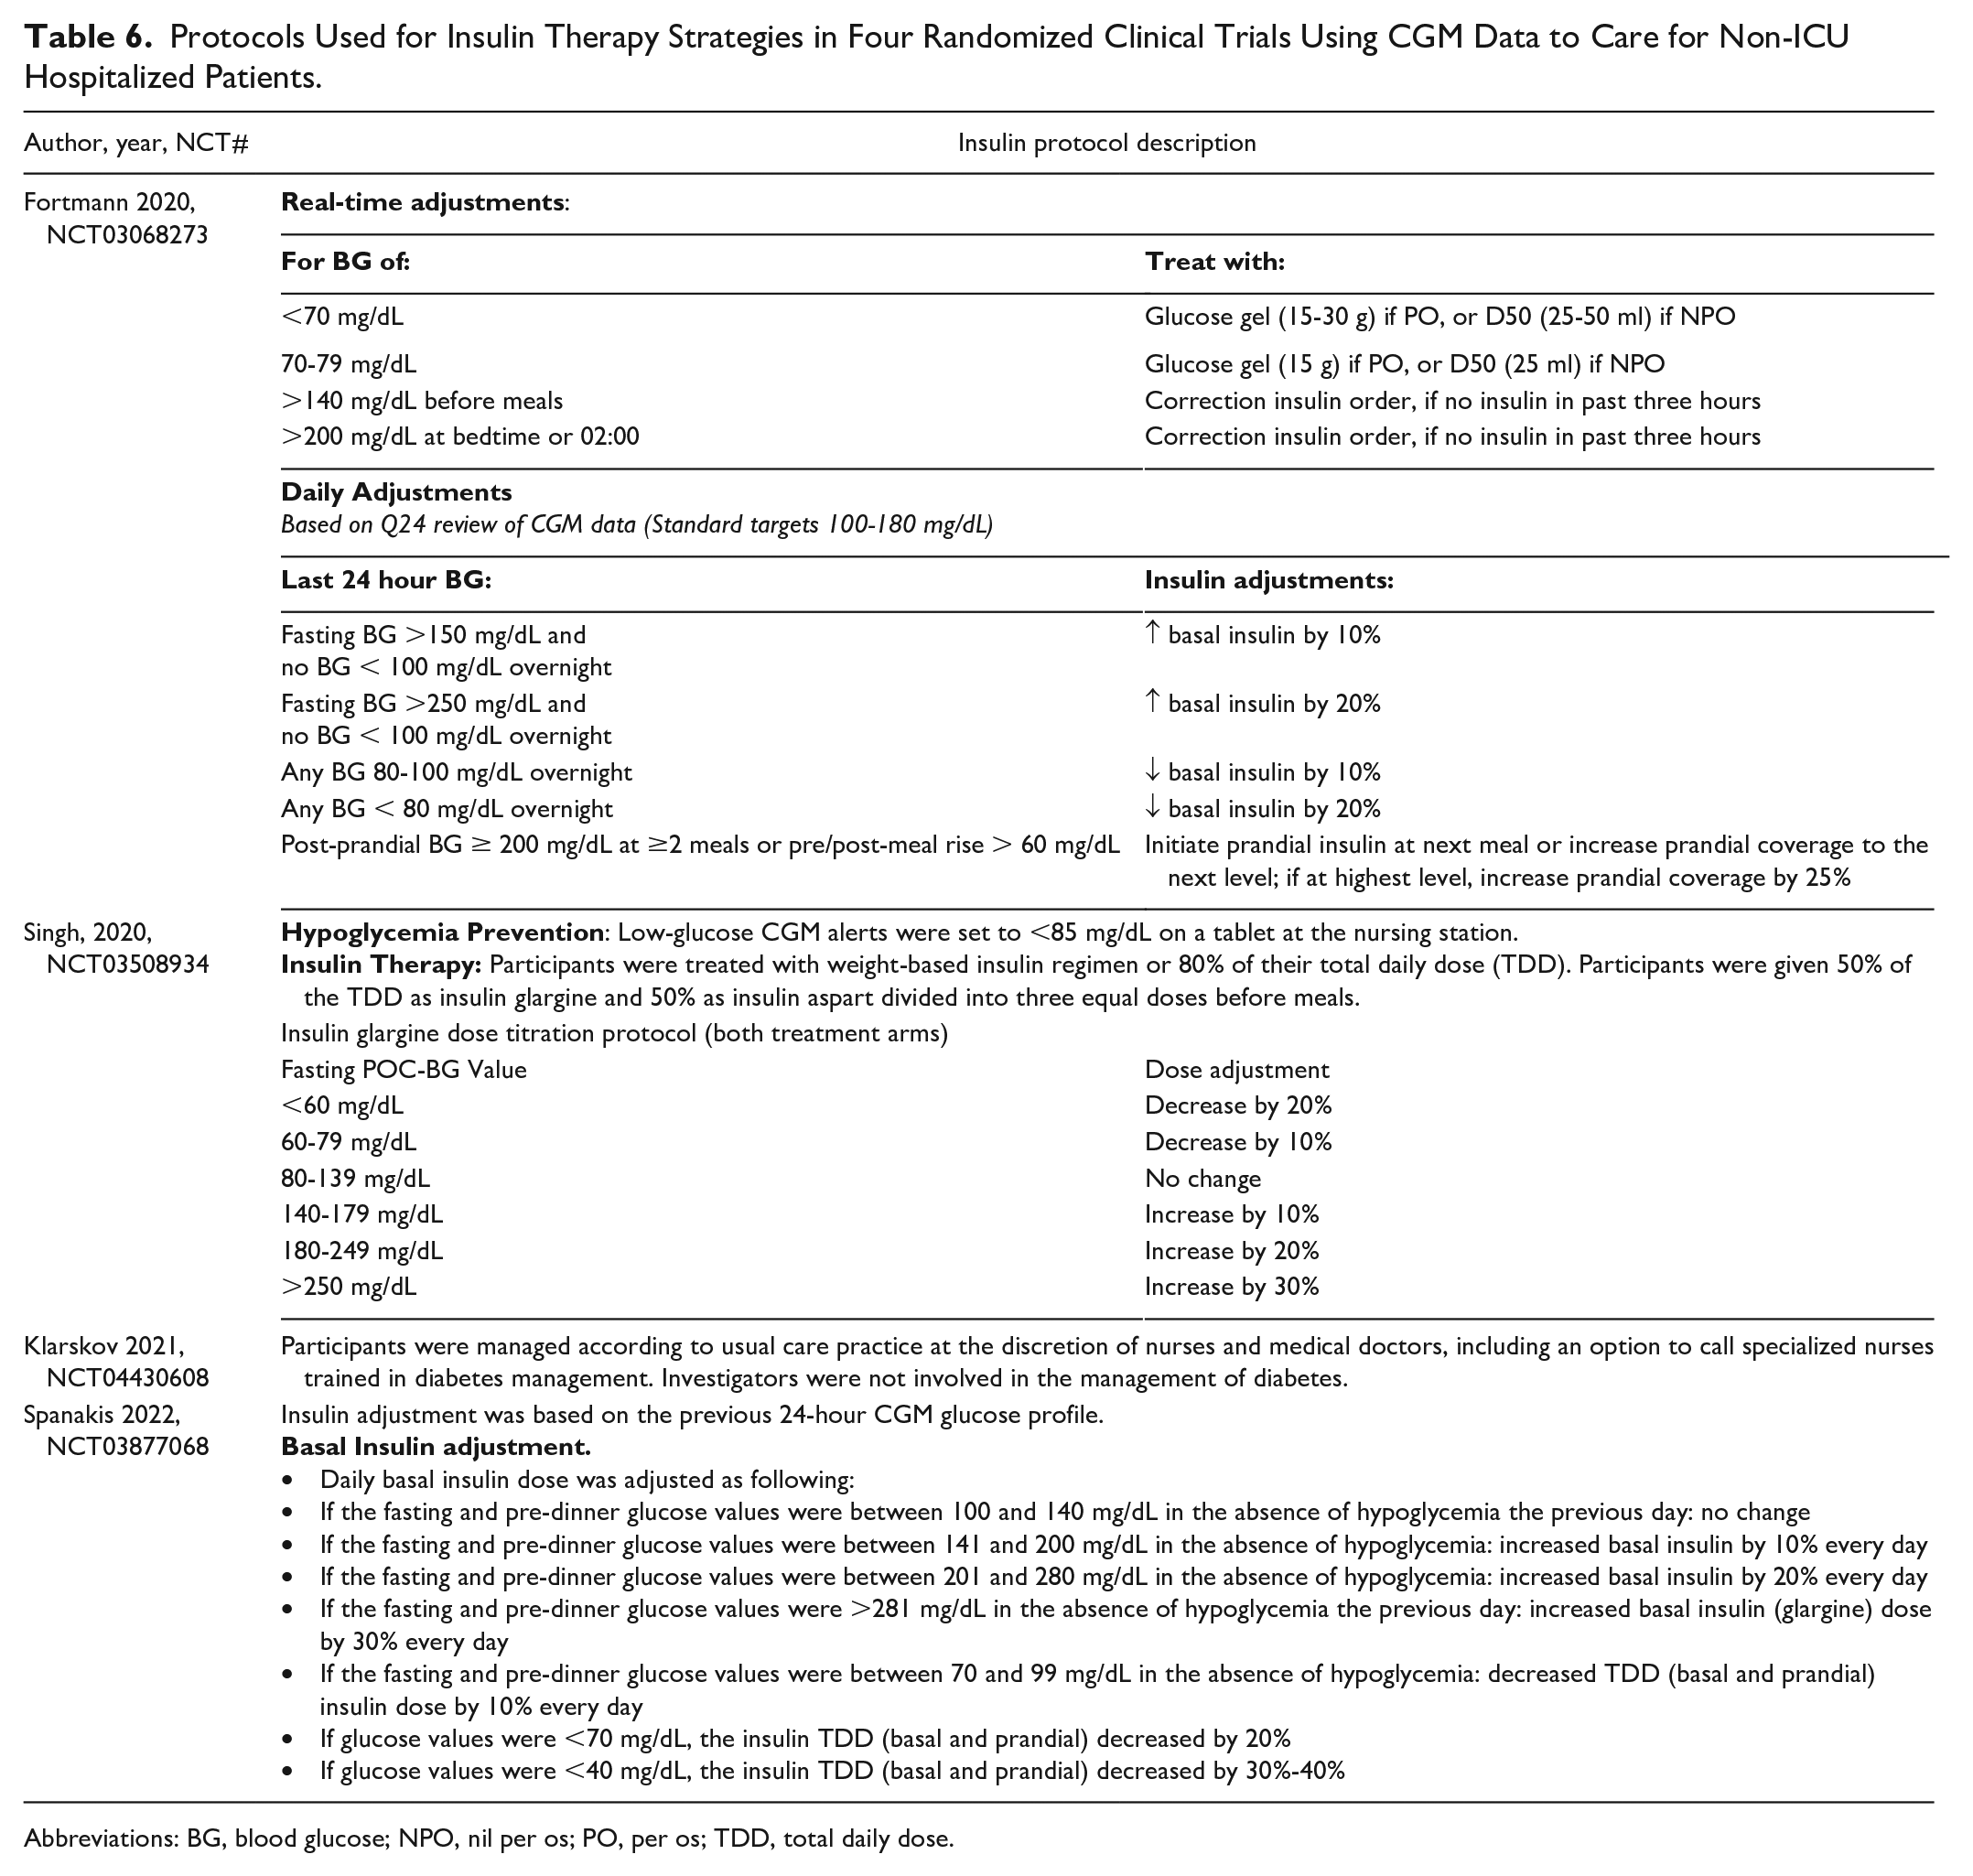
Abbreviations: BG, blood glucose; NPO, nil per os; PO, per os; TDD, total daily dose.
The impact of using CGM for treatment decisions thus far has been modest on overall glycemic control based on recent clinical trials.13,14,33 Two RCTs were suspended because of COVID-19 and were analyzed early but provided some insight about the performance of CGM in the hospital.10,14 In patients with high risk for hypoglycemia the use of remote CGM with a specific protocol may reduce the number of hypoglycemic events.10,13 In a larger trial, Spanakis et al, used a similar protocol to reduce the incidence of hypoglycemia with CGM in a more heterogenous population (including patients with low and high risk for hypoglycemia). In this trial, although a 40% to 60% non-statistical reduction in different metrics of hypoglycemia was observed, however, statistically significant reduction of hypoglycemia (observed previously in a study enrolling only high-risk patients) 10 was observed only among patients that experienced one or more hypoglycemic events. 13 Table 7 summarizes results and limitations of recently published clinical trials using CGM data to guide insulin therapy in non-ICU hospitalized patients.
Glycemic Endpoints in Randomized Clinical Trials Using CGM Data to Guide Insulin Therapy in Non-ICU Hospitalized Patients.
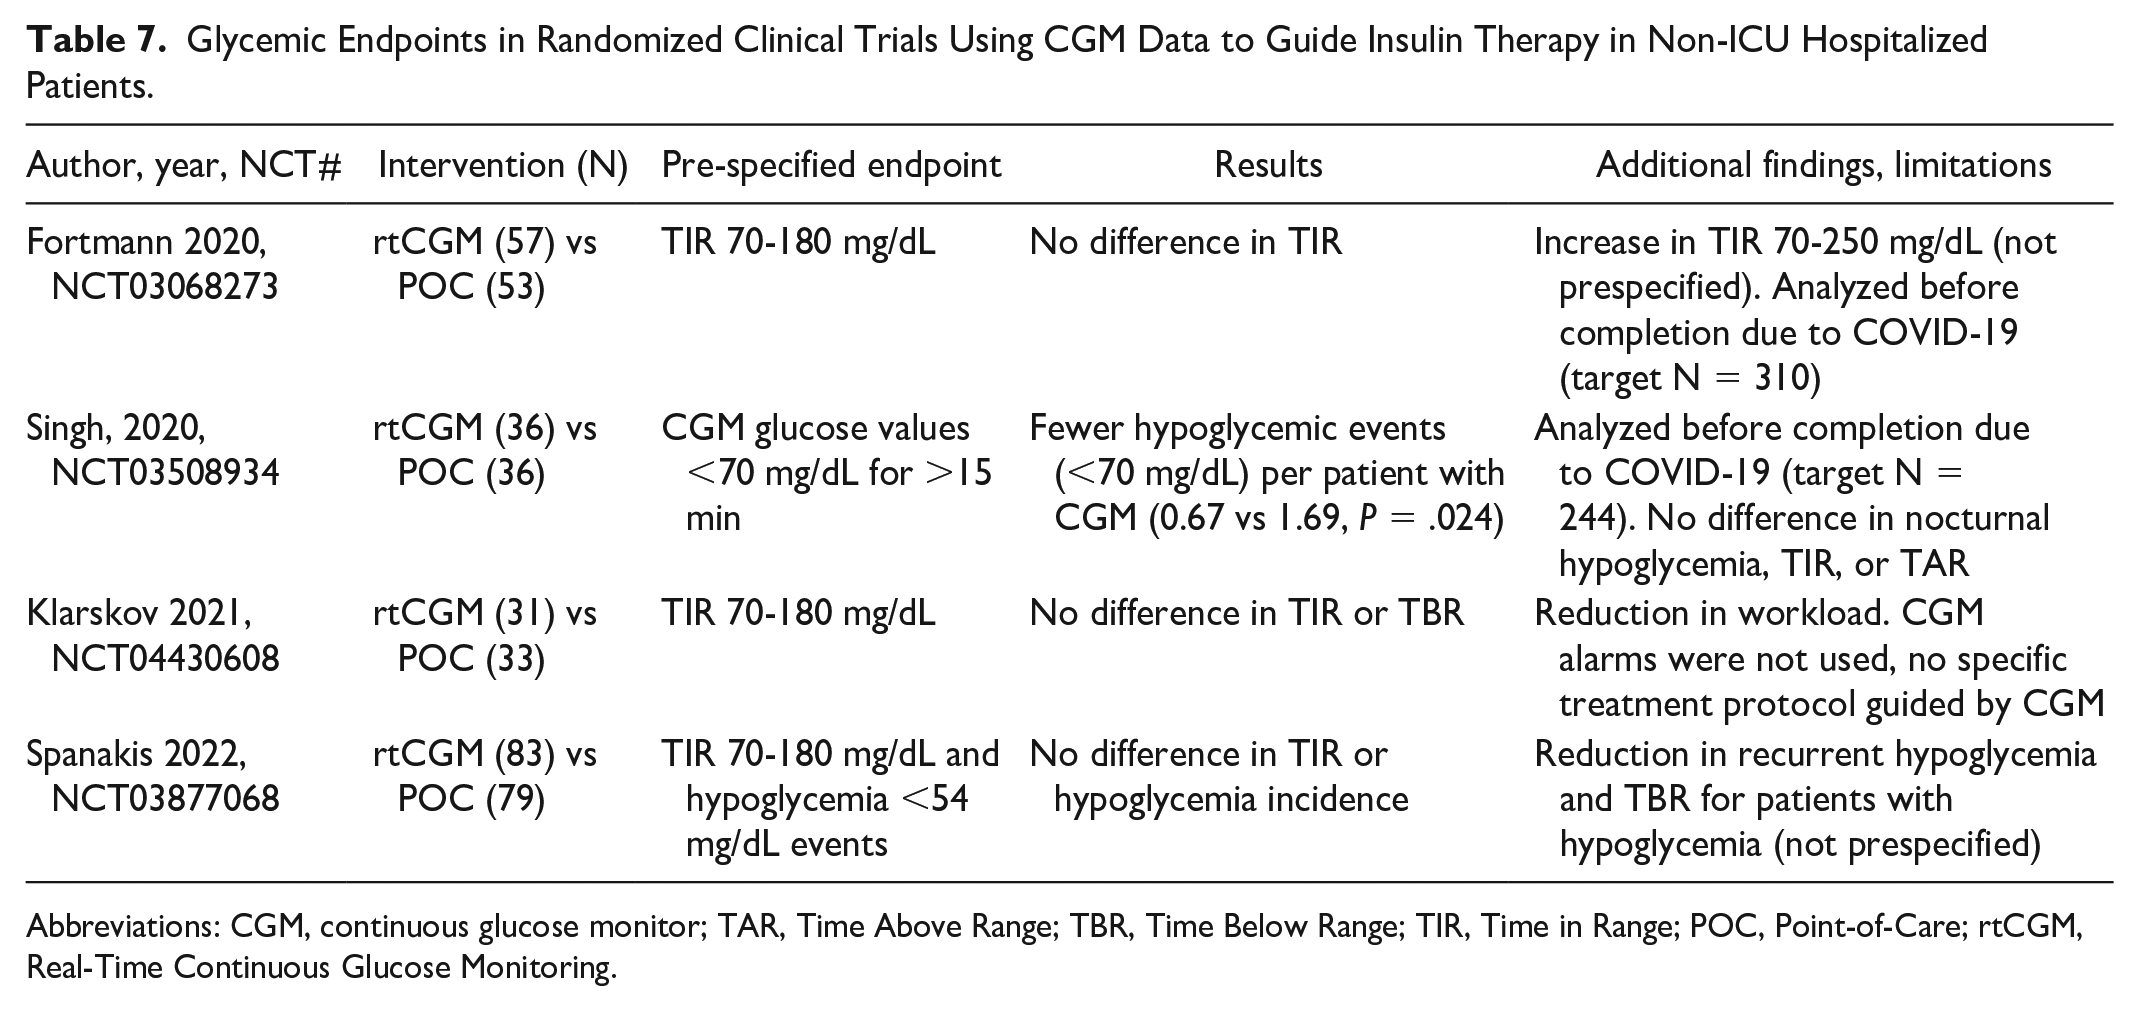
Abbreviations: CGM, continuous glucose monitor; TAR, Time Above Range; TBR, Time Below Range; TIR, Time in Range; POC, Point-of-Care; rtCGM, Real-Time Continuous Glucose Monitoring.
Additional clinical trials are underway to further understand the role of insulin dosing guided by CGM. The Time in Glucose Hospital Target (TIGHT, NCT05135676, target N = 150) and the Cloud-Based Real-Time Glucose Evaluation and Management System (Cyber GEMS, NCT05307237, target N = 554) trials are actively recruiting participants and will provide additional insight into the use of CGM to adjust insulin therapy. TIGHT is currently targeting a lower glucose range with remote CGM monitoring to guide daily therapy but allowing an active intervention based on alarms and trends, while Cyber GEMS is focused on developing a more optimal remote platform for inpatient care including a digital dashboard and a centralized monitoring system. 99
Recommendations: CGMs for Insulin Dosing
Strong Recommendations
The use of CGM technology to visualize sensor glucose values without an intervention protocol to act on CGM data may lead to clinical inertia and is discouraged.
Remote monitoring along with a protocol to respond to CGM alarms may be used to reduce the incidence of hypoglycemia in high-risk patients.
Additional research is needed to optimize strategies on the use of CGM (including the use of trends and arrows) to guide insulin adjustment
The use of hybrid protocols (CGM with periodic POC testing to confirm accuracy) may facilitate the safe use of CGM for insulin adjustment and needs further investigation
Future Directions
The Use of CGM in the Hospital
A current limitation of CGM use in the hospital to guide insulin dosing is the limited knowledge of the frequency and risks of potential interferences (known and unknown) that may alter CGM readings leading to potentially wrong clinical decisions. To address accuracy issues a hybrid approach has been recently recommended.68,92,104 This includes the use of intermittent non-adjunctive CGM along with periodic POC testing to confirm accuracy with validation protocols.91,105 While we wait for regulatory approval of CGM devices for inpatient use, a hybrid approach appears to have gained acceptance by investigators. Active FDA regulated RCTs are using this approach (NCT04714216, NCT05644730, NCT05135676, NCT05571397)
Automated insulin delivery (AID) is also possible in the hospital (where insulin adjustments by providers are more focused on adjusting device settings to initiate an algorithm as opposed to daily adjustments). Several clinical trials with a single European system have shown consistent improvement in glycemic control with AID guided by CGM data.88-90 Even though glycemic control may be easier to achieve with an AID system, several cost and implementation barriers still remain and warrant further investigation. 99
How Should CGM be Used to Guide Insulin Therapy in the Hospital?
Recent RCT data show hypoglycemic events can be prevented with CGM in high-risk patients.10,13 By matching the timing of insulin therapy with glucose trends and hypoglycemic events, providers can often determine if over treatment is occurring to guide the adjustment of basal insulin, prandial insulin (including insulin correction scales), or both. This should also be discussed with the patient (if he/she is able to communicate) and nursing staff to determine the patients’ current nutrition/appetite status or need for potential procedures, which can further help determine insulin adjustments.
The lack of clinical protocols also appears to lead to clinical inertia particularly when providers have the option to visualize CGM data but lack a specific protocol to take action. 33 While we wait for regulatory approval of current generations of CGM devices, using hybrid protocols with intermittent non-adjunctive CGM along with periodic testing to confirm CGM device accuracy (for now every four to six hours for non-ICU and ICU settings) may be a reasonable approach. More research is needed, particularly in the non-ICU setting, to also determine if more active adjustment of insulin (real-time adjustments as opposed to daily adjustment) can help improve glycemic control.
Recommendations: Miscellaneous
Miscellaneous Strong Recommendations
Wherever possible, studies should provide detailed description of the participant population and clinical environment.
Patient information should include the setting for CGM use (ie, ICU versus non-ICU).
Patient information should include whether the indication(s) for CGM was based on use of glucose lowering therapies or other reasons (eg, risk of hypoglycemia dues to severe organ failure).
Staff competencies and available resources should be key issues in inpatient CGM research protocols. Studies should delineate the role of each team member and should consider including other members of the team.
Patient reported outcomes may be reported using validated surveys.
Threshold alerts for hypoglycemia or hyperglycemia should be available to the patient or nurse (directly or via telemetry unit) in real-time.
Miscellaneous Mild Recommendations
Patient information should include the reason for hospital admission (ie, elective versus non-elective).
Conclusion
Through a consensus process, an expert panel voted on 51 recommendations regarding CGM metrics for inpatient clinical trials. About 51 of them were classified as either strong (43) or mild (8) and none of the recommendations failed to reach consensus (Table 8). The panel’s recommendations are intended to support future research in the use of CGMs in the hospital setting by standardizing definitions of outcomes and other metrics. The panelists hope that this project will lead to greater usefulness of research and greater ease of comparability between studies of CGM performance in a hospital setting.
List of 51 Recommendations by the CGM Recommendation Panelists.
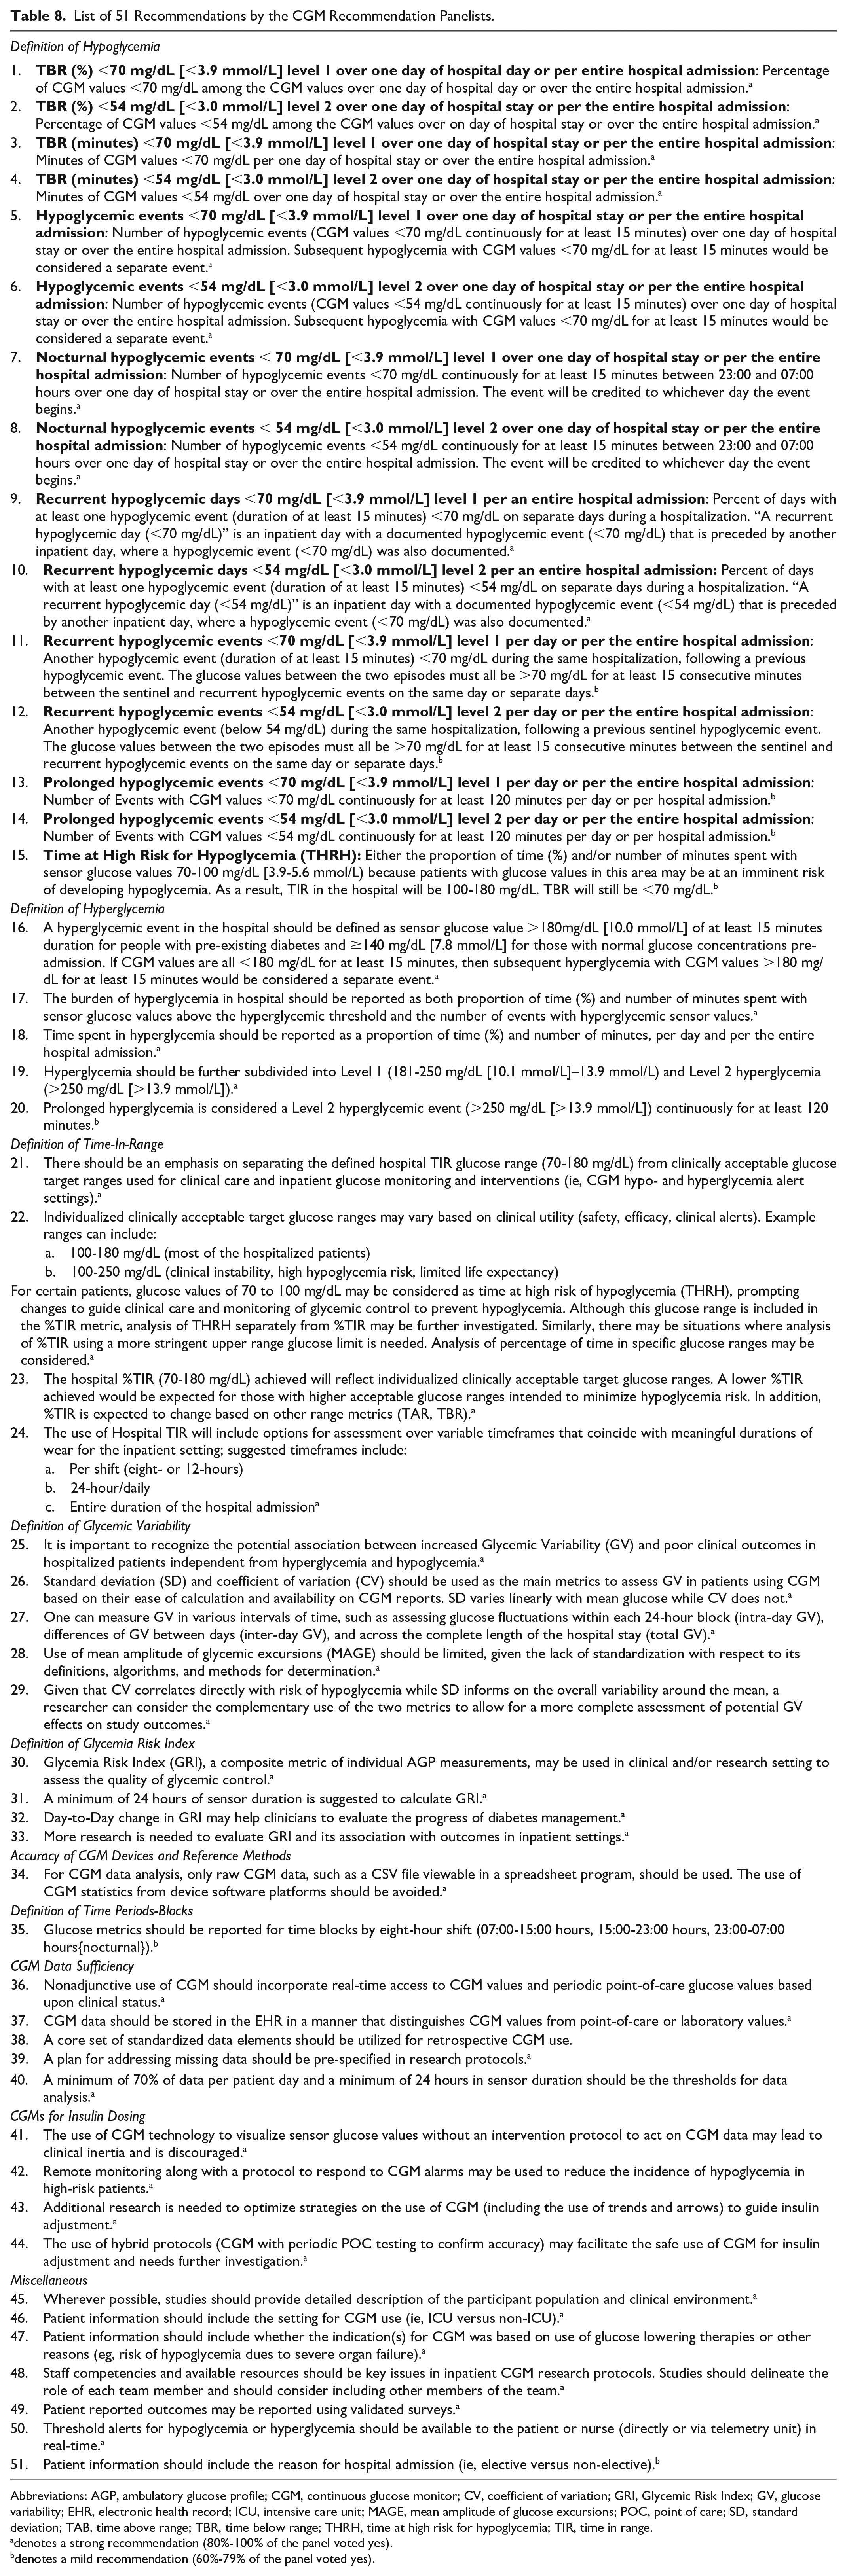
Abbreviations: AGP, ambulatory glucose profile; CGM, continuous glucose monitor; CV, coefficient of variation; GRI, Glycemic Risk Index; GV, glucose variability; EHR, electronic health record; ICU, intensive care unit; MAGE, mean amplitude of glucose excursions; POC, point of care; SD, standard deviation; TAB, time above range; TBR, time below range; THRH, time at high risk for hypoglycemia; TIR, time in range.
denotes a strong recommendation (80%-100% of the panel voted yes).
denotes a mild recommendation (60%-79% of the panel voted yes).
Footnotes
Acknowledgements
The authors thank Annamarie Sucher-Jones for her expert editorial assistance.
Abbreviations
AACE, American Association of Clinical Endocrinologists; ADA, American Diabetes Association; AGP, ambulatory glucose profile; BG, blood glucose; CEG, Clark Error Grid; CGM, continuous glucose monitor; CV, coefficient of variation; eGFR, estimated glomerular filtration rate; EHR, electronic health record; FDA, U.S. Food and Drug Administration; GMI, glucose management indicator, GRI, glycemic risk index; GV, glucose variability; HbA1c, hemoglobin A1c; HCP, health care provider; iCGM, integrated continuous glucose monitor, ICU, intensive care unit; MAGE, mean amplitude of glucose excursions; MARD, mean absolute relative difference; MICU, medical intensive care unit; NPO, nil per os; PO, per os; POC, point of care; POC BG, point-of-care capillary blood glucose; rtCGM, real-time continuous glucose monitoring; SD, standard deviation; T1D, type 1 diabetes; T2D, type 2 diabetes; TAR, time above range; TBR, time below range; TDD, total daily dose; THRH, time at high risk for hypoglycemia; TIR, time in range
Declaration of Conflicting Interests
The author(s) declared the following potential conflicts of interest with respect to the research, authorship, and/or publication of this article: EKS was partially supported by the VA MERIT award (#1I01CX001825) and CSP #2002 from the United States (U.S.) Department of Veterans Affairs. EKS has received unrestricted research support from Dexcom, MannKind Cooperation and Tandem (to Baltimore VA Medical Center and to University of Maryland) for the conduction of clinical trials. EKS has received fees from the Medscape and the Endocrine Society (ESAP). JAA receives research funding from Abbott Diabetes. LB has product and research support for investigator-initiated studies from Dexcom and Ypsomed in addition to speaker honoraria from Dexcom and Ypsomed. GD has received research support from Insulet and has consulted for Medscape. KMD received research support from Abbott, Dexcom, Sanofi, Viacyte, and Insulet, consulting fees from Dexcom, Eli Lilly, advisory board fees from Elsevier, and honoraria from UpToDate, Medscape, Academy for Continued Healthcare Learning, Med Learning Group, Cardiometabolic Health Congress. FJP has received research support: Dexcom, Insulet, Tandem, Ideal Medical technologies, Novo Nordisk and consults for Dexcom. FJP has received research support: Dexcom, Insulet, Tandem, Ideal Medical technologies, Novo Nordisk and consulting fees from Dexcom. GEU is partly supported by research grants from National Institutes of Health (NIH/NATS UL 3UL1TR002378-05S2) from the Clinical and Translational Science Award program, and from National Institutes of Health and National Center for Research Resources (NIH/NIDDK 2P30DK111024-06). GEU has received research support (to Emory University) from Abbott, Bayer, Dexcom and Sanofi. DCK is a consultant for Better Therapeutics, EOflow, Integrity, Lifecare, Nevro, Novo, Sanofi, and Thirdwayv. The remaining authors have no disclosures.
Funding
The author(s) disclosed receipt of the following financial support for the research, authorship, and/or publication of this article: This work was supported by a grant from Diabetes Technology Society, which received no external funding.