
Abstract
Background:
A noninvasive, wearable continuous glucose monitor would be a major advancement in diabetes therapy. This trial investigated a novel noninvasive glucose monitor which analyzes spectral variations in radio frequency/microwave signals reflected from the wrist.
Methods:
A single-arm, open-label, experimental study compared glucose values from a prototype investigational device with laboratory glucose measurements from venous blood samples (Super GL Glucose Analyzer, Dr. Müller Gerätebau GmbH) at varying levels of glycemia. The study included 29 male participants with type 1 diabetes (age range = 19-56 years). The study comprised three stages with the following aims: (1) demonstrate initial proof-of-principle, (2) test an improved device design, and (3) test performance on two consecutive days without device recalibration. The co-primary endpoints in all trial stages were median and mean absolute relative difference (ARD) calculated across all data points.
Results:
In stage 1, the median and mean ARDs were 30% and 46%, respectively. Stage 2 produced marked performance improvements with a median and mean ARD of 22% and 28%, respectively. Stage 3 showed that, without recalibration, the device performed as well as the initial prototype (stage 1) with a median and mean ARD of 35% and 44%, respectively.
Conclusion:
This proof-of-concept study shows that a novel noninvasive continuous glucose monitor was capable of detecting glucose levels. Furthermore, the ARD results are comparable to first models of commercially available minimally invasive products without the need to insert a needle. The prototype has been further developed and is being tested in subsequent studies.
Trial registration number:
NCT05023798.
Keywords
Introduction
Self-monitoring of blood glucose by people with diabetes identifies hypoglycemic and hyperglycemic episodes and informs diabetes management. 1 Traditional glucose testing requires finger pricks, which are associated with pain and inconvenience. 2 Continuous glucose monitors (CGMs) are a technological advancement that measure glucose automatically and frequently in the interstitial fluid using minimally invasive methods. 3 Spot measurements with CGM technology are less accurate than with capillary blood glucose meters, but the availability of continuous data can lead to better clinical outcomes, especially in people with type 1 diabetes. 1 Accuracy of CGM has improved over recent years with mean absolute relative differences (ARDs) now typically below 10%.4 -8
However, minimally invasive CGMs have disadvantages, such as the need to insert a needle into the skin which can cause irritation, 9 environmental concerns over plastic waste from CGM applicators, 10 and a potential time lag between glucose levels in the interstitial fluid compared with the blood, particularly during exercise.11,12 Therefore, an ideal CGM would be noninvasive, wearable, produce instantaneous measurements, and have no disposable elements. While numerous innovations are being considered for noninvasive glucose monitoring, success has been very limited and interest in developing a wearable, noninvasive CGM remains high. 13
Microwave technology holds promise for developing such a device. A controlled study (30 blood samples; ten human participants) demonstrated that the glucose concentration in whole blood could be observed through resonance shifts in the microwave spectrum (Chaudhry, Royal Liverpool Hospital, unpublished data, 2013). Other studies showed that a characterization of a micro-resonator split ring system could determine blood glucose levels in vitro and in vivo, 14 a characterization of a micro-resonator based on an enhanced metal insulator semiconductor capacitor facilitated glucose detection in vitro, 15 and a resonator-based microwave biosensor could measure glucose in vitro. 16
Despite this promise, microwave technology has so far not achieved good measurement performance. Indeed, a literature review of radio-frequency biosensors for real-time and continuous glucose detection concluded that commercial radio-frequency biosensors with robust performance had not been developed. 17 It attributed this to issues such as the need to improve the unfavorable signal-to-noise ratio, as well as optimal frequency, integrated radio-frequency devices and circuits, and discrimination between glucose and other biological components. 17
Based on these observations, we developed a wrist-worn prototype dial resonating sensor (DRS) to detect glucose levels noninvasively. The DRS uses a microwave sensor to measure spectra, which are then converted to a glucose value by an algorithm. Following in vivo and in vitro testing of the DRS prototype, a proof-of-concept study was conducted, 18 which is described in this article. The objectives were to determine the glucose detection accuracy of the DRS compared with a laboratory-standard device (primary) and as an alert device for high or low glucose levels (secondary).
Methods
Ethics Statement
The study followed the Declaration of Helsinki, ICH-GCP, and ISO 14155. It was approved by Ethik-Kommission der Ärtzekammer Nordrhein on September 14, 2018 (6000209202) and was granted exemption for approval by BfArM on October 4, 2018 (94.1.04-5660-11591). All participants provided written informed consent.
Study Design
A proof-of-concept, open-label, single-arm, single-site (Profil, Neuss, Germany), experimental study compared glucose values from the DRS with a laboratory-standard measurement device (Super GL Glucose Analyzer, Dr. Müller Gerätebau GmbH, Freital, Germany). Participants were screened one to seven days before inclusion and then attended the trial center for two test days (less than or equal to seven days apart). No major changes were made to the protocol during the study.
The study comprised three stages. A Data Monitoring Committee reviewed the data after each stage to determine whether any device or study design improvements were required before re-testing with the next cohort of participants.
Stage 1 (October 2018-November 2018) aimed to establish initial proof of concept, that is, that the DRS prototype could identify glucose in a totally noninvasive manner compared with the laboratory standard. Stage 2 (September 2019-October 2019) repeated stage 1 after design improvements to the DRS construction (described in Intervention section). Stage 3 (June 2020-August 2020) evaluated whether the model (described in Intervention section) built using data from one day of wear could compute glucose levels on the second day without needing device recalibration when testing occurred on two consecutive days. The device design from stage 2 was used in stage 3. In addition, some volunteers participated in stages 2 and 3 so the durability of the models built during stage 2 to detect glucose levels in stage 3, that is, after a delay of ten months, could be tested.
Participants
Participants were recruited from the volunteer panel of Profil. The main inclusion criteria were men/women with type 1 or 2 diabetes (WHO [World Health Organization] definition) for at least one year, aged 18 to 64 years inclusive, and body mass index (BMI) of 18.5 to 35 kg/m2 inclusive. However, only males with type 1 diabetes volunteered to join. The main exclusion criteria were current participation in another clinical study, allergy to materials, current pregnancy/lactation, or any injury or infection of the wrist.
Intervention
The DRS prototype comprised a planar ring design (split copper ring) printed on one side of a microwave substrate board, with a full copper layer and feed connector on the other side of the board (Figure 1, left). 19 The DRS was connected to a vector network analyzer (VNA) via one or more coaxial cables which operated reflectively, that is, the signal was continually transmitted and detected on the same port (Figure 2). The DRS ring was excited by the VNA. At resonance, the split ring produced a strong electric field which is sensitive to nearby media.
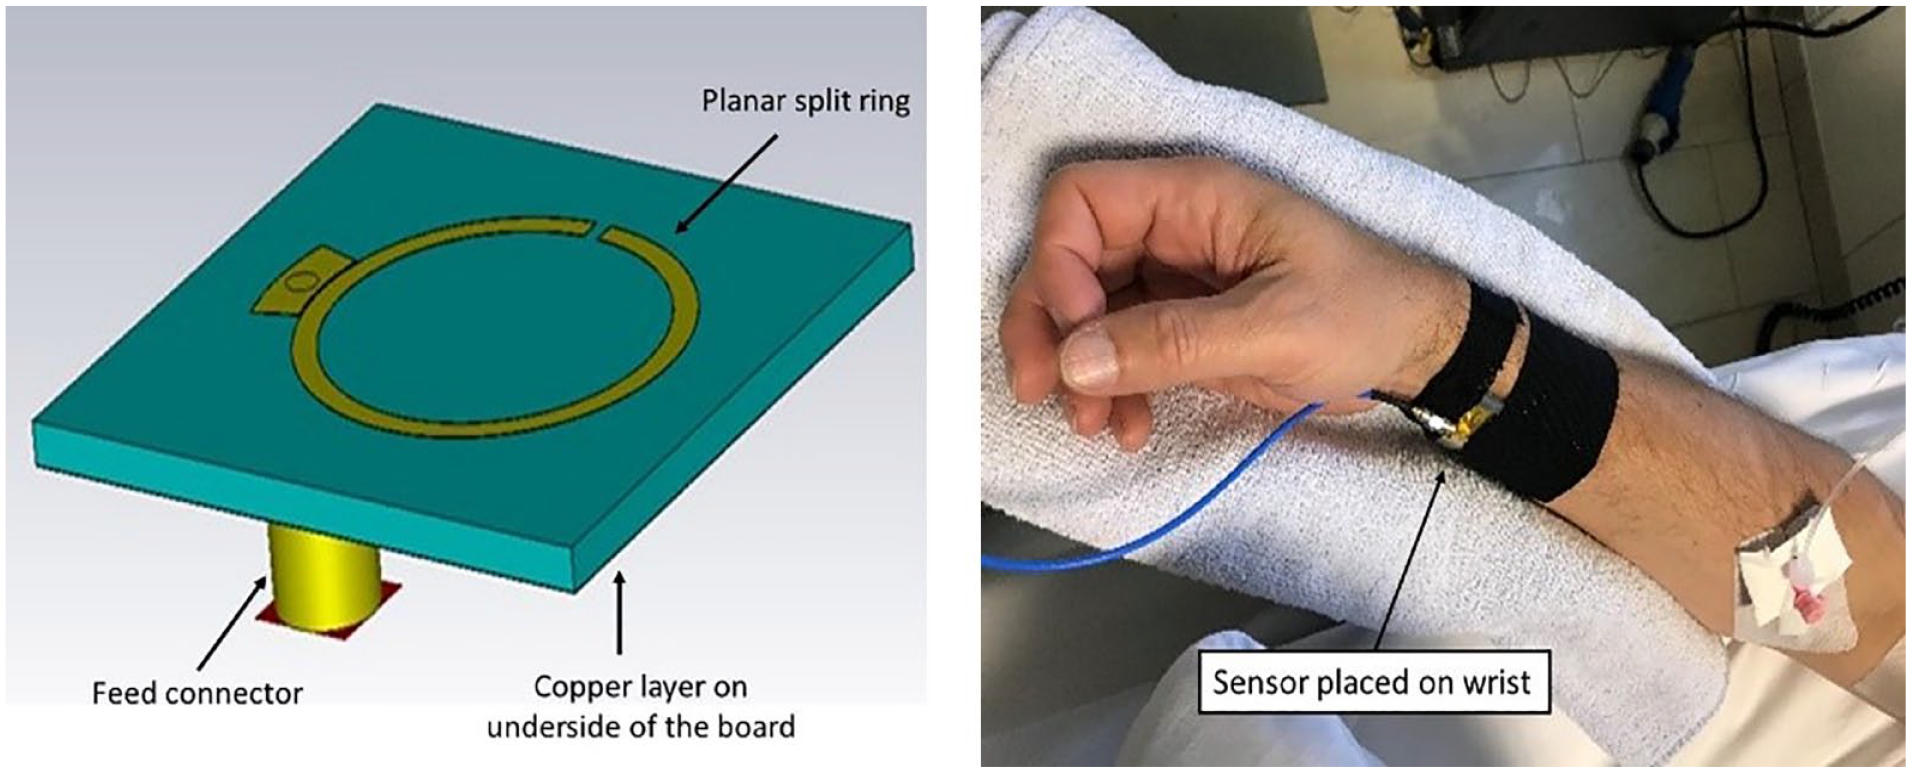
Sensor bare form (left) and applied to wrist (right).
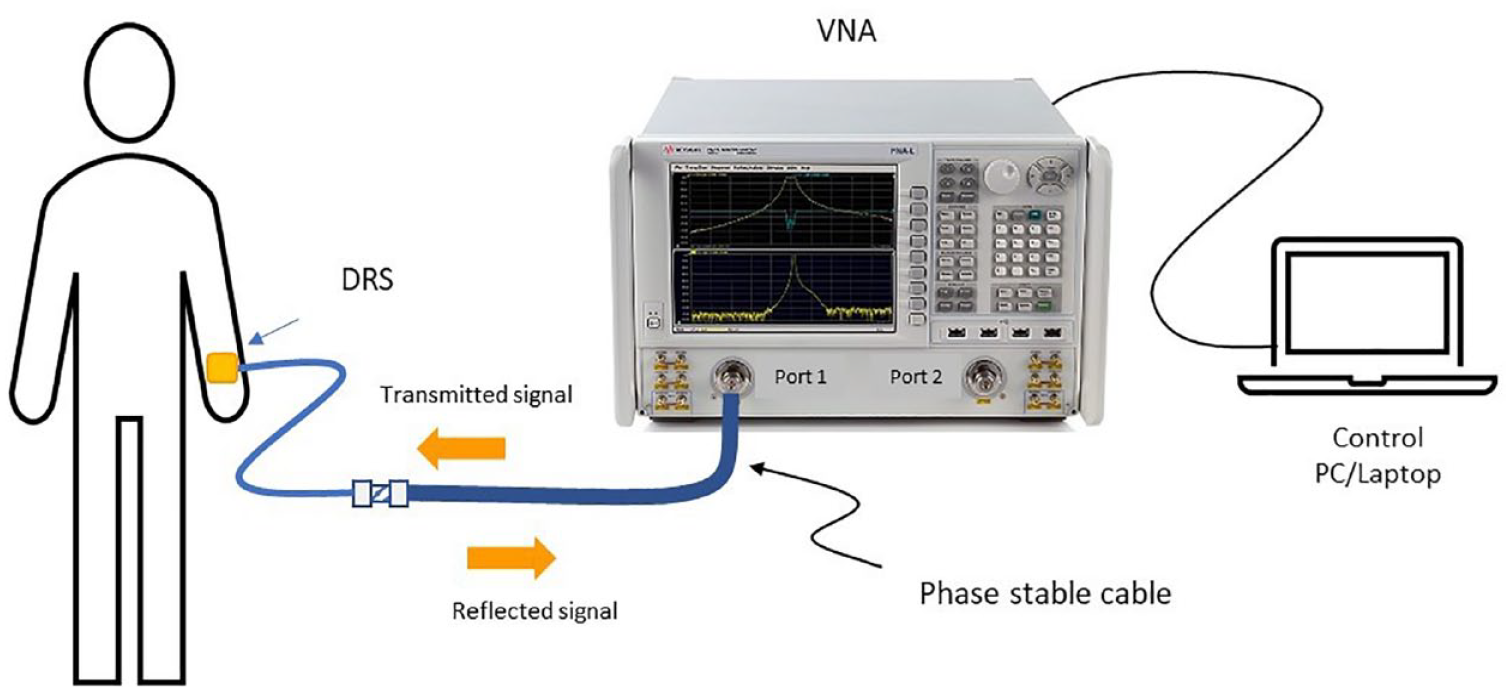
System configuration.
The DRS was integrated into a housing and located onto the underside of the wrist, with the ring facing the wrist (Figure 1, right). Multiple slivers of polytetrafluoroethylene were layered to form a matching layer between the split ring and the wrist. When the DRS is attached to the wrist, it resonates at a specific frequency. However, when the dielectric properties of the blood change due to a change in blood glucose, the resonant frequency (the frequency at which the DRS resonates) of the antenna changes. This shift in resonant frequencies can be correlated to a change in blood glucose value. The resonant frequencies are monitored by the VNA, which is controlled via a laptop that saves all of the detected signal traces and the corresponding time stamps.
Between stages 1 and 2, the DRS and system configuration were modified to reduce measurement noise. The slivers of polytetrafluoroethylene were replaced by a bulk layer of polytetrafluoroethylene of similar thickness to eliminate signal noise from micro air gaps between the polytetrafluoroethylene layers. The cable assembly connecting the DRS to the VNA was replaced with a more stable assembly to reduce the overall measurement noise.
A trial-specific multiple regression model computed the glucose based on the resonant frequency. For each participant, the DRS data measured on one day were used as a training set. On the other day, this model computed glucose based on the raw data from the DRS. Because the sensor was removed between visits, the model built using the first day data was used to compute glucose on the second day, and the model built using the second day data was used to compute glucose on the first day.
Model details are not provided due to their commercially sensitive nature; however, an overview of the process follows. To derive glucose values from the shift in resonant frequencies, first, raw data processing took place where outliers were removed from the resonant frequency data, which were then normalized. A stepwise linear regression model, using an adjusted R2 criteria for inclusion/exclusion of parameters, was then used to model glucose on a per participant basis. One feature observed during the tests was the phenomenon of flipping. This is when a particular parameter behaves in one way to the change in glucose on one test day and then “flips” and behaves in the opposite manner on the next test day. The causes of this are unclear and need further investigation. Parameters that demonstrated “flipping” were excluded from the model at this stage.
Each participant’s model was then applied to the other day’s data to compute the glucose, as well as high (>180 mg/dL) and low (<70 mg/dL) glucose levels. As the sensor was removed between the two test visits, the model developed using data from one visit needed to be normalized to the data from the “next” visit. The normalization used the first few “normal glucose” readings of the “next” data. Once the data were normalized and the flipped parameters discarded, the model developed from the first data set, updated for removed flipped parameters, was then used to compute the glucose from the resonant frequency data from the second visit.
In the current study, the DRS is not being assessed for CGM performance (ie, glucose measurement is not being assessed on a continuous scale compared with another CGM). Instead, two glucose measurements (DRS vs venous) are compared at five-minute intervals. The measurement timing (every 45 seconds for the DRS and every five minutes for the Super GL) means that for every 15 minutes, we collected three Super GL readings and 20 readings from the DRS, of which three were paired with the Super GL data based on the closest collection times. This means that not all of the DRS data points were used in the analyses.
Testing Session Procedures
Participants were connected to a fully automated glucose clamp device (ClampArt, Profil, Neuss, Germany) that continuously measured their blood glucose and concurrently infused intravenous glucose or insulin to control the blood glucose concentration at a prespecified level. Using ClampArt, blood glucose was elevated to 270 mg/dL, then reduced step-wise to 54 mg/dL. This clamping procedure was at the discretion of the clinical team, safety assessments were undertaken before clamping, and the participant’s blood glucose was controlled within the euglycemic range at the end of the clamp experiment.
At time −15 minutes, the DRS was fitted to the participant’s wrist and connected to the VNA. The DRS recorded data approximately every 45 seconds for the duration of the clamping procedure (eight to ten hours). Venous blood samples were taken every five minutes and blood glucose was measured using the Super GL analyzer.
Endpoints
The ARD measures the deviation of the DRS glucose value from the measured venous blood glucose value. The median and mean of these ARD values were the predefined co-primary endpoints, as they are typically used to assess the accuracy of CGM devices. 20 The ARD for each participant at each timepoint on each test day was calculated as follows: (absolute difference between the DRS and laboratory-standard measures of blood glucose)/laboratory-standard measure of blood glucose multiplied by 100%. The median and mean were then calculated across all data points.
The secondary efficacy endpoints were the sensitivity, specificity, precision, and accuracy for the DRS detecting high (>180 mg/dL) and low (<70 mg/dL) glucose values compared with the laboratory-standard device. Sensitivity was defined as follows: number of true positives/(number of true positives plus number of false negatives). Specificity was defined as follows: number of true negatives/(number of true negatives divided by number of false positives). Precision was defined as follows: number of true positives/(number of true positives plus number of false positives). Accuracy was defined as follows: (number of true positives plus number of true negatives)/(sum of true positives, false positives, false negatives, and true negatives).
Safety endpoints were adverse events (AEs) and serious adverse events (SAEs).
Sample Size
The sample size was predefined as up to 40 participants. A formal calculation was not conducted given the exploratory nature of this study.
Statistical Methods
Data from each stage were analyzed using the same approach. All participants with two completed test days were analyzed.
Median ARD and mean ARD were calculated across all data points. Confidence intervals (CIs) were not generated because the data were not independent, and so the associated CIs would be misleading.
Sensitivity, specificity, precision, and accuracy were calculated for each participant at a test day level. Each endpoint was then summarized as median (95% CI) using the centile command in Stata v17.0. As forward and backward estimates were calculated, the number of observations included in the summary level medians is based on the number of test days, that is, double the number of participants.
The surveillance error grid (SEG) and modified Bland-Altman plots were created as additional visualizations of the data. The AEs and SAEs were summarized using counts. No statistical testing or data imputations were conducted.
Results
Stage 1 (Initial Proof of Concept)
Of the seven participants screened, one did not meet eligibility criteria. Therefore, six men with type 1 diabetes (mean age: 55.6 years; range age: 26-56 years; mean BMI: 25.0 kg/m2) enrolled for the two test days (3-4 days apart). Data from one participant were not analyzed because their data flipped; therefore, five participants were analyzed.
Figure 3 shows the distribution of ARD values during stage 1 of the study (as well as subsequent stages). It can be seen that the ARD values were skewed with most ARD values being in the range of 0 to 0.4 and relatively few ARD values of 1 or higher. Accuracy measures are shown in Table 1. The median ARD across all data points was 30% and the mean ARD was 46%. The other accuracy measure and Figure 4 show that the DRS could identify low and high blood glucose levels both in the data set on which the model was built (area under the curve = 0.88 and 0.81, respectively) and from the other test day (area under the curve = 0.91 and 0.82, respectively). The SEG and modified Bland-Altman plot are shown in Supplementary File 1.
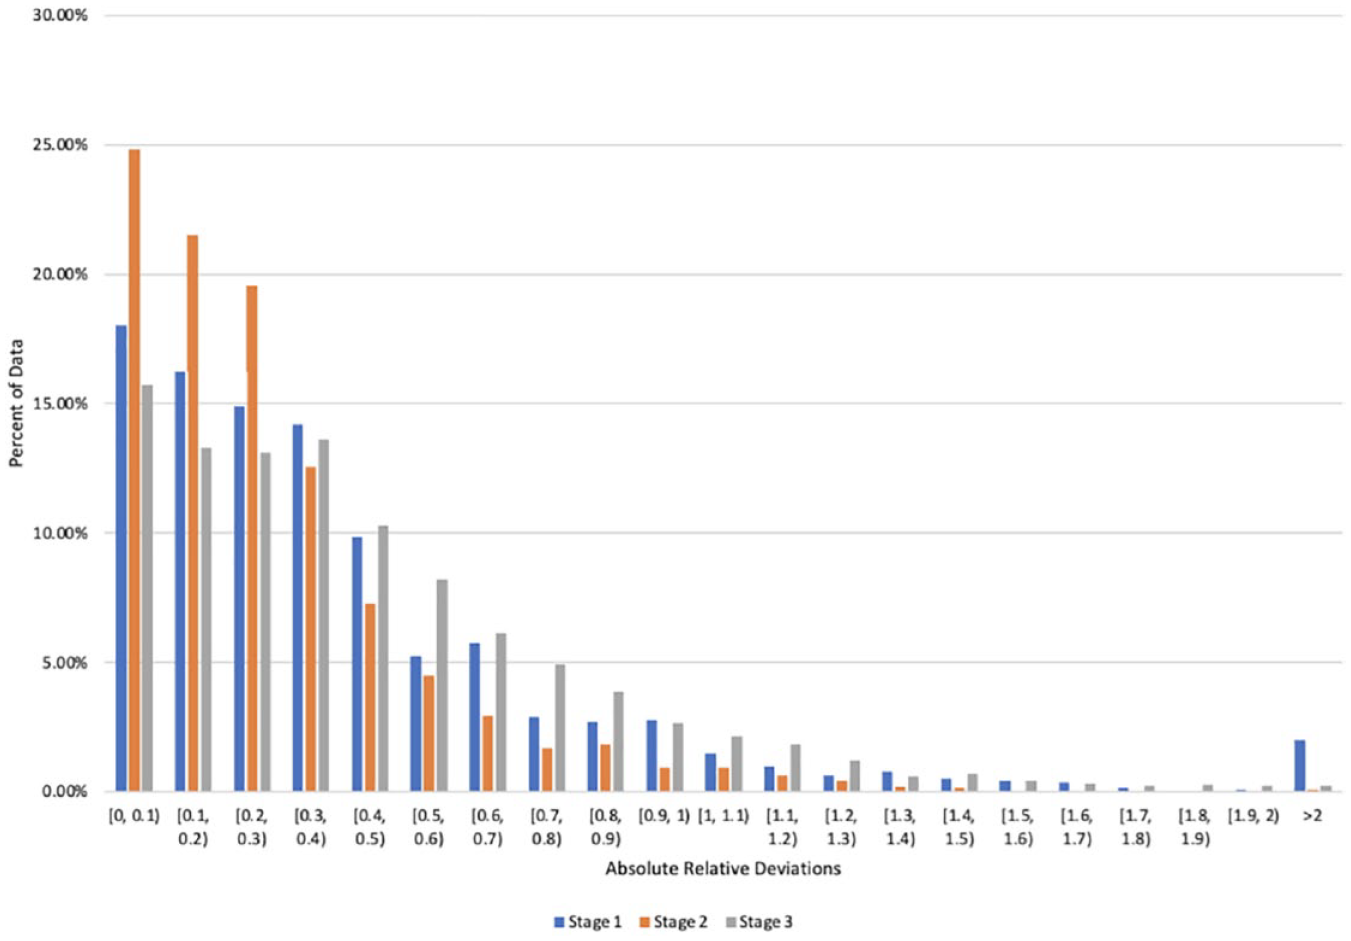
Histogram showing the distribution of absolute relative deviation (ARD) values across the data set for each stage of the study.
Accuracy When Comparing Glucose Values From the Novel Dial Resonating Sensor Prototype With a Laboratory-Standard Measurement.
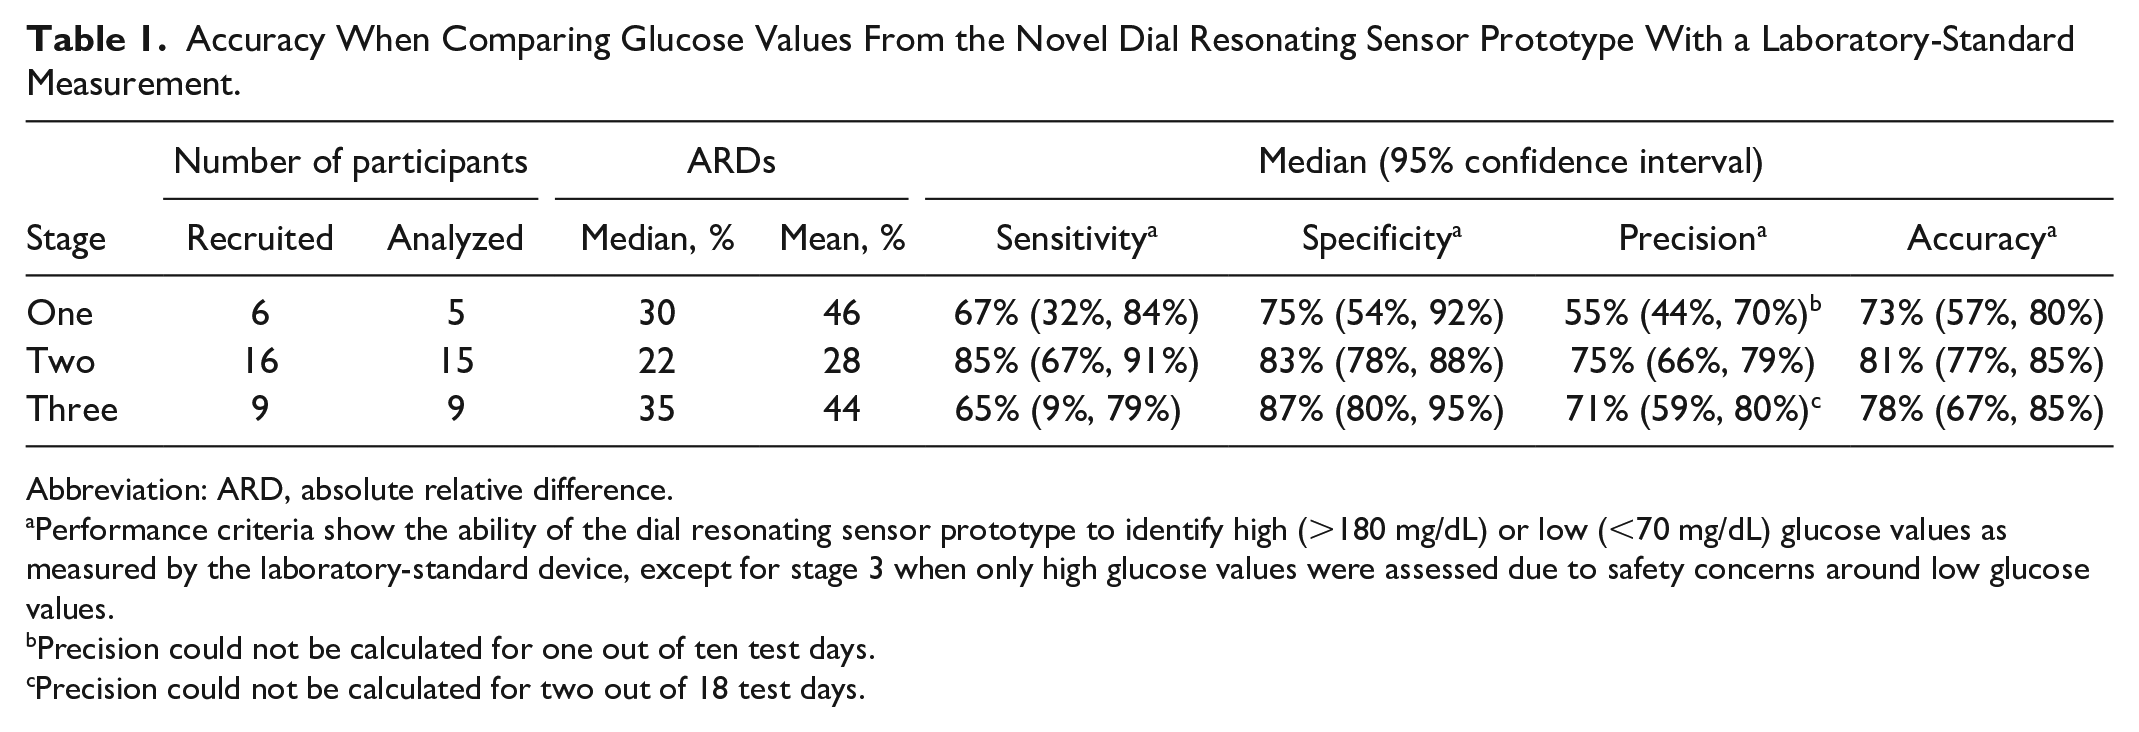
Abbreviation: ARD, absolute relative difference.
Performance criteria show the ability of the dial resonating sensor prototype to identify high (>180 mg/dL) or low (<70 mg/dL) glucose values as measured by the laboratory-standard device, except for stage 3 when only high glucose values were assessed due to safety concerns around low glucose values.
Precision could not be calculated for one out of ten test days.
Precision could not be calculated for two out of 18 test days.
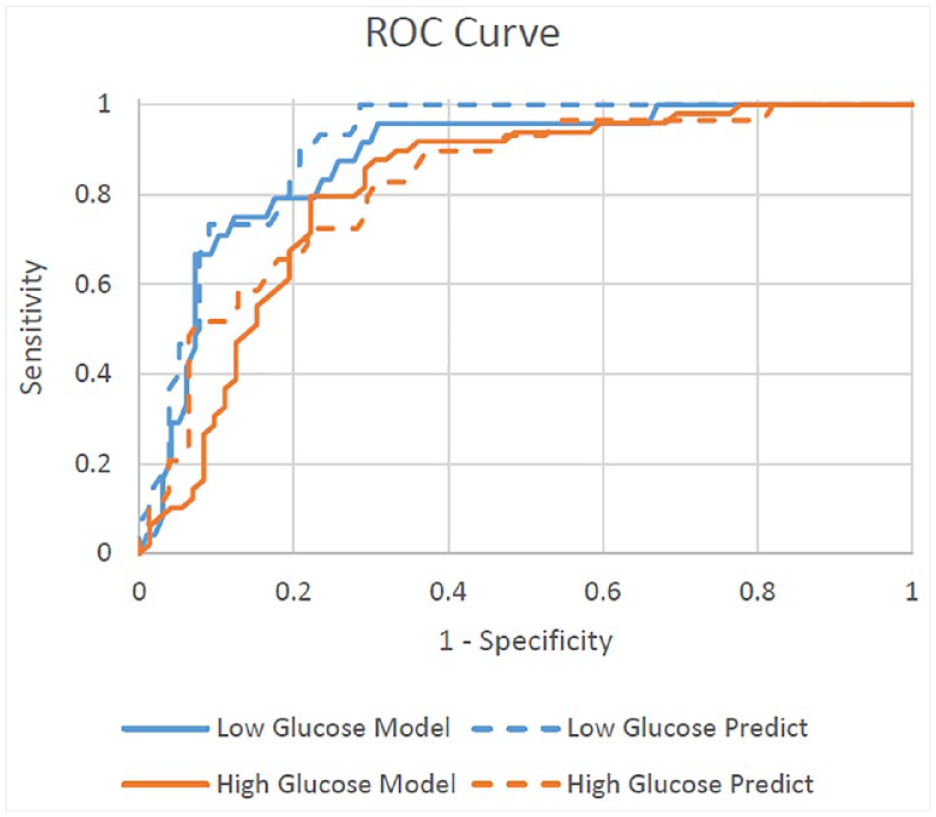
Receiver operating characteristic (ROC) curve showing the ability of the dial resonating sensor prototype and associated model to identify high (>180 mg/dL) or low (<70 mg/dL) glucose measurements in the data set on which the model was built (“Model”) and in a new data set with the same participants (“Predict”) in stage 1 of the study.
Stage 2 (Modified DRS Prototype)
Sixteen participants were screened and recruited, all of whom were males with type 1 diabetes (mean age: 32.0 years; range age: 19-56 years; mean BMI: 25.8 kg/m2). One participant withdrew consent after the first visit (not device-related); therefore, data from 15 participants were analyzed.
All performance criteria demonstrated considerable improvement from stage 1 measures (Figure 3 and Table 1), with a median ARD of 22% and mean ARD of 28%. The other performance criteria ranged between 75% and 85%. The SEG and modified Bland-Altman plot are shown in Supplementary File 1.
Stage 3 (Model Durability)
Nine participants were screened and recruited, all of whom were males with type 1 diabetes (mean age: 34.4 years; range age: 23-51 years; mean BMI: 25.6 kg/m2). Data from all nine participants were analyzed.
The results suggest that, without recalibration of the device between consecutive days, the values were similar to those in stage 1 for median ARD (35% vs 30%, respectively), mean ARD (44% vs 46%, respectively), and sensitivity (65% vs 67%, respectively; Table 1). However, the improvements in specificity, precision, and accuracy that were achieved from stage 1 to stage 2 were largely retained in stage 3, despite the absence of recalibration. The SEG and modified Bland-Altman plot are shown in Supplementary File 1.
Five participants participated in both stages 2 and 3; therefore, their models built during stage 2 were evaluated ten months later in stage 3 as a further test of the model’s durability. The models from stage 3 were also tested in stage 2 data. Models for only two of the participants could be built, due to observed flipping between the two stages. Despite the ten-month gap between the two data sets, the median (95% CI) sensitivity for predicting high glucose was 97% (35%, 100%) and specificity was 72% (54%, 89%).
Safety
No SAEs occurred. In total, 12 AEs were recorded (Table 2). Most AEs were related to the study procedures, only one AE classed as possibly related to the device itself (pain on forearm).
Adverse Events Reported in the Study.
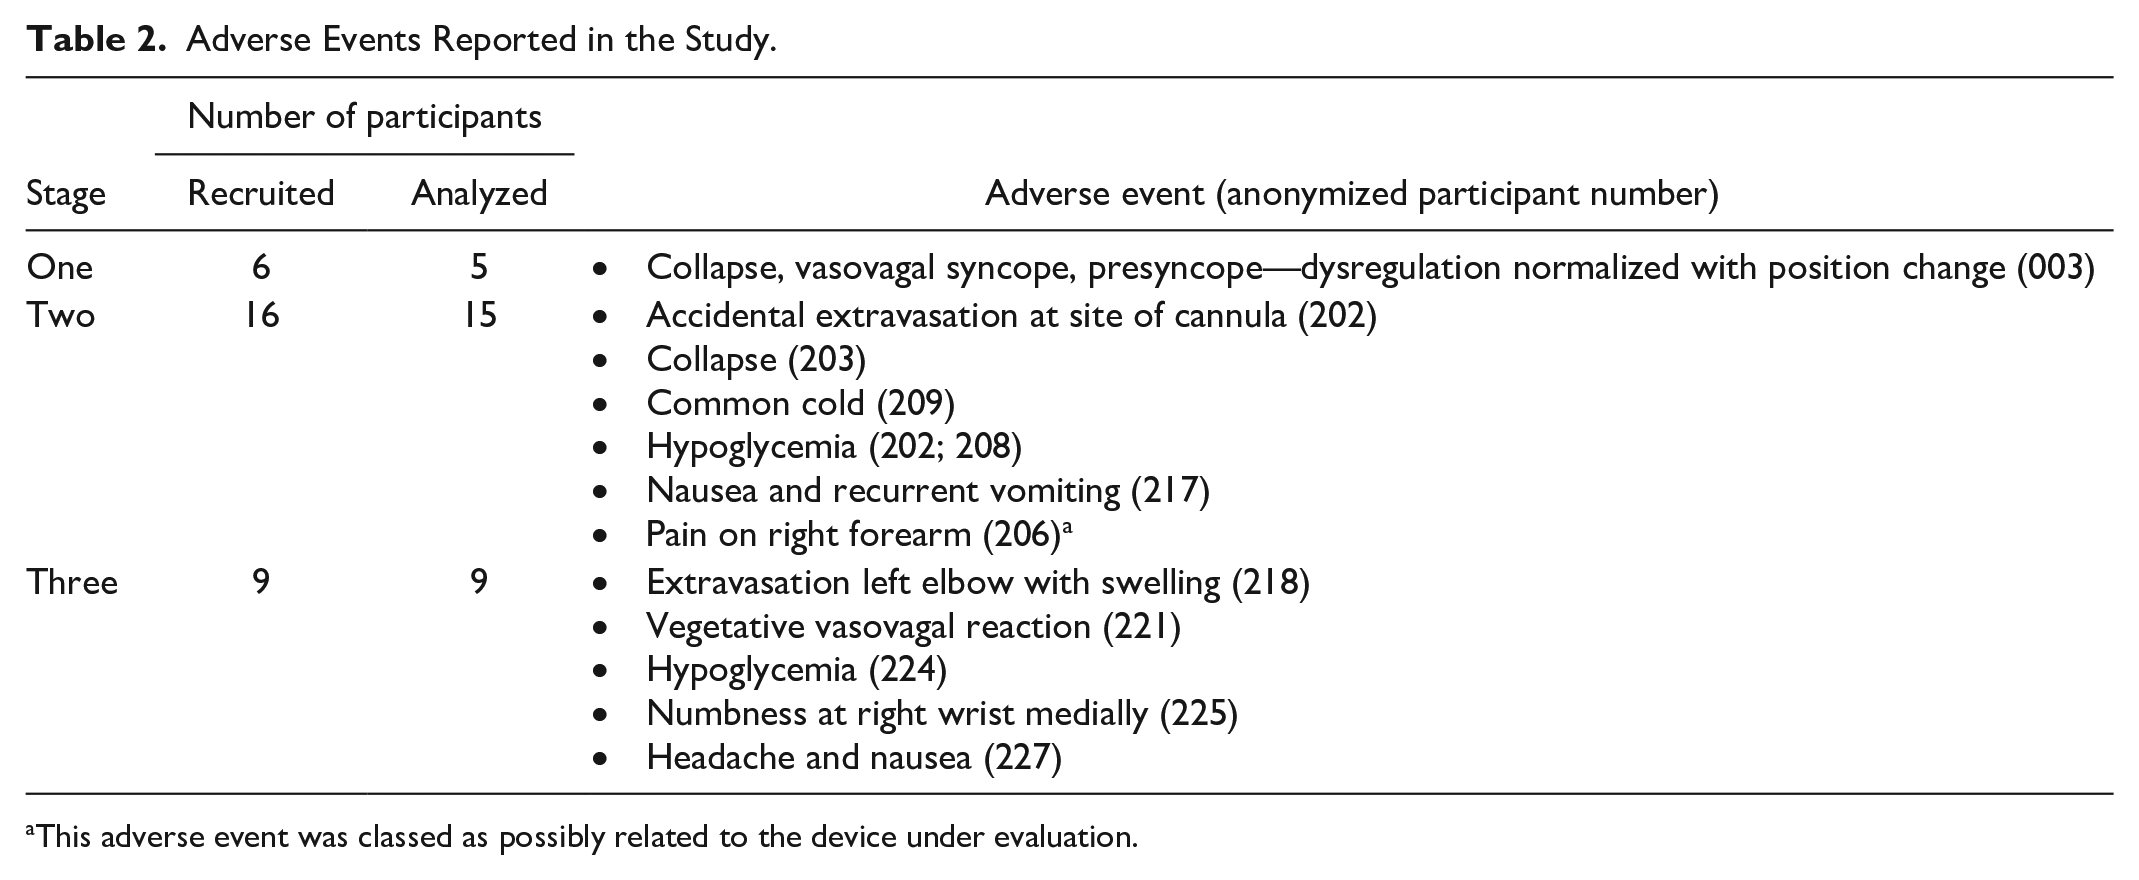
This adverse event was classed as possibly related to the device under evaluation.
Discussion
The DRS prototype detected glucose levels noninvasively across a spectrum of glucose values and correctly identified when it was above or below a threshold. This study was designed to demonstrate that the DRS prototype could detect glucose levels as an initial proof of concept, which was achieved. However, further device refinement is needed to provide more accurate and robust values before the device would have real-world utility.
During the study, the device underwent component changes which resulted in performance improvements. The improved device showed potential to detect glucose levels in real time. The accuracy of the improved device, with a 22% median ARD and 28% mean ARD, is similar to that of the first minimally invasive CGMs when they initially entered the market. For example, the mean ARD for the first-generation Dexcom was 26%. 21
Nevertheless, the mean ARD in this study is higher than the mean ARDs of 2.3% to 20.5% for blood glucose measuring systems evaluated to ISO 15197 22 and the generally acceptable mean ARD level of <10%. 23 Therefore, further development work is still required, and the accuracy of the DRS would need to improve substantially before it would be reasonable to use it within a clinical context. Encouragingly, a few minor DRS updates during the trial were able to improve the accuracy of the device, and further improvements are possible with the data and know-how that this trial generated. Such improvements are likely to include wearability (the prototype is hard-wired, whereas a wireless device would be required for real-life use), technical improvements to lower susceptibility to interference, and statistical improvements to the algorithm to allow more accurate glucose detection. Further studies are also going to take a long data collection of greater than or equal to ten days, where modeling aims are to improve the specificity rate for hyperglycemia, that is, reduce false positives.
Stage 3 demonstrated the durability of the device when left attached to the participant’s arm overnight for 36 hours continuous wear. Without any calibration the following day, the device performance was on par with the initial prototype (stage 1) and, for some measures, the modified prototype (stage 2).
The algorithm built during stage 2 was tested in stage 3 data, and vice versa. These data, albeit provisional and in a very small sample, indicate that an algorithm built and trained on data collected from the device at study sessions ten months apart can detect a participant’s glucose level to an acceptable standard. This demonstrates the robustness of the models over time. However, the algorithm could only be built for two out of five participants with data from both stages 2 and 3, and so further testing is required to better demonstrate this long-term durability.
This study used a basic prototype that required the device to be hard-wired to a VNA. This meant that the participant had to stay still, as movement of the wires introduced significant signal noise. A hard-wire system to an analyzer device clearly increases signal noise and variability and is unfeasible for real-world use. A prototype of the device as a standalone wearable device has therefore been developed, with the VNA functionality integrated into a small form factor. This prototype is currently being tested.
A major strength of this study was its tightly controlled experimental nature, which was conducted by a specialist laboratory. The main limitation was that the recruited study population was narrow (men with type 1 diabetes), despite the inclusion criteria allowing for the inclusion of both sexes and type 1 or type 2 diabetes. It is not anticipated that this would have affected the study findings, or their generalizability, to a large extent because the clamping procedure held blood glucose at set levels, regardless of sex or diabetes type. Furthermore, the main target population for the device would be people with type 1 diabetes. A further limitation is that the models were built after the data were collected, rather than generated through an algorithm at the time of data collection. Going forward, the intent is that the model will be deployed and provide estimates in real time. Furthermore, currently, each computation of glucose is performed independently of all other data points and computations. In future studies, the model will be expanded to use previous time point computations, as well as calibrating glucose values, which should further improve the accuracy of the model.
Conclusion
This study proved that a novel, noninvasive, DRS was capable of detecting glucose levels. Future investigations will test the performance of further device iterations.
Supplemental Material
sj-docx-1-dst-10.1177_19322968231170242 – Supplemental material for Noninvasive Continuous Glucose Monitoring With a Novel Wearable Dial Resonating Sensor: A Clinical Proof-of-Concept Study
Supplemental material, sj-docx-1-dst-10.1177_19322968231170242 for Noninvasive Continuous Glucose Monitoring With a Novel Wearable Dial Resonating Sensor: A Clinical Proof-of-Concept Study by Consuelo Handy, Mohamed Sabih Chaudhry, Muhammad Rafaqat Ali Qureshi, Bradley Love, John Shillingford, Leona Plum-Mörschel and Eric Zijlstra in Journal of Diabetes Science and Technology
Footnotes
Acknowledgements
Dr Danielle Bodicoat (independent consultant) provided writing assistance paid for by Afon Technology Ltd. Bodicoat produced the first draft based on previous submissions, the protocol and Clinical Investigation Report, which was then critically reviewed and updated by the authors. Afon Technology would like to thank Professor Johannes de Vries from Profil Institut für Stoffwechselforschung GmbH, Germany. He was the principal investigator of clinical trials.
Abbreviations
AE, adverse event; ARD, absolute relative difference; BMI, body mass index; CGM, continuous glucose monitor; CI, confidence interval; DRS, dial resonating sensor; SAE, serious adverse event; VNA, vector network analyzer; SEG, surveillance error grid
Authors’ Note
All persons who meet authorship criteria are listed as authors. All authors have participated sufficiently in the work to take public responsibility for the content, including participation in the concept, design, analysis, writing or revision of the manuscript.
Data Access Statement
Data supporting this study are not publicly available due to commercial confidentiality.
Declaration of Conflicting Interests
The author(s) declared no potential conflicts of interest with respect to the research, authorship, and/or publication of this article.
Funding
The author(s) disclosed receipt of the following financial support for the research, authorship, and/or publication of this article: This work was supported by the Welsh Government’s SMARTCymru program, backed by the EU’s European Regional Development Fund (grant number 2019/ED/054).
ORCID iDs
Supplemental Material
Supplemental material for this article is available online.
References
Supplementary Material
Please find the following supplemental material available below.
For Open Access articles published under a Creative Commons License, all supplemental material carries the same license as the article it is associated with.
For non-Open Access articles published, all supplemental material carries a non-exclusive license, and permission requests for re-use of supplemental material or any part of supplemental material shall be sent directly to the copyright owner as specified in the copyright notice associated with the article.