Glucose oxidase (GOx)-based blood glucose monitors (BGMs) are influenced by the partial pressure of oxygen (Po2) within the applied sample. Limited in-clinic data exists regarding the quantitative effect of Po2 in unmanipulated capillary fingertip blood samples across physiologically representative glucose and Po2 ranges.
Method:
Clinical accuracy data were collected as part of a BGM manufacturer’s ongoing post-market surveillance program for a commercially available GOx-based BGM test-strip. The data set comprised 29 901 paired BGM-comparator readings and corresponding Po2 values from 5 428 blood samples from a panel of 975 subjects.
Results:
A linear regression-calculated bias range of 5.22% (+0.72% [low Po2: 45 mm Hg] to −4.5% [high Po2: 105 mm Hg]); biases calculated as absolute at <100 mg/dL glucose was found. Below the nominal Po2 of 75 mm Hg, a linear regression bias of +3.14% was calculated at low Po2, while negligible impact on bias (regression slope: +0.002%) was observed at higher than nominal levels (>75 mm Hg). When evaluating BGM performance under corner conditions of low (<70 mg/dL) and high (>180 mg/dL) glucose, combined with low and high Po2, linear regression biases ranged from +1.52% to −5.32% within this small group of subjects and with no readings recorded at <70 mg/dL glucose at low and high Po2.
Conclusions:
Data from this large-scale clinical study, performed on unmanipulated fingertip capillary bloods from a diverse diabetes population, indicate Po2 sensitivity of the BGM to be markedly lower than published studies, which are mainly laboratory-based, requiring artificial manipulation of oxygen levels in aliquots of venous blood.
The oxygen sensitivity of electrochemical test-strips for blood glucose monitors (BGMs), incorporating glucose oxidase (GOx) enzyme, has been widely reported.1-4 Such systems generally employ a mediator that serves as an electron acceptor for the GOx-catalyzed oxidation of glucose,5,6 with subsequent reoxidation of the mediator at a suitably poised electrode, generating a glucose proportional signal. In physiological systems, dioxygen naturally present within the surrounding medium may also serve as an electron acceptor, with concomitant generation of hydrogen peroxide, which should remain inert at the applied BGM electrode potential. Artificial mediators are preferred to oxygen in BGMs, and indeed in certain continuous glucose monitors (CGMs), because they facilitate signal generation at lower electrode operating potentials, thereby reducing non-glucose-specific signal contributions from electroactive interference within the sample.7 However, an often-quoted drawback of such systems is that oxygen present within the sample may compete with the artificial mediator for electrons within the GOx complex, thereby influencing the mediator-generated glucose-specific signal.1-4,8,9
The International Organization for Standardization (ISO) standard ISO 15197:2013 mandates inclusion of labeling within a device’s instructions for use should an interfering substance be found to influence accuracy.10 Consequently several studies have sought to quantify the extent of GOx-based BGM oxygen interference. Bench studies, as opposed to clinical studies, have received particular attention because they allow manipulation of partial pressure of oxygen (Po2) levels through incubating samples with added air, thereby facilitating systematic assessments of Po2 interference across defined Po2 ranges.11-14 These studies rely on the collection of venous samples, which have relatively low Po2 (30-40 mm Hg),15 requiring careful manipulation to increase Po2 levels to those consistent with capillary blood (40-100 mm Hg).16,17 While laboratory studies may provide a higher degree of control of those variables not under assessment, a more clinically appropriate indication of behavior would be obtained by directly measuring the intended sample matrix, as indicated by a device’s instructions for use (capillary blood for many BGMs), thereby lowering the risk of introducing experimental artifacts arising from artificial sample manipulation.
Despite this need, few studies are reported in which the Po2 sensitivity of GOx-based systems, performed on devices tested with unmanipulated blood samples, has been measured.18,19 This is understandable, given that large studies are required to separate naturally occurring variation from the effects of Po2 within wider patient populations. To evaluate this effect, reported here is an extensive clinical data set permitting the large-scale evaluation and impact of naturally occurring Po2 levels within fingertip capillary blood on the performance of a commercially available GOx-based BGM.
Materials and Methods
Test-Strip
OneTouch Select Plus test-strips are manufactured by LifeScan Inc. and have a capillary blood indication. A reagent chemistry comprising GOx enzyme and ferricyanide mediator is formulated within a polymeric complex and deposited onto a substrate pre-patterned with a five-electrode carbon design. The unique design of the test-strip evaluates the sample during measurement and dynamically adapts algorithm parameters to deliver a hematocrit (Hct)-independent response across the 30%-55% v/v Hct and 20-600 mg/dL blood glucose range.
Clinical Accuracy Measurements
Data were gathered as part of LifeScan’s ongoing clinical post-market surveillance (PMS) activities reported elsewhere.20 Manufactured batches of test-strips were randomly and routinely sampled and sent to 1 of 3 UK clinics, with BGM readings obtained in singlicate with a target of 100 individual subjects with diabetes. Lancing and filling of test-strips with capillary blood were performed by clinical staff with all aspects of testing performed as per instructions for use. Capillary blood samples were collected in separate capillary tubes for singlicate determination of Po2 (Siemens Rapidlab 348 blood gas analyzer; tubes containing observable air bubbles discarded) and Hct (Hettich Hematocrit 210 capillary centrifuge). Capillary blood plasma fractions were obtained concurrently from the same lancing site, and glucose levels were determined in duplicate on 2 laboratory comparator devices (YSI STAT PLUS; Yellow Springs Instrument Co Inc, Yellow Springs, OH, USA). All measurement instruments were subject to daily QC checks.
Data Analysis
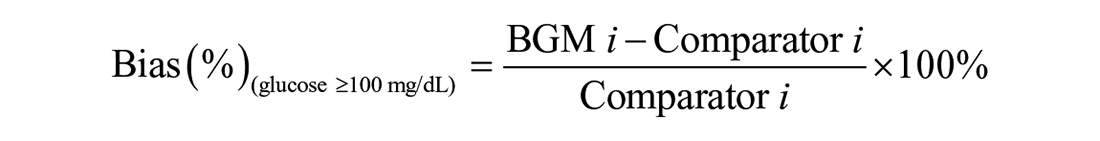
The ISO 15197:2013 definition of clinical accuracy was applied, where at least 95% of all values must fall within either ±15 mg/dL of the average measured comparator value at glucose concentrations <100 mg/dL or ±15% at glucose concentrations ≥100 mg/dL. Bias was calculated as absolute (Bias(Abs) for glucose <100 mg/dL) and relative (Bias(%) for glucose ≥100 mg/dL):
Results
Po2 Distributions
A total of 29 901 paired BGM-comparator readings were recorded, corresponding to 5 428 individual blood Po2 measurements from 975 individual subjects, because multiple tests were performed on a given subject’s blood at each clinic visit. Based on meeting study inclusion criteria, no paired data values were excluded. A mean Po2 of 75.96 mm Hg (SD: ±12.05; range: 34.7-147.4 mm Hg) was recorded. Based on an assumption of normal distribution, skewness was calculated as +1.14 indicating a moderate distribution asymmetry, weighted toward higher Po2 (>105 mm Hg), while the kurtosis of 5.31 indicated a greater proportion of values within the distribution tails than a true normal distribution. These distribution parameters agree with the manufacturer’s full clinical PMS Po2 data set (n = 28 533).21 The only other comparable published study found was Freckmann et al22 in which the capillary fingertip blood Po2 levels of mainly diabetes subjects (n = 110) were assessed, yielding a mean Po2 of 71.1 mm Hg (SD: ±6.9; range 49-86 mm Hg). No relationship between Po2 levels and Hct was seen: Po2 (mm Hg) = −0.01882 × hct + 10.90).
Clinical Accuracy by Dissolved Oxygen Range
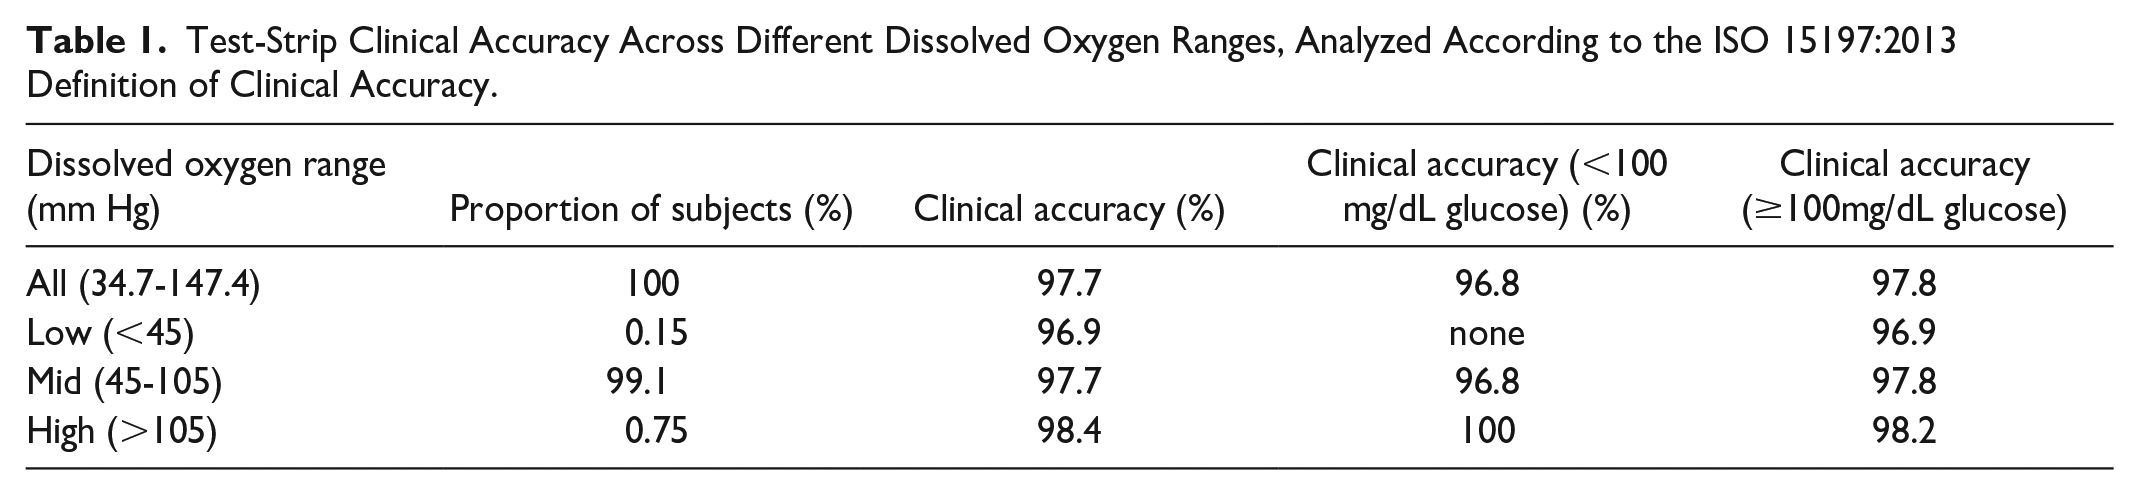
ISO 15197:2013 defined the clinical accuracy of the 29 901 paired values as shown in Table 1. Accuracy was evaluated across the full Po2 range and across the low (<45 mm Hg), mid (45-105 mm Hg), and high (>105 mm Hg) Po2 ranges, at low (<100 mg/dL) and high (≥100 mg/dL) glucose. Acceptable clinical accuracy was achieved in each category (noting that no datapoints were recorded under conditions of low Po2 and low glucose, indicating the infrequency of this clinical condition). The data indicate that overall, extremes of Po2 do not have a significant detrimental effect on the BGM’s system accuracy.
Test-Strip Clinical Accuracy Across Different Dissolved Oxygen Ranges, Analyzed According to the ISO 15197:2013 Definition of Clinical Accuracy.
Dissolved oxygen range (mm Hg)
Proportion of subjects (%)
Clinical accuracy (%)
Clinical accuracy (<100 mg/dL glucose) (%)
Clinical accuracy(≥100mg/dL glucose)
All (34.7-147.4)
100
97.7
96.8
97.8
Low (<45)
0.15
96.9
none
96.9
Mid (45-105)
99.1
97.7
96.8
97.8
High (>105)
0.75
98.4
100
98.2
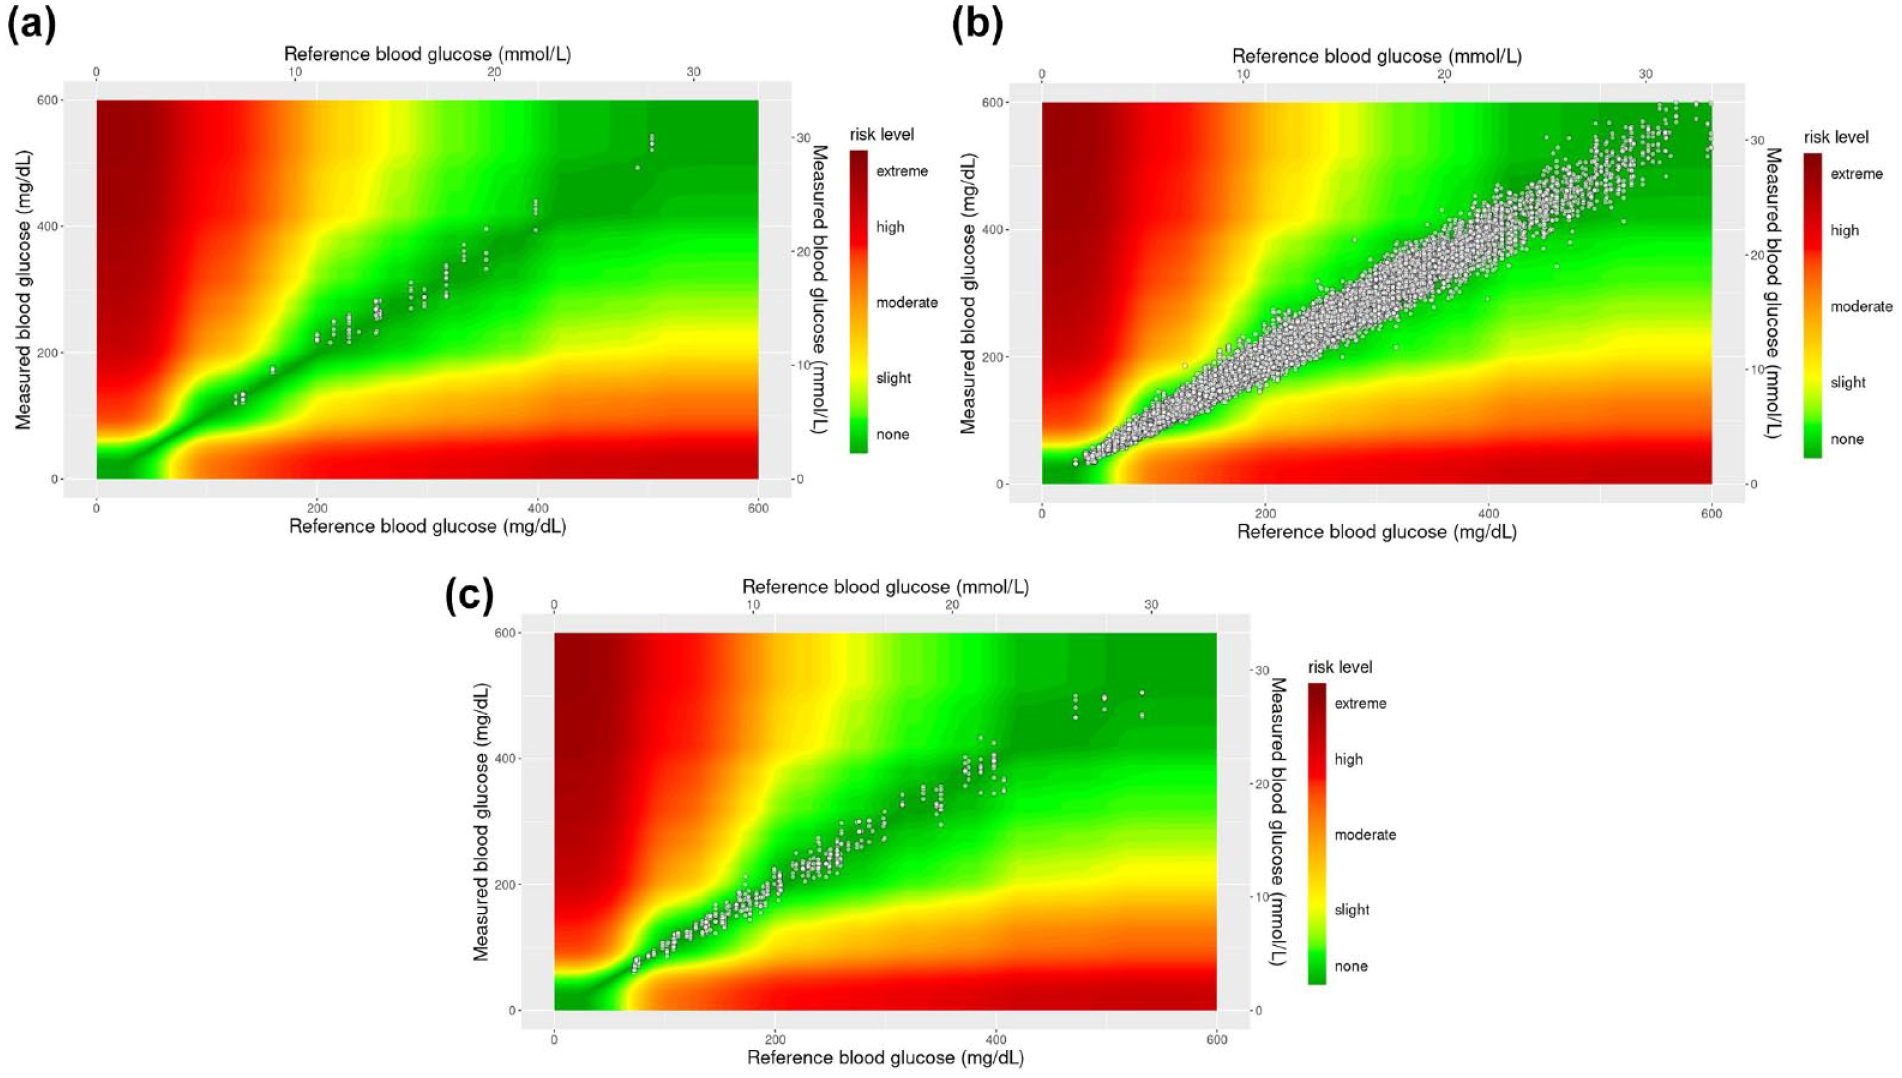
Surveillance error grids (SEGs) of the data set, split by Po2 levels, are shown in Figure 1a-c. At low Po2 (<45 mm Hg), all values (98 data-pairs) were within the SEG risk category ‘None’; in the mid Po2 range (45-105 mm Hg), 98.3% (28 827 data-pairs) were within the risk category “None,” 1.7% (495 data-pairs) were within the risk category “Slight, Lower,” and 6 data-pairs were within the risk category ‘Slight, Higher’; at high Po2 (>105 mm Hg), 97.7% of values (417 data-pairs) were within the risk category “None” and 2.3% of values (10-data-pairs) were within the risk category “Slight, Lower.” No data-pairs were recorded within any of the higher SEG risk categories.
Surveillance error grid plots of blood glucose monitor data shown by Po2 range: (a) low Po2 (<45 mm Hg), (b) mid Po2 (45-105 mm Hg), and (c) high Po2 (>105 mm Hg). Abbreviation: Po2, partial pressure of oxygen.
Relationship Between BGM Bias and Po2
The overall linear regression equation governing the relationship between BGM glucose bias (n=29 901) and corresponding Po2 was
As expected, a relationship between BGM bias and Po2 was evident, quantitatively described as an incremental 10 mm Hg increase in Po2 corresponding to a 0.87 (%, Abs) decrease in BGM bias. Corresponding linear fit biases were calculated at different Po2 thresholds, yielding biases of −1.89 (%, Abs) at the nominal Po2 of 75 mm Hg and biases of +0.72 and −4.50 (%, Abs) at Po2 extremes of 45 and 105 mm Hg, respectively.
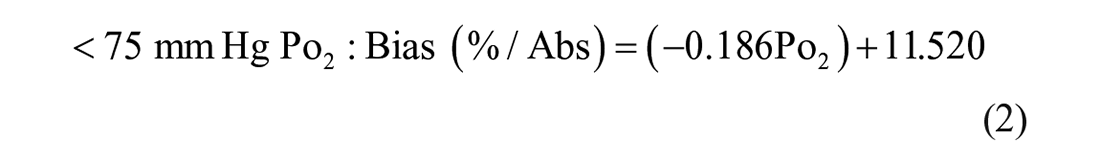
An additional analysis was undertaken to evaluate the oxygen effect on the BGM bias at Po2 levels above and below the nominal Po2 of 75 mm Hg. The following linear regression equations were recorded:
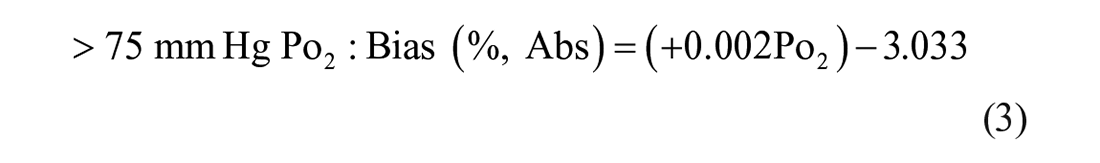
The BGM exhibits a greater sensitivity to Po2 levels below the nominal Po2, with a 2.14-fold increase in slope compared with the full data set (−0.186 vs 0.087). In context, ISO 15197:2013 describes clinical accuracy as BGMs in which >95% of results have a bias less than ±15 mg/dL/±15% to comparator, for which equation (2) allows the linear fit bias of the BGM at low Po2 (45 mm Hg) to be calculated as +3.14 (%, Abs). The behavior of the BGM at greater than the nominal Po2 was unexpected, based on the theory relating to oxygen effect on GOx-based oxygen-sensitive BGMs; the slope of +0.002 is negligible (a 10 mm Hg change in Po2 altering the bias by an average 0.01 [%, Abs]), demonstrating the BGM to be essentially insensitive to Po2 above the nominal 75-mm Hg population based on the full glucose range encountered.
Relationship Between Glucose Concentration and Po2
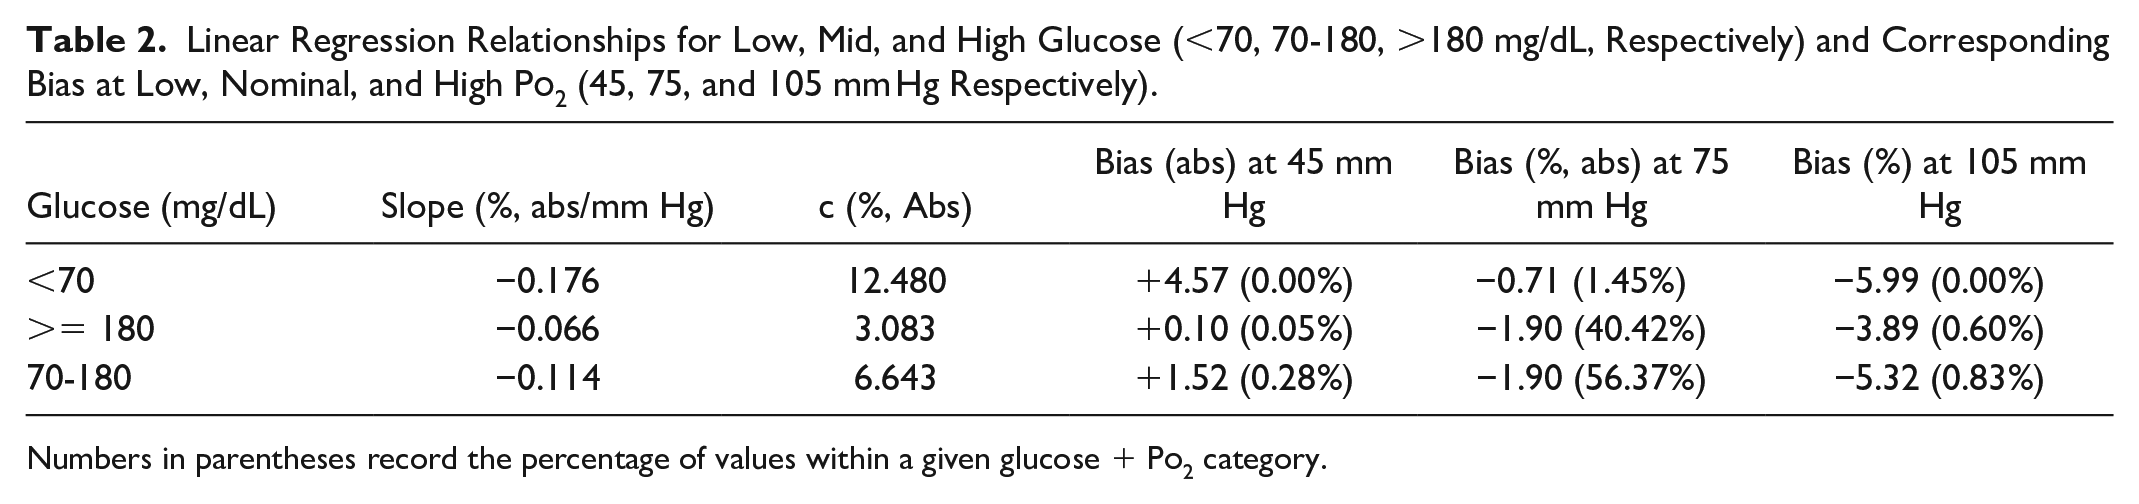
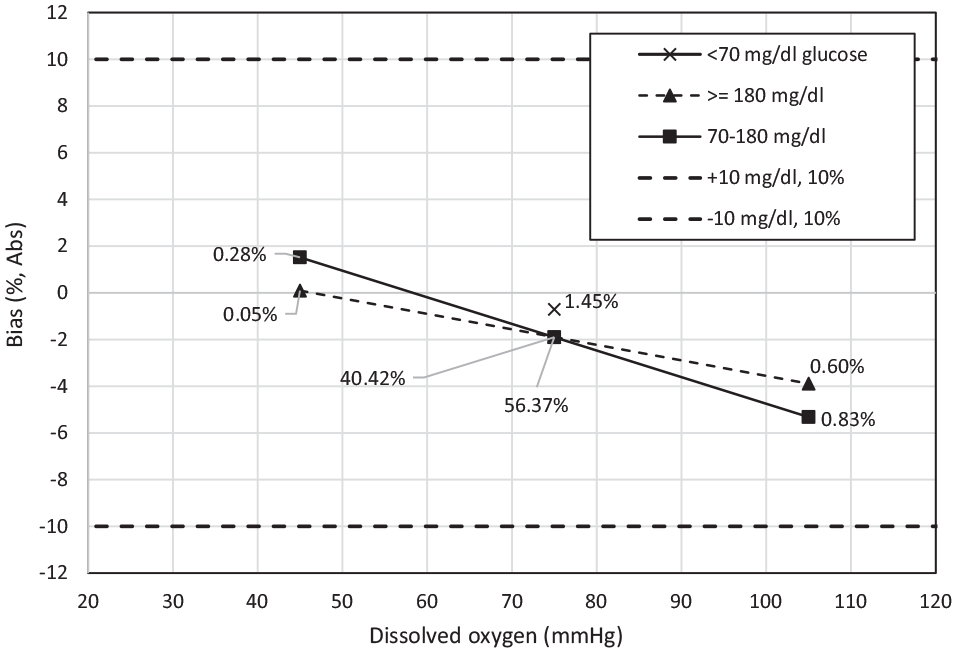
The relationship between BGM bias and Po2 levels was also evaluated by glucose level: low (<70 mg/dL), mid (70-180 mg/dL), and high (>180 mg/dL)—these glucose levels being selected as representing hypoglycemia, euglycemia, and hyperglycemia, respectively.23 The resultant linear regression relationships within each glucose range and at low, nominal, and high Po2 are shown in Table 2 and Figure 2. While ISO 15197:2013 defines the clinical accuracy of a system as the proportion of individual bias values within ±15 mg/dL or ±15% of reference, the standard also defines the acceptable limit for the effect of an individual interference. In this case, the mean bias of the test system should not exceed ±10 mg/dL or ±10% of reference (at glucose <100 mg/dL and ≥100 mg/dL, respectively). These values are represented as dotted lines in Figure 2.
Linear Regression Relationships for Low, Mid, and High Glucose (<70, 70-180, >180 mg/dL, Respectively) and Corresponding Bias at Low, Nominal, and High Po2 (45, 75, and 105 mm Hg Respectively).
Glucose (mg/dL)
Slope (%, abs/mm Hg)
c (%, Abs)
Bias (abs) at 45 mm Hg
Bias (%, abs) at 75 mm Hg
Bias (%) at 105 mm Hg
<70
−0.176
12.480
+4.57 (0.00%)
−0.71 (1.45%)
−5.99 (0.00%)
>= 180
−0.066
3.083
+0.10 (0.05%)
−1.90 (40.42%)
−3.89 (0.60%)
70-180
−0.114
6.643
+1.52 (0.28%)
−1.90 (56.37%)
−5.32 (0.83%)
Numbers in parentheses record the percentage of values within a given glucose + Po2 category.
Relationship between bias and Po2 across the low (<70 mg/dL), mid (70-180 mg/dL), and high (>180 mg/dL) glucose ranges, based on linear regression relationships recorded in Table 2. The percentage of paired-data values in each category is recorded within the plot. No samples having low glucose in combination with low (45 mm Hg) and high (105 mm Hg) Po2 were recorded. Negative biases were seen at high Po2 for both mid and high glucose, accounting for 0.60% and 0.83% of all values recorded. Dashed lines represent ±10 mg/dL or % bias from comparator. Abbreviation: Po2, partial pressure of oxygen.
At low glucose, no values were recorded at either low or high Po2; low glucose in the nominal Po2 range (1.45% of total BGM readings) yielded a bias of −0.71 mg/dL. The mid glucose range at low Po2 (0.05% of readings) yielded a bias of +0.10 (%, Abs), compared with −3.89 (%, Abs) at high Po2. At high glucose, the effect of Po2 on bias at low and nominal Po2 was minimal (+1.52%, −1.90%, respectively), while the high glucose/Po2 combination (0.83% of readings) yielded a bias of −5.32%. For context, the ISO 15197:2013 standard describes a noninterfering effect as a less than ±10 mg/dL or ±10% (<100 mg/dL and ≥100 mg/dL glucose, respectively) difference between a test and nominal condition.
Discussion
This large-scale clinical study, using unmanipulated fingertip capillary blood samples, indicates the Po2 sensitivity of the BGM system to be markedly lower than published studies. While the postulated oxygen interfering mechanism of electrochemical GOx-BGMs has been described earlier, BGMs are calibrated to nominal Po2, which is most representative of the wider end-user population. Therefore, blood samples having a higher than nominal Po2 will tend to underestimate glucose levels and vice versa. Based on the mechanistic interpretation of Po2 interference, several researchers have sought to quantify this oxygen effect, with investigations having mostly been laboratory rather than clinic-based, as they allow collection of venous blood samples of sufficient volume to allow (relatively) controlled manipulation of Po2 levels. However, careful control of the bench-manipulation of blood samples, and maintaining sample parameters within acceptable limits, is essential for gathering BGM data representative of the performance obtained with unmanipulated blood samples, if relevant conclusions are to be drawn.24,25
Baumstark et al11 have evaluated the Po2 effect on five anonymized GOx-based BGMs. Aliquots of venous blood were collected (n = 26 subjects) and Po2 levels immediately determined. For low Po2, only bloods below a value of 45 mm Hg were evaluated. To raise Po2 levels to designated nominal and high Po2 targets (70 and ≥150 mm Hg, respectively), air was introduced prior to incubation. Once Po2 levels were within target, glucose measurements were performed on each BGM, and mean biases of low and high Po2 to nominal were calculated. Mean biases at <45 mm Hg varied from +6.1 to +22.6% (min. +3.0%, max. +37.9% by system); mean biases at ≥150 mm Hg varied from −7.9 to −14.9% (min. −5.1%, max. −28.9%), yielding maximum/minimum bias ranges of 37.5% and 14.0%. In a subsequent study in the same laboratory, Schmid et al12 reported similar behaviors for five GOx systems (mean biases at <45 mm Hg: +11.8-+44.5%, min. +5.5%, max. +71.5%; mean biases at ≥150 mm Hg: −15.8 to −21.2%, min. −5.1%, max. −28.9%; maximum/minimum bias ranges: 65.7%/26.4%). Similar oxygen interfering observations have been reported in other earlier studies, where again venous blood samples were manipulated to alter Po2 levels.13,14 (Note: The launch of the OneTouch Select Plus BGM system postdated both of these studies.)
Baumstark et al,18 recognizing the limitations of bench-based Po2 manipulation studies, performed capillary blood measurements on two anonymized GOx-based BGMs in which no manipulation of sample Po2 levels had been undertaken. Linear regression equation–calculated relative biases varied from +11.7% to −2.6% and +5.4% to −4.3% by BGM across the Po2 range, yielding maximum and minimum bias ranges of 14.3% and 9.7%, generally much narrower compared with most bench studies, although sample Po2 ranges were narrower (mean: 67.1 mm Hg; range: 52-85 mm Hg). The authors concluded that large-scale studies were required to verify Po2 influences.
The greater bias gradient seen at lower Po2 in this study were in accordance with other studies,11,12 although the linear regression–calculated bias of +3.1 (%, Abs) at 45 mm Hg was lower than previously reported. However, a different behavior was seen at Po2 levels >75 mm Hg, where overall the Select Plus system exhibited minimal oxygen sensitivity. This reduced oxygen insensitivity at higher Po2 in the OneTouch Select Plus GOx-ferricyanide BGM is in accordance with Chun et al19 who, studying native Po2 levels in subjects receiving elevated oxygen therapy, observed a similar level of oxygen insensitivity in arterial blood samples, albeit at Po2 levels >150 mm Hg. Similarly, the clinical arm of Tang’s study,14 performed on non-oxygen manipulated venous blood samples, incubated in collection vessels for up to 40 minutes, also suggests possible reduced oxygen sensitivity as Po2 levels naturally increased in the incubated samples. However, these observations challenge the bench studies11,12 where biases of up to −21.2% were recorded. The study by Baumstark et al,18 based on unmanipulated capillary samples, was of limited size with few native Po2 recorded >75 mm Hg, preventing definitive conclusions from being drawn regarding system behavior at elevated Po2, a limitation that the authors recognized.
The design of a GOx-based BGM will, in part, dictate the device’s sensitivity to Po2. For example, the physicochemical nature of a reagent formulation will influence the diffusional behavior of each reactant material. This may explain why a more modest overall bias is seen with the studied BGM versus published data. However, this explanation seems less likely with respect to the observed oxygen insensitivity of the Select Plus BGM at higher Po2 levels.
An explanation for this behavior may lie in the fact that different methodologies were employed in the two study approaches. The venous blood studies were laboratory-based, requiring venipuncture, collection of aliquots of venous blood into heparinized tubes, and subsequent artificial manipulation of the mid and higher Po2 samples. The clinical study reported here was based on unmanipulated capillary fingertip blood samples (as per indicated use) and collection by lancet, as per instructions for use. The significant size of the collected data set reported here (n = 29 901 samples) allowed the systematic bias due to Po2 to be observed against the other drivers of variability (eg, from medications and endogenous interference), thus overcoming the risk incurred by smaller studies of bias being driven by an uncontrolled source of variation.
A further consideration is that, in the native environment, tissues are protected from hypoxic and hyperoxic effects via the sigmoidal relationship between hemoglobin-bound oxygen and free oxygen in the blood. This equilibrium relationship exists for the subject group studied here, where steady state conditions would prevail, but would not be the case in the laboratory studies in which Po2 levels were manipulated. As such, it may be argued that the data presented here are more representative of actual clinical practice.
The essential insensitivity of the studied BGM to oxygen at above nominal levels across the wider glucose range was unexpected and does not agree with theory. The cause of this behavior is not yet understood but may be assumed representative in that it is supported by ~30 000 datapoints. Oxygen is sparingly soluble in aqueous media; even at the highest recorded Po2 level (147.4 mm Hg), calculations show that there is very considerable excess of mediator in comparison with oxygen molecules, as per BGM design. As such, features designed for the limitation of glucose flux to the reagent chemistry are not required, unlike the case for glucose sensing systems, including CGMs, that similarly rely on oxygen as the mediating species.26 In dried form, the enzyme/mediator chemistry is held within a polymer complex, which partially solubilizes during blood wetting and ensuing measurement sequence. A mechanistic explanation based on oxygen limitation from the bulk medium due to the dissolution of this complex would appear to be an unlikely cause for the behavior seen. Indeed, the general linearity of the bias/Po2 relationship would suggest nonlimitation of the oxygen substrate, with little evidence of deviation from linearity as the upper extreme of Po2 is reached.
The magnitude of this study addresses certain limitations evident in previously reported investigations, allowing representative oxygen relationships to be observed across both full and defined glucose/Po2 ranges, as well as against other potentially interfering factors including Hct and exogenous/endogenous substances. However, while BGM samples were obtained as indicated in the instructions for use (unmanipulated fingertip capillary blood), the greater sample volume required for subsequent Po2 measurement required capillary blood to be collected into a capillary tube for direct introduction to the dissolved gas analyzer, raising the possibility that such sample handling may increase sample Po2 levels. Po2 distributions, evaluated against an assumption of normality, did exhibit skewness (+1.14), indicating a weighting toward higher Po2. As no exclusions were made for subjects on oxygen therapy, this latter factor may also be a contributor to the positive skewness seen.
Conclusions
This data set, based on the manufacturer’s ongoing PMS program, allowed a population-level comparison of the clinical accuracy and Po2 levels of a panel of unmanipulated capillary fingertip blood samples from diabetes subjects. The size of the data set (n = 29 901) allows the systematic bias engendered by variable Po2 to be observed against the wider range of variables that may routinely be found in clinic, thus allowing a more representative assessment of the effect of Po2 on performance of a commercially available GOx-based BGM. Furthermore, the size of the study reasonably includes samples from subjects with comorbidities and thus is representative of the wider BGM user population. While the BGM showed a systematic bias of ~+3% at low Po2 levels (<45 mm Hg), this was modest in comparison with reports on the performance of other GOx-based BGMs. The low Po2 sensitivity of the BGM reported here challenges current perceptions regarding the oxygen sensitivity of GOx-based BGMs that have hitherto been mainly based on laboratory studies designed to mimic the behavior of capillary bloods at extremes of Po2 which, through venous blood sample manipulation, potentially markedly overstate GOx-based BGM Po2 sensitivity.
Footnotes
Acknowledgements
The authors would like to thank the LifeScan Clinical Operations Team and the NHS site staff at each of the UK clinics for study conduct.
The author(s) declared the following potential conflicts of interest with respect to the research, authorship, and/or publication of this article: SS, SP, HC, and MG are employees of LifeScan Scotland, Ltd.
Funding
The author(s) disclosed receipt of the following financial support for the research, authorship, and/or publication of this article: This study was funded by LifeScan Scotland Ltd.
ORCID iDs
Steven Setford
Stuart Phillips
Mike Grady
References
1.
MartensNHindleAHallEAH. An assessment of mediators as oxidants for glucose oxidase in the presence of oxygen. Biosens Bioelect. 1995;10(3-4):393-403. doi:10.1016/0956-5663(95)96857-U.
2.
WangJMoJWLiSPorterJ.Comparison of oxygen-rich and mediator-based glucose-oxidase carbon-paste electrodes. Analytica Chimica Acta. 2001;441(2):183-189. doi:10.1016/S0003-2670(01)01116-3.
3.
HoraguchiYSaitoSKojimaKTsugawaWFerriSSodeK.Engineering glucose oxidase to minimize the influence of oxygen on sensor response. Electrochimica Acta. 2014;126:158-161. doi:10.1016/j.electacta.2013.09.018.
4.
KurahashiKMarutaHUsudaYOhtsukaM.Influence of blood sample oxygen tension on blood glucose concentration measured using an enzyme-electrode method. Crit Care Med. 1997;25(2):231-235. doi:10.1097/00003246-199702000-00006.
5.
CassAEDavisGFrancisGD, et al. Ferrocene-mediated enzyme electrode for amperometric determination of glucose. Anal Chem. 1984;56(4):667-671.
6.
BambhaniaHMChakrabortyDWenHBartonSC.Impact of oxygen on glucose oxidation kinetics in a redox polymer mediated glucose oxidase electrode. J Electrochem Soc. 2017;164(4):H232-H240. doi:10.1149/2.1671704jes.
7.
LeeIProbstDKlonoffDSodeK.Continuous glucose monitoring systems-current status and future perspectives of the flagship technologies in biosensor research. Biosens Bioelectron. 2021;181:113054. doi:10.1016/j.bios.2021.113054.
8.
PrévoteauAManoN.Oxygen reduction on redox mediators may affect glucose biosensors based on “wired” enzymes. Electrochimica Acta. 2012;68:128-133. doi:10.1016/j.electacta.2012.02.053.
9.
PrévoteauAManoN.How the reduction of O2 on enzymes and/or redox mediators affects the calibration curve of “wired” glucose oxidase and glucose dehydrogenase biosensors. Electrochimica Acta. 2013;112:318-326.
10.
International Organization for Standardization. In vitro diagnostic test systems—requirements for blood-glucose monitoring systems for self-testing in managing diabetes mellitus (ISO 15197:2013). https://www.iso.org/standard/54976.html. Accessed February 15, 2023.
11.
BaumstarkASchmidCPleusSHaugCFreckmannG.Influence of partial pressure of oxygen in blood samples on measurement performance in glucose-oxidase-based systems for self-monitoring of blood glucose. J Diabetes Sci Technol. 2013;7(6):1513-1521. doi:10.1177/193229681300700611.
12.
SchmidCBaumstarkAPleusSHaugCTesarMFreckmannG.Impact of partial pressure of oxygen in blood samples on the performance of systems for self-monitoring of blood glucose. Diabetes Technol Ther. 2014;16(3):156-165. doi:10.1089/dia.2013.0184.
13.
TangZLouieRFLeeJHLeeDMMillerEEKostGJ.Oxygen effects on glucose meter measurements with glucose dehydrogenase- and oxidase-based test-strips for point-of-care testing. Crit Care Med. 2001;29(5):1062-1070.
14.
TangZLouieRFPayesMChangKCKostGJ.Oxygen effects on glucose measurements with a reference analyzer and three handheld meters. Diabetes Technol Ther. 2000;2(3):349-362. doi:10.1089/15209150050194215.
15.
ChuYCChenCZLeeCHChenCWChangHYHsiueTR.Prediction of arterial blood gas values from venous blood gas values in patients with acute respiratory failure receiving mechanical ventilation. J Formos Med Assoc. 2003;102(8):539-543.
16.
SharmaSHashmiMF. Partial pressure of oxygen. In: StatPearls [Internet]. Treasure Island, FL: StatPearls Publishing; 2022.
17.
AroraSTantiaP.Physiology of oxygen transport and its determinants in intensive care unit. Indian J Crit Care Med. 2019;23(suppl 3):S172-S177. doi:10.5005/jp-journals-10071-23246.
18.
BaumstarkAPleusSJendrikeN, et al. Proof of concept study to assess the influence of oxygen partial pressure in capillary blood on SMBG measurements. J Diabetes Sci Technol. 2019;13(6):1105-1111.
19.
ChunTYHiroseMSawaT, et al. The effect of the partial pressure of oxygen on blood glucose concentration examined using glucose oxidase with ferricyan ion. Anesth Analg. 1994;79(5):993-997. doi:10.1213/00000539-199411000-00030.
20.
SetfordSGradyMPhillipsS, et al. Seven-year surveillance of the clinical performance of a blood glucose test-strip product. J Diabetes Sci Technol. 2017;11(6):1155-1162. doi:10.1177/1932296817703133.
21.
SetfordSPhillipsSCameronHGradyM.Distribution of oxygen partial pressures in native capillary fingertip blood samples from a large diabetes patient population. J Diabetes Sci Technol. 2022May19:19322968221095055. doi: 10.1177/19322968221095055. Epub ahead of print. PMID: 35587101.
22.
FreckmannGSchmidCBaumstarkAPleusSLinkMHaugC.Partial pressure of oxygen in capillary blood samples from the fingertip. J Diabetes Sci Technol. 2013;7(6):1648-1649.
23.
American Diabetes Association. 6. Glycemic targets: standards of medical care in diabetes—2019. Diabetes Care. 2019;42(suppl 1):S61-S70. doi:10.2337/dc19-S006.
24.
DemircikFKlonoffDMusholtPBRamljakSPfütznerA.Successful performance of laboratory investigations with blood glucose meters employing a dynamic electrochemistry-based correction algorithm is dependent on careful sample handling. Diabetes Technol Ther. 2016;18(10):650-656. doi:10.1089/dia.2016.0202.
25.
FreckmannGBaumstarkASchmidCPleusSLinkMHaugC.Evaluation of 12 blood glucose monitoring systems for self-testing: system accuracy and measurement reproducibility. Diabetes Technol Ther. 2014;16(2):113-122. doi:10.1089/dia.2013.0208.
26.
HellerAFeldmanB.Electrochemical glucose sensors and their applications in diabetes management. Chem Rev. 2008;108(7):2482-2505. doi:10.1021/cr068069y.