
Abstract
A data set comprising 28 533 oxygen partial pressure (pO2) values gathered from nonarterialized fingertip capillary blood samples of a large diabetes population is reported. Data were gathered routinely as part of the ongoing clinical surveillance activities of a blood glucose monitoring (BGM) system manufacturer. Overall, a mean pO2 level of 75.3 mm Hg was recorded, with a standard deviation (SD) of 10.6 mm Hg and a range of 27.7 to 151.5 mm Hg. This data set, unique in terms of size, gathered more than 14 years at four separate clinical sites, provides a robust and comprehensive representation of an unmanipulated pO2 fingertip capillary sample distribution, which should be of interest for physiological reasons, but also from a medical device development perspective, in which the effect of pO2 on device performance may be an important design consideration.
Introduction
The literature reveals a limited number of small-scale studies reporting natural oxygen partial pressures (pO2) in capillary fingertip blood samples, with no clear consensus regarding the typical range or distribution of pO2 in the wider population. This is perhaps due to established medical practice that considers arterial pO2 measurement as the gold standard for assessing patient oxygenation and ventilatory status. 1 However, knowledge of pO2 distributions in fingertip capillary samples is of relevance to measurement devices in which accuracy may be influenced by the presence of dissolved oxygen.2,3 Robust in-depth data regarding fingertip capillary pO2 would also be beneficial in supporting the regulation of capillary blood monitoring systems and assigning reference sample sources.
Reported here are pO2 distribution data from a database of 28 533 individual fingertip capillary samples, collected from subjects with a diabetes diagnosis, across the period 2005-2019. Data originates from samples analyzed during routine studies at four UK clinical sites as part of an ongoing postmarket surveillance program by a manufacturer to assess clinical accuracy of its portfolio of blood glucose monitoring (BGM) devices.4-7
Methods
Testing was performed by trained operators using validated test equipment and methodologies. All equipment was maintained, calibrated, and operated as per defined work instructions. Single samples (100 μL approx.) of a subject’s fingertip capillary blood were collected in a heparinized capillary tube and a single pO2 measurement made using a Siemens Rapidlab 348 (replacing the 248 model in 2007) blood gas analyzer, the operator discarding all samples containing observable bubbles of air. The Rapidlab analyzers were verified daily against the manufacturer’s own assigned QC material ranges (Rapid QC Plus; Siemens Healthcare, Erlangen, Germany).
All readings were recorded in the sponsor’s secure database and analyzed using SPSS software. Outliers were defined by z score, where z = (observed value − population mean)/population standard deviation. While certain subject-specific information was recorded, no details were available as to whether the subject was receiving oxygen therapy at the time of testing. Subjects were able to participate in repeat studies, thus the database is not wholly composed of unique subject pO2 values. The study was initiated in 2005 and has been used to gather oxygen data for information purposes. Electronic data capture of all clinical study data commenced in 2016. Extrapolation from the electronic records indicates that the pO2 database is composed of more than 3000 unique subjects.
Results
An initial total of 28 540 individual pO2 values were recorded, yielding a mean of 75.5 mm Hg (standard deviation [SD]: 19.3 mm Hg). Six values had z scores of ≥ +9.53 (all other values having z scores of <4) indicating an extreme unlikelihood of these values being part of a normally distributed population. Given the magnitude of the corresponding pO2 values (≥259.5 mm Hg), it is believed that these values were incorrectly recorded, as it is physiologically improbable that such elevations would be due to medical interventions, such as oxygen therapy (eg, based on the assumptions of Sharma and Hashmi, 8 the calculated alveolar pO2 of an inspired air supply with 2 L of supplementary oxygen would be 137.2 mm Hg). One result had a z score of −3.73 which, while statistically possible within a normally distributed population, was considered physiologically highly unlikely given it equated to a pO2 value of 3.5 mm Hg with venous pO2 values typically being in the range of 30.0 to 39.8 mm Hg. 9 Accordingly, 28 533 qualifying values were included within the data set. Histograms of pO2 distributions by individual clinic site and overall are shown in Figure 1a and 1b, respectively.
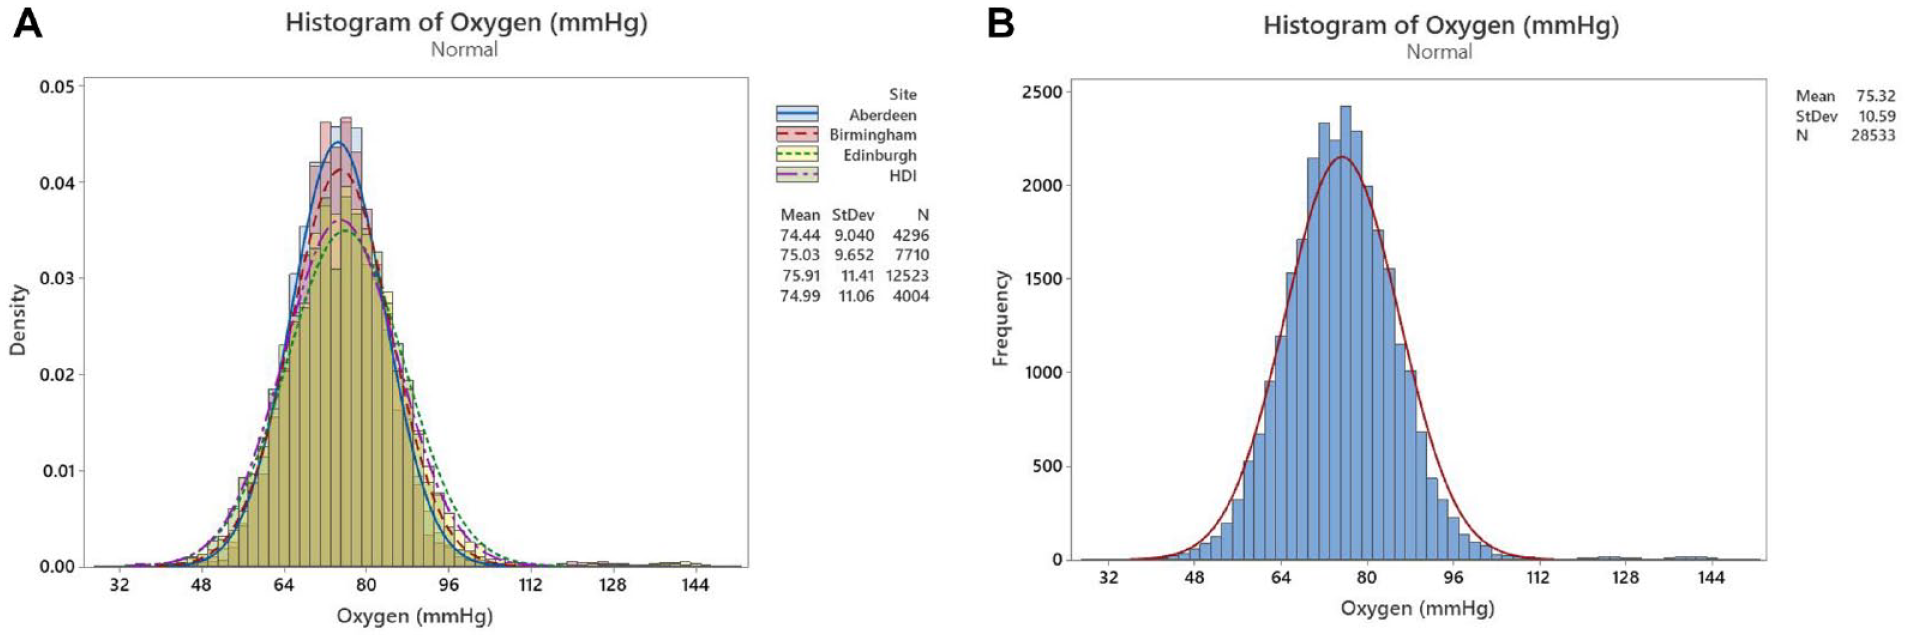
Histograms of fingertip capillary pO2 distributions within (a) each of the four clinic sites and (b) overall population.
Figure 1a records distribution by density, which facilitates distribution comparisons where different sample sizes exist such as is the case for the four clinic sites. Small differences in density distributions are evident. While there is the possibility of small inter-laboratory differences (eg, operator-to-operator and instrument-to-instrument differences), subject population factors were considered the main contributor. As the clinics were housed within hospital settings, it is possible that different patient target groups were treated with particular therapies, which may have introduced differences. Location may also have been a contributory factor, with local patient demographics and local socioeconomic factors influencing levels of overall local population health.
Figure 1b records the overall frequency of values within each pO2 grouping (as described on the x-axis), allowing an overall visualization of the full population distribution. The closest distribution fit found was that for normal distribution (for pO2 levels ≤~100 mm Hg; Figure 2). A population mean of 75.3 mm Hg (median: 75.1; SD: 10.6; pO2 range: 27.7-151.5 mm Hg) was recorded. Assuming normality, 99.7% and 99% of pO2 values were within ranges 43.9 to 106.7 and 48.0 to 102.6 mm Hg, respectively. Skewness of the distribution was calculated as +0.84 indicating a moderate distribution asymmetry, weighted toward higher pO2, while the kurtosis value of 4.42 indicated a greater proportion of values within the distribution tails than a true normal distribution.
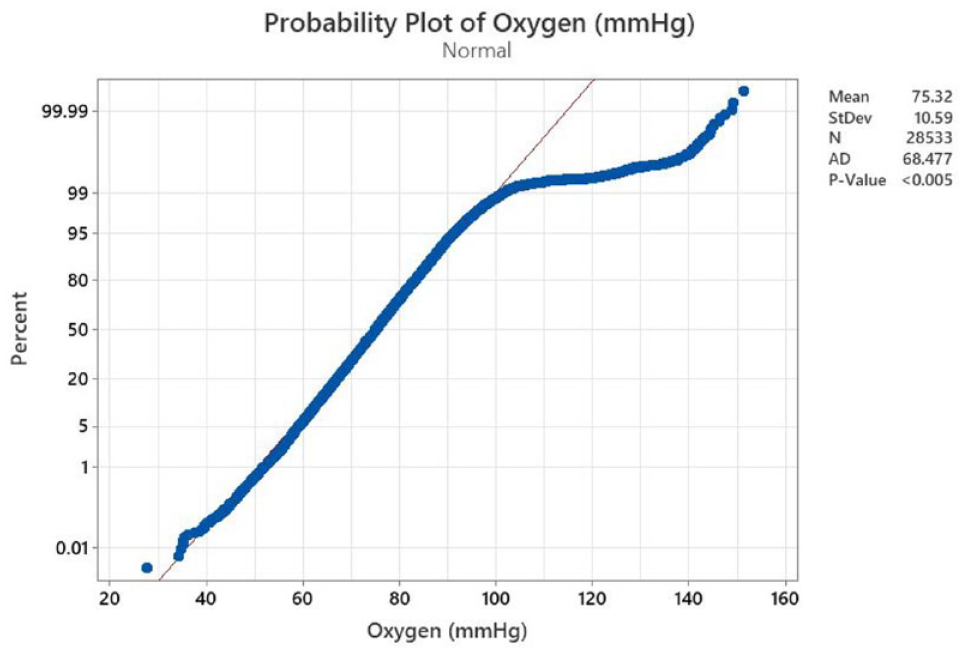
Probability plot for normality for the pO2 population dataset (n = 28 533).
Discussion
While many publications report capillary pO2 levels, few report unmanipulated fingertip capillary levels. Instead, focus is primarily upon methodologies that could potentially eliminate the use of arterial lines for blood draw, a painful process requiring intervention by trained practitioners. Consequently, most reports focus on “arterialized” samples in which attempts have been made to manipulate capillary pO2 levels to those consistent with arterial bloods, typically through local-site manipulation by topical application of a vasodilator and/or localized warming. Data from such studies are therefore not representative of pO2 levels in native, nonmanipulated capillary samples. 10
In addition, fingertip capillary blood pO2 levels may differ systemically from those from other capillary sources. A meta-analysis by Zavorsky et al, examining pO2 levels in earlobe and fingertip capillary samples, concluded that while earlobe samples were predictive of arterial pO2 levels, fingertip capillary samples were on average 11.5 mm Hg lower. 11 Only five of the 29 studies within the meta-analysis included fingertip samples (222 paired samples total), but these samples had first been subject to arterialization attempts.
Capillary, as opposed to arterial sampling is the preferred method of blood sample collection in healthy neonates and infants <12 months. Heel-pricking, with prior warming of the heel, is widely adopted to arterialize samples and is recommended by Clinical and Laboratory Standards Institute (CLSI) guidelines. 12 While numerous studies report pO2 distributions in these samples, in which pO2 levels are notably lower than in adult populations (Cousineau et al. 13 : mean pO2: 45.3 mm Hg; SD: 7.5 mm Hg; 2.5/97.5 percentiles: 32.8/61.2 mm Hg; n = 119; Desai et al. 14 : 44.4 mm Hg; SD: 9.1 mm Hg; range: 33-68 mm Hg; n = 25), there is little information regarding pO2 levels in nonarterialized heel-prick blood. 15 Neither is there information regarding comparative differences between heel-prick and fingertip/earlobe samples, irrespective of arterialization state, presumably due to these latter sample types being preferred in noninfant populations, coupled to ethical considerations regarding clinical studies in the very young.
As a further consideration pO2 in inspired air may vary from medical interventions such as supplemental oxygen administration or environmental factors such as reduced atmospheric pressure where a reduction in air partial pressure results in a direct reduction in blood pO2. There are little data regarding pO2 distributions (capillary or arterial), in high-altitude inhabitants, and no agreed definition of what constitutes a high altitude. This population is significant: Tremblay and Ainslie estimate that 500.3M people live at altitudes ≥1500 m. 16 There are some reports regarding pO2 levels in the arterial blood of climbers at extreme altitudes where, as expected, arterial pO2 levels are lower than the sea level equivalent (~50% of sea level pO2 levels at 5300 m).17,18 Medical device regulators, being aware of the potential risks posed by variable oxygen, require potentially susceptible devices to be appropriately assessed. For example, EN ISO15197:2015 requires the mean bias of a system at extremes of the claimed range to be within a given interval of the nominal (zero bias) condition with 95% confidence.
The most comprehensive report regarding pO2 distributions in nonmanipulated fingertip capillary blood found by the authors is by Freckmann et al., 19 who conducted a 110-subject study on a mainly diabetes population, with the purpose of raising awareness of variable pO2 levels on the performance of oxygen-sensitive glucose measurement systems designed for use with fingertip bloods. 2 A mean pO2 of 71.1 mm Hg (SD: ±6.9 mm Hg; range: 49-86 mm Hg) was reported, indicating a slightly lower pO2 mean and markedly lower SD than reported here in our larger data set. Recently, Kongstad et al 10 reported on a 62-patient study in which nonarterialized fingertip bloods from a chronic obstructive pulmonary disease population were determined, with a pO2 mean of 61.2 mm Hg (SD: 9.2 mm Hg; range: 37.1-79.5 mm Hg).
To conclude, there is an incomplete picture regarding pO2 distributions in nonarterialized fingertip capillary blood. The large data set reported here, obtained from a diabetes population, using a common methodological approach, may be of benefit as a reference source with utility in the design and development of capillary fingertip analyte measurement devices and in interpretation of data obtained.
Footnotes
Acknowledgements
The authors would like to thank Caitlin Sandilands and the NHS site staff at each of the UK clinics for study conduct.
Abbreviations
BGM, blood glucose monitor; pO2, oxygen partial pressure; SMBG, self-monitoring of blood glucose.
Declaration of Conflicting Interests
The author(s) declared the following potential conflicts of interest with respect to the research, authorship, and/or publication of this article: S.S., S.P., H.C., and M.G. are employees of LifeScan Scotland, Ltd.
Funding
The author(s) disclosed receipt of the following financial support for the research, authorship, and/or publication of this article: This study was funded by LifeScan Scotland Ltd.