
Abstract
Background:
Managing glycemia during and after exercise events in type 1 diabetes (T1D) is challenging since these events can have wide-ranging effects on glycemia depending on the event timing, type, intensity. To this end, advanced physical activity-informed technologies can be beneficial for improving glucose control.
Methods:
We propose a real-time physical activity detection and classification framework, which builds upon random forest models. This module automatically detects exercise sessions and predicts the activity type and intensity from tri-axial accelerometer, heart rate, and continuous glucose monitoring records.
Results:
Data from 19 adults with T1D who performed structured sessions of either aerobic, resistance, or high-intensity interval exercise at varying times of day were used to train and test this framework. The exercise onset and completion were both predicted within 1 minute with an average accuracy of 81% and 78%, respectively. Activity type and intensity were identified within 2.38 minutes and from the exercise onset. On participants assigned to the test set, the average accuracy for activity type and intensity classification was 74% and 73%, respectively, if exercise was announced. For unannounced exercise events, the classification accuracy was 65% for the activity type and 70% for its intensity.
Conclusions:
The proposed module showed high performance in detection and classification of exercise in real-time within a minute of exercise onset. Integration of this module into insulin therapy decisions can help facilitate glucose management around physical activity.
Introduction
Individuals with type 1 diabetes (T1D) require life-long insulin replacement and glycemic management for achieving targeted glucose levels (ie, 70-180 mg/dL). 1 To help enhance cardiovascular health, fitness, and potentially glycemic outcomes, regular physical activity and exercise (ie, planned and structured physical activity) 2 are widely recommended for individuals with T1D, with some specific tailoring of these activities depending on individual’s unique characteristics.3 -5 However, physical activity can pose considerable challenges as it can lead to dramatic fluctuations in glucose levels and heightened risk of hypoglycemia that prevents some individuals with T1D from exercising regularly because of their fear of hypoglycemia.6 -12
To overcome exercise-induced glucose imbalances, 12 advanced exercise-informed diabetes technologies are promising tools in facilitating treatment adjustment.13 -16 Precision of this adjustment would be affected by the available information regarding the time, duration, modality (ie, aerobic, resistance, mixed), and intensity (ie, light, moderate, vigorous) of the performed activity as these are the main activity characteristics that mediate the glucose outcomes during and following an exercise session.5,17,18 Automatic detection of the activity characteristics can remove the burden of manual recording from individuals as they may forget to announce spontaneous activity and/or planned exercise events or announce the activity late.
A combination of tri-axial accelerometers and heart rate monitors, in mobile and wearable sensing devices has enabled the successful detection of the exercise periods as well as the detection of different exercise modalities and intensities. 19 Several teams have performed exercise detection15,20 or classification of activity characteristics using acceleration and/or heart rate data,21,22 in addition to other available signals, such as the galvanic skin response,23,24 breathing rate, 25 and skin temperature. 24 As the glycemic impact of exercise may be mediated by its intensity, 5 using also glucose readings in an exercise classification algorithm have the potential to improve classification accuracy. In fact, in a previous work, 16 the authors detect exercise solely employing continuous glucose monitor (CGM) measurements. In summary, several works successfully addressed the detection of various subsets of exercise characteristics, that is, either the beginning and end or the type and intensity. Yet, to the best of our knowledge, there is no comprehensive module that detects exercise onset and completion as well as the activity type and intensity altogether.
The objective of this work is to develop a real-time physical activity detection and classification framework to (1) identify the onset and completion of exercise within 5 minutes, that is, before any significant change in glucose level occurred in people with T1D, (2) classify the type of exercise as aerobic, resistance or high-intensity interval training (HIIT) exercise, and (3) the intensity level of the exercise within 5 minutes during the ongoing activity once exercise is detected. The proposed algorithm utilizes heart rate and tri-axial accelerometer signals obtained from a wearable activity tracker, along with glucose levels as measured by CGM. The methods proposed in this article uses random forests described elsewhere, which have performed well in classifying physical activity.22,26 -31
Methods
Data Collection
The dataset includes 19 adult participants with T1D were either enrolled at clinic sites or remotely. 32 The Jaeb Center for Health Research Institutional Review Board approved the studies (registration numbers: IRB00000766 and IRB00000766 reviewed on November 13, 2017, and September 7, 2018, respectively) and informed consent was obtained from each participant. A summary of participant characteristics is provided in Table 1. During a 4-week data collection period, participants were randomly assigned to complete one of the following pre-recorded study exercise videos twice weekly: (1) aerobic training, (2) HIIT, or (3) resistance training. 5 After each session, participants graded their perceived effort on a scale from 1 to 3, where 1 denoted light, 2 moderate, and 3 vigorous. 32 Participants used either personal CGM or a blinded CGM (Dexcom G4 or G5 [San Diego, CA]) as per their choice, as well as a wearable Verily Study Watch [South San Francisco, CA]) that captured wrist-based heart rate and accelerometry data. 32 Participants used a study-developed smartphone application (T1Dexi smart phone app) to enter all of their study-assigned structured exercise, as well as other information, such as meal content or insulin use. 32 Details on the design of the study video exercise sessions are reported in the Supplemental Material. The accelerometers measured raw acceleration along three axes at a sample rate of 32 Hz. Heart rate in beats per minute (bpm) was recorded with a sample rate of 10 seconds, while the CGM devices had a sampling period of 5 minutes. Participants were also required to wear Polar chest band during study-related exercise. In addition, the collected data included samples from sedentary and post-exercise conditions. Post-exercise period starts at the end of an exercise session and can last up to 24 hours if no other sessions are held within this period. If another exercise session is announced or detected within the 24-hour period, the post-exercise period ends with the start of the new session. Sedentary period was considered as any 24-hour window without an exercise session that followed a post-exercise period. 32 For the purpose of this study, analyzable study exercise sessions were determined as sessions that had available CGM, heart rate, and accelerometry readings. Of 268 study exercise sessions, 130 were included in these analyses. The data were split between training, validation, and testing on a participant basis: 60% of the participants were included in the training, 20% of the remaining participants were part of the validation dataset, and the remaining 20% of the participants were used for the testing. As such, the training, validation, and testing datasets were mutually exclusive and a detailed breakdown is reported in Table 2, including the number of participants and the number of exercise sessions per class. To achieve a model with good generalization capability, the random forest model hyper-parameters were optimized: limiting the maximum depth of the decision tree can enable the tree to generalize better to testing data, although this will lead to reduced accuracy. Additional details are reported in the Supplemental Material.
Participant Characteristics (N = 19).
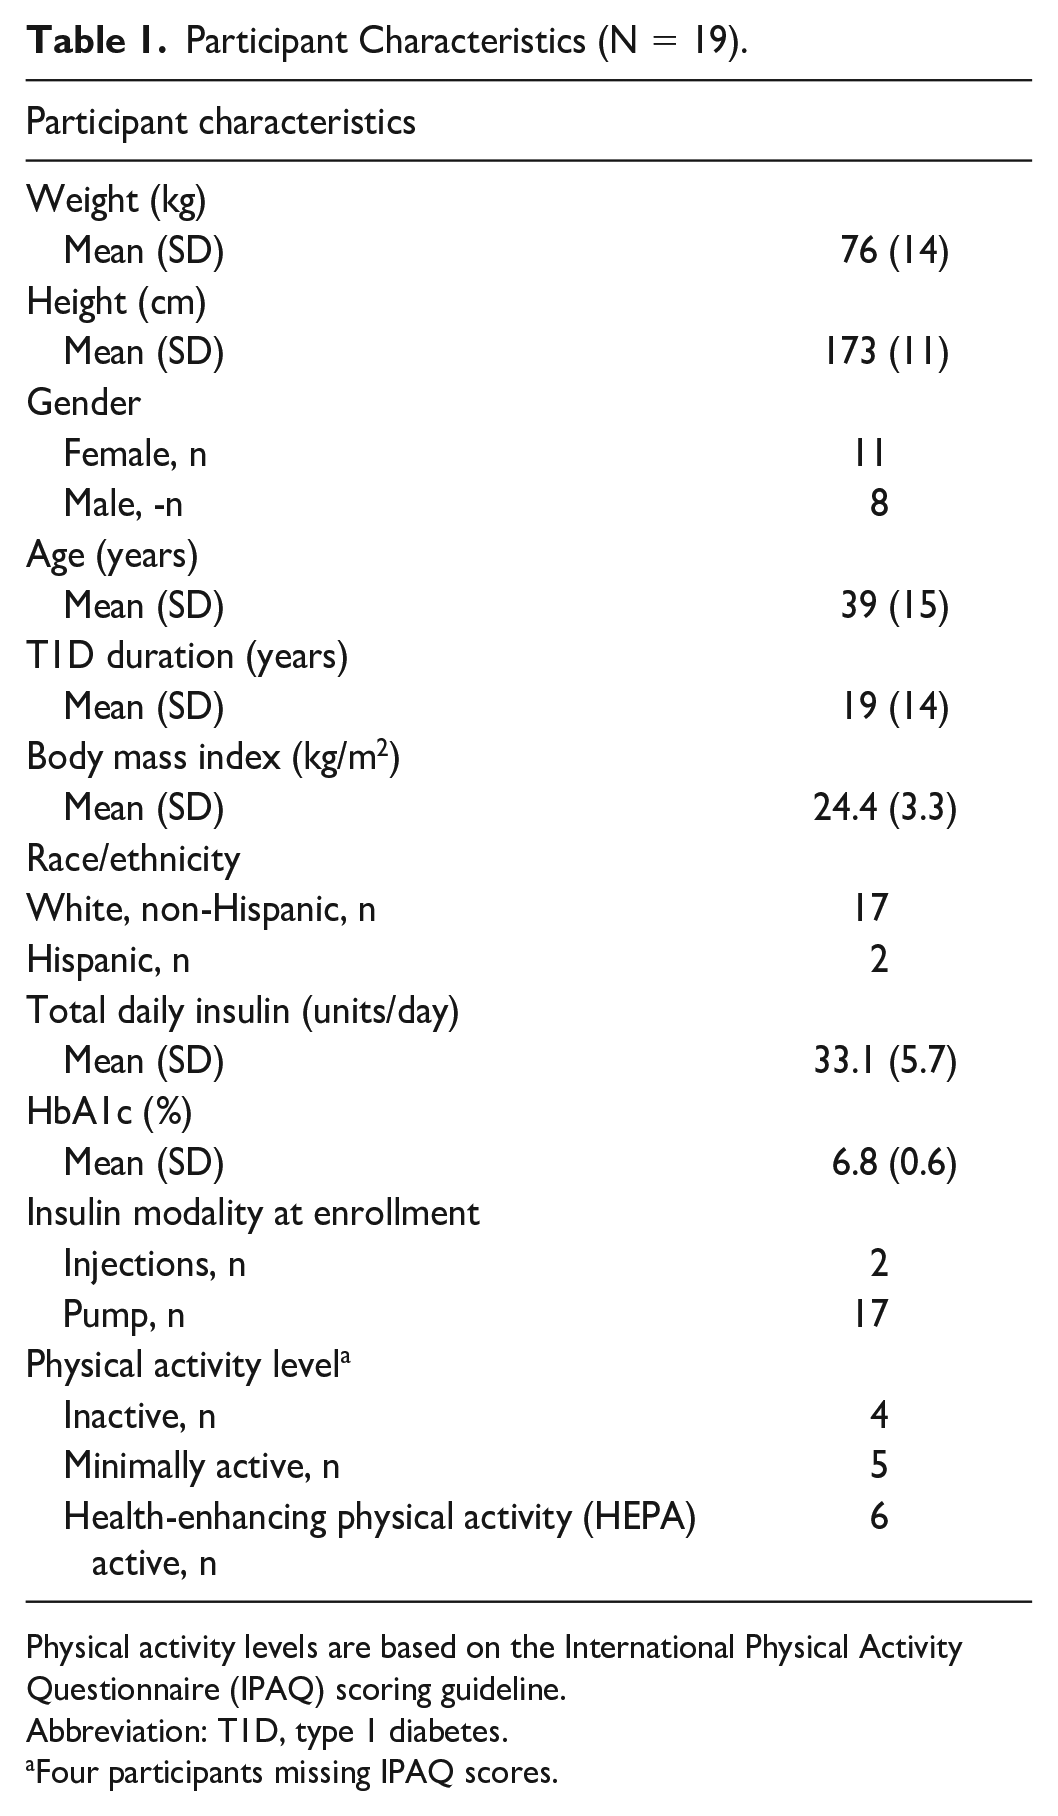
Physical activity levels are based on the International Physical Activity Questionnaire (IPAQ) scoring guideline.
Abbreviation: T1D, type 1 diabetes.
Four participants missing IPAQ scores.
Training, Validation, and Testing Datasets Are Reported Per Class, Including the Number of Participants, and the Number of Exercise Sessions.
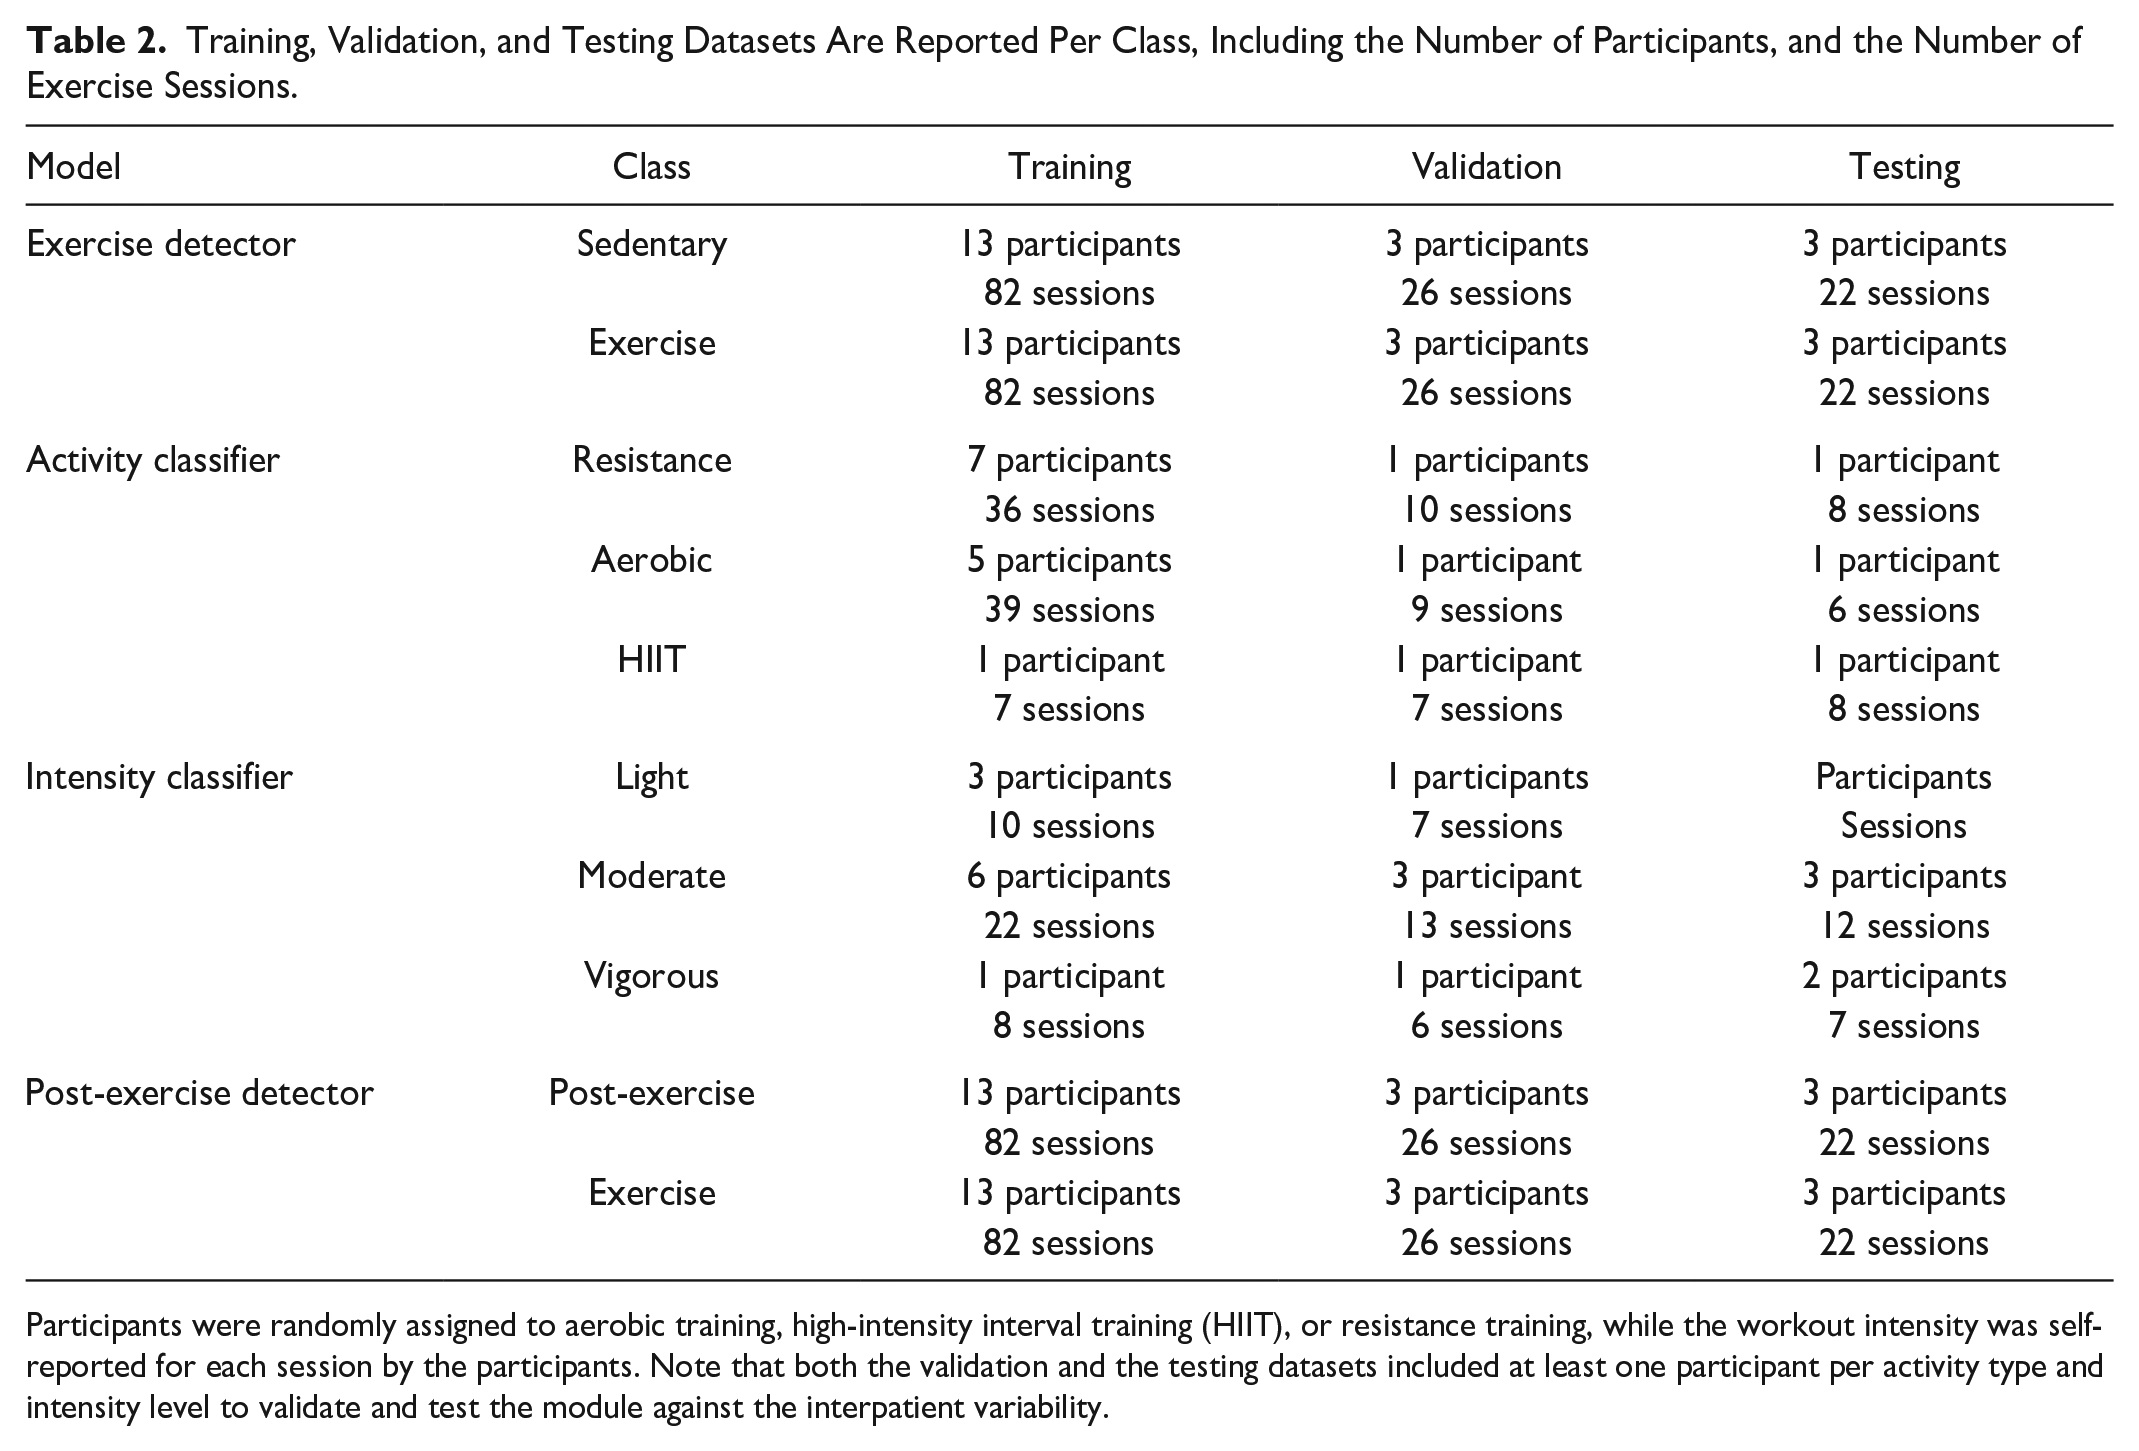
Participants were randomly assigned to aerobic training, high-intensity interval training (HIIT), or resistance training, while the workout intensity was self-reported for each session by the participants. Note that both the validation and the testing datasets included at least one participant per activity type and intensity level to validate and test the module against the interpatient variability.
Data Processing
The accelerometer data were averaged into segments of 1-second non-overlapping windows. To remove the high-frequency noise component, a finite impulse response low-pass filter, with an approximate cutoff frequency of 0.05 Hz, was applied. The low-pass filtered accelerometer data were used to derive additional interpretable time-domain features on a point-by-point basis. The complete list of the features is reported in the Supplemental Material.
The set of features includes not only the accelerometry values, but also the CGM values and the heart rate signal. To exploit the high sampling rate of the acceleration data, the detection of the exercise session was performed every second independently. In case of the heart rate and CGM signals, a zero-order hold was applied to keep the signals constant until a new measurement was available. The classification of the activity type can be also performed every second, as this is an appropriate unit for physical activity types that has been used in previous studies.33,34 As for the intensity, the classification was performed every 10 seconds relying on the availability of heart rate measurements, as the exercise intensity is strongly correlated with the heart rate. 3 As it can be noted from Table 2, the type and intensity dataset suffer from class imbalance: 40% of participants were pre-assigned to aerobic, 40% to resistance and only 20% to HIIT, while 30 % of sessions were annotated as light intensity, 50% as moderate, and 20% as vigorous. To increase the diversity of the training set in case of HIIT activity, as well as light and vigorous intensity data, data augmentation techniques were applied in the training phase. 35
Activity Detection and Classification Module
A separate random forest model is trained for (1) detecting exercise, (2) detecting post-exercise recovery state, (3) the type of exercise, and (4) the intensity of exercise leading to a total of four random forest models as shown in Figure 1. Details on the random forest classifier modeling approach are reported in the Supplemental Material.
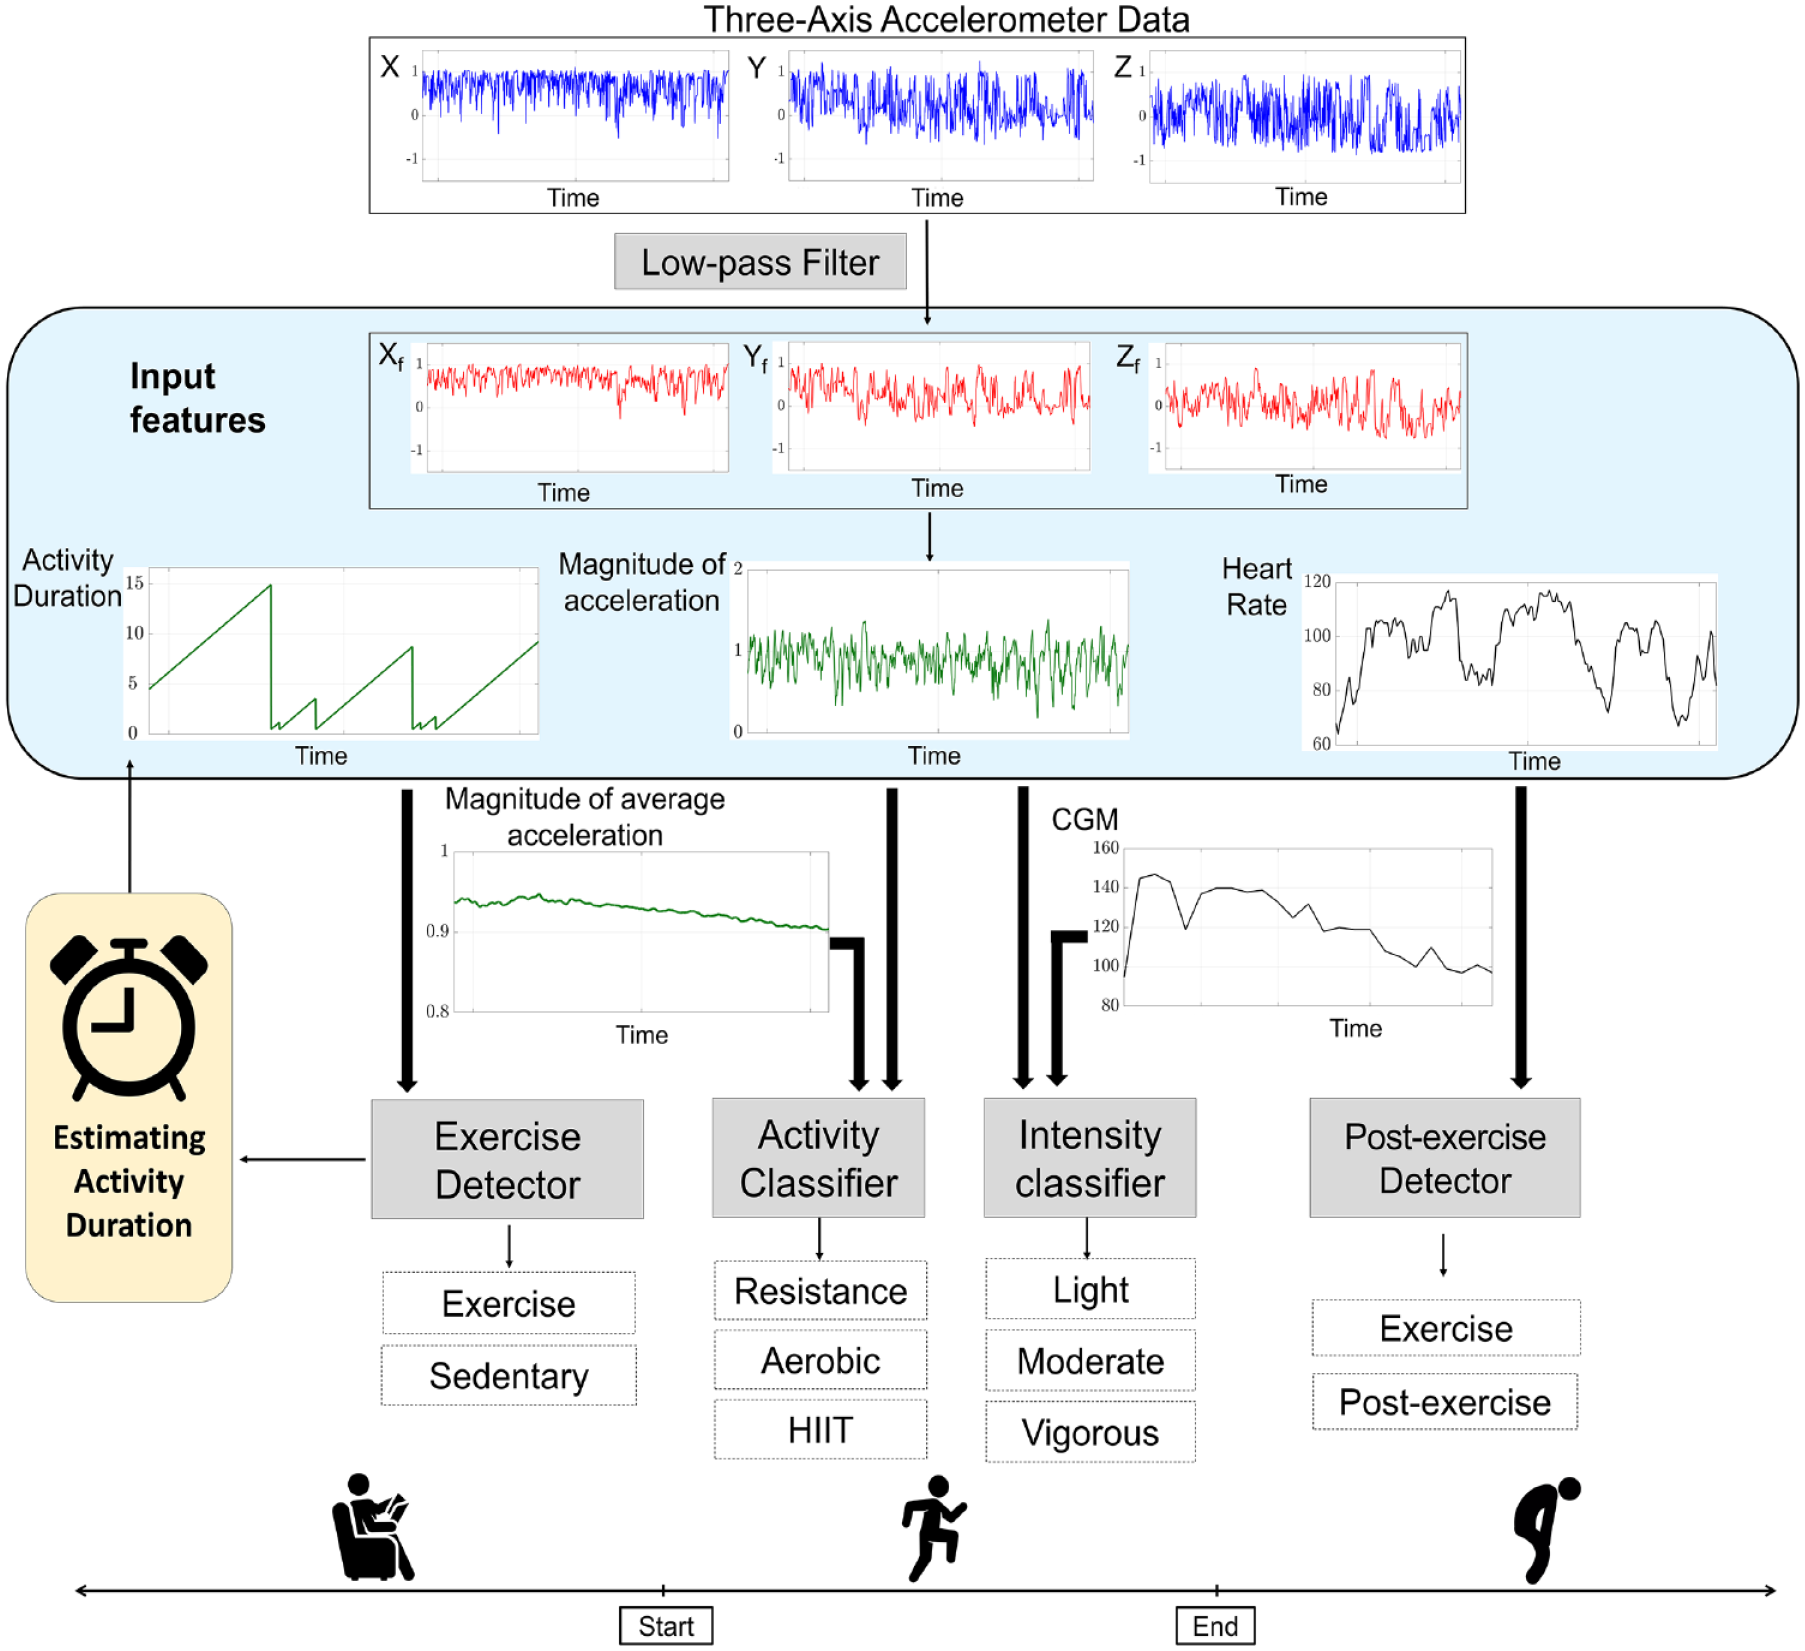
A schematic diagram showing the activity detection and exercise classification. Raw tri-axial accelerometer signals are reported in blue, filtered tri-axial accelerometer signals are reported in red, signals derived from the tri-axial accelerometer data are reported in dark green, while signals with sample times different than the accelerometer signals (1 second) are reported in black. The blue box contains the set of the input features. The exercise detector is also involved in estimating the activity duration. When the detector output switches from “sedentary” to “exercise” and vice versa, a counter is reset and then incremented until the next switch. To avoid false-positive or false-negative events, the commutation from “sedentary” to “exercise” state, and vice versa, is activated when the counter exceeds a minimum number of same-class predictions, which is set equal to 30 seconds.
The exercise and post-exercise detectors each output a probability between 0 (sedentary) and 1 (exercise) at every second. When a workout is detected, the output of the activity classifier predicts the activity type during the second, discriminating between aerobic, resistance and HIIT, while the intensity classifier determines the corresponding intensity level (ie, light, moderate, and vigorous intensity). The exercise detector is also involved in estimating the activity duration, which is unknown, however, relevant to inform the insulin therapy. 5 When the detector output switches from “sedentary” to “exercise” and vice versa, a counter is reset and then incremented until the next switch. However, fast movements in a sedentary condition may result into a misclassification error, such as the individual getting up from a chair. These movements may cause a dangerous fluctuation in the detection over time leading to many false-positive or -negative events. To avoid this kind of classification error, the commutation from “sedentary” to “exercise” state, and vice versa, is activated only when the counter exceeds a minimum number of same-class predictions, that is, the detector predicts the same class at least N = 30 times where 30 seconds is selected as a part of the design decision. The estimated activity duration was used as an input for the type and intensity classifiers.
Performance Metrics
Performances of the detection and classification framework were assessed against participant annotated time, duration, type, and intensity of the activity. To overcome potential inaccuracies due to self-reporting, we verified whether the self-reported starting and ending times coincided with the times participants wore the Polar chest band, since they specifically wore the band when they started to exercise. In addition, given that the intensity is being compared with the participants’ self-reported categories, a preliminary analysis was performed to verify the data consistency. The accuracy was used to evaluate the predictive capabilities of the proposed models on the testing dataset, while persistency of accuracy over time was evaluated to assess how fast the models accurately captured the activity characteristics. After detecting the exercise onset, the required time to correctly classify the activity type and intensity is determined when the accuracy over time becomes permanently higher than 50%. Performances of the models were assessed in two different scenarios that mimic real-life conditions keeping in mind the future aim to integrate the proposed module into either an automated insulin delivery (AID) system or a decision support system. The first scenario simulates the case when the individual announces the upcoming exercise. This condition implies that the starting and ending time of the activity are known, that can be translated into the fact that there is no need to estimate the activity duration, which is an input for the classification models. The second scenario simulates the occurrence of an unannounced exercise, that is, the starting and ending times of the activity are unknown. This scenario requires estimating the duration of the activity, which introduces uncertainty to the input data. To evaluate this scenario, six to eight 4-hour data portions per participant were selected from the testing dataset: each portion includes a sedentary period, a study video exercise session followed by a post-exercise phase. Balanced accuracy (BA) was also used in the latter scenario to provide a more complete and informative response. The BA spans from 0% and 100%, and is computed as follows:
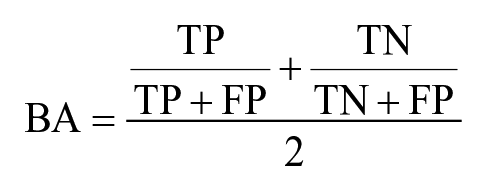
where TP, FP, TN represent the true positive, false positive, and true negative, respectively. In addition, the false-positive and -negative exercise detection events are reported to show how often the algorithm would falsely commute from “no exercise” to “exercise” state, and vice versa.
Results
According to the Gini index, 36 which is an estimate of how important an individual feature is for estimating the value of the target variable in the random forest, the feature with the highest score is always the heart rate. The CGM and the vector magnitude of the average acceleration were ranked second in the feature importance for the intensity and type classifiers, respectively, while the activity duration has the second highest score for both detectors. The features that got non-zero importance are listed in Table 3. 36
The Set of Input Features Ordered Based on the Gini Importance Index for Each Model, Starting With the Most Important From the Top and Continuing in a Decreasing Order of Importance With the Last One Having the Smallest Score, that is, the Least Important.
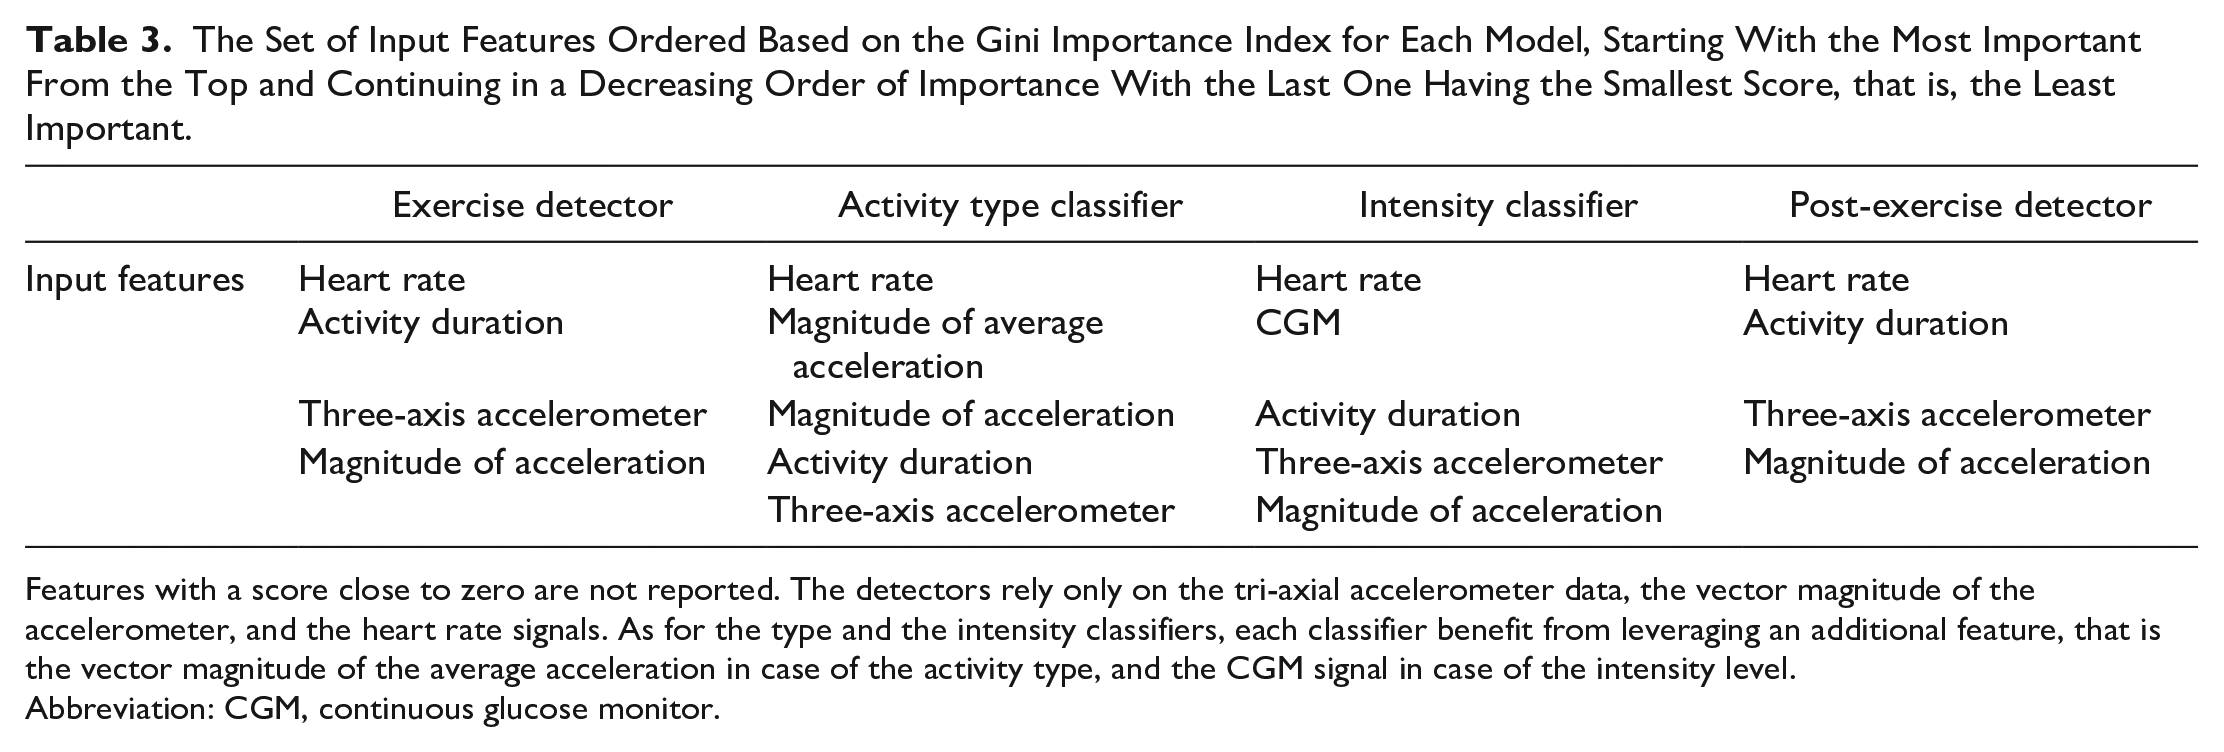
Features with a score close to zero are not reported. The detectors rely only on the tri-axial accelerometer data, the vector magnitude of the accelerometer, and the heart rate signals. As for the type and the intensity classifiers, each classifier benefit from leveraging an additional feature, that is the vector magnitude of the average acceleration in case of the activity type, and the CGM signal in case of the intensity level.
Abbreviation: CGM, continuous glucose monitor.
Performance of the Module
The testing dataset includes at least one participant per class who performed at least six activity sessions within a month. Model accuracy (%) was computed on the testing dataset over the individual-specific activities. Results are reported in Tables 4 and 5 per activity type and intensity. Table 4 reports the achieved accuracy per combination of activity type and intensity. The detection times per combination of activity type and intensity are reported in Table 5 together with the annotated activity type and intensity. The accuracy and time required for activity type and intensity detection are reported for both scenarios, that is, announced and unannounced exercise, while the accuracy and detection times of the exercise onset and completion detection algorithms are reported only for the latter. In the case of vigorous intensity, when the activity type was either HIIT or aerobic, we see that a faster determination of the activity type and intensity can lead to an increase in performance in case of unannounced exercise when comparing with the announced scenario (Table 5). In case of announced exercise, average accuracy per activity type and intensity is shown in Figure 2a, while average accuracy per type and intensity is reported in Figure 2b, in case of automatic detection of the onset and completion of the exercise. The exercise and post-exercise detection performances are also shown in Figure 2b. On average, the activity onset was identified in 2.1 minutes for resistance, 1.6 for aerobic, and 1.1 for HIIT, while activity completion was detected in 4.2 minutes for resistance, 2.5 for aerobic, and 2.5 for HIIT. The exercise and post-exercise detection in case of a resistance training is challenging because the heart rate increases modestly after performing a resistance exercise event, particularly when a Valsalva maneuver is done, while a faster detection can be achieved in case of aerobic and HIIT since the rise in heart rate is more immediate. The classifier can detect the specific activity behavior in 3.2 minutes for resistance, 4.2 for aerobic, and 2.0 for HIIT. Resistance patterns can be mistaken for a neutral activity, while aerobic activity is preceded by a warm-up that can be mistaken for resistance pattern. HIIT activity can be discriminated in a shorter time due to the bursting nature that characterizes this type of training. Light-intensity level can be detected in 30 seconds, while 1 minute is required for more intense activity. This result can be related to the fact that the heart rate and exercise intensity have a linear relationship and the heart rate needs some time to get elevated. The exercise and the post-exercise detectors can determine whether or not an exercise session can be detected with a BA of 0.70 and 0.71 at the population levels, as shown in Table 6. Table 6 reports similar average BA results for different activity types implying that the detector shows consistent performance regardless the activity type. Moreover, the detectors falsely labeled an exercise event only twice out of the activity period on average, while they wrongly detected an occurrence of “no exercise” during an exercise session only once on average, as reported in Table 6. Interestingly, the false-negative events (ie, failing to detect an exercise) are less on average than the false-positive events (ie, wrongly detecting as exercise, as shown in Table 6. This is an acceptable trade-off for the designed module, as a false-negative event may pose higher risk as the required adjustment in insulin therapy would not be made.
Mean and Standard Deviation of the Accuracy (%) Together With the Annotated Activity Type and Intensity.
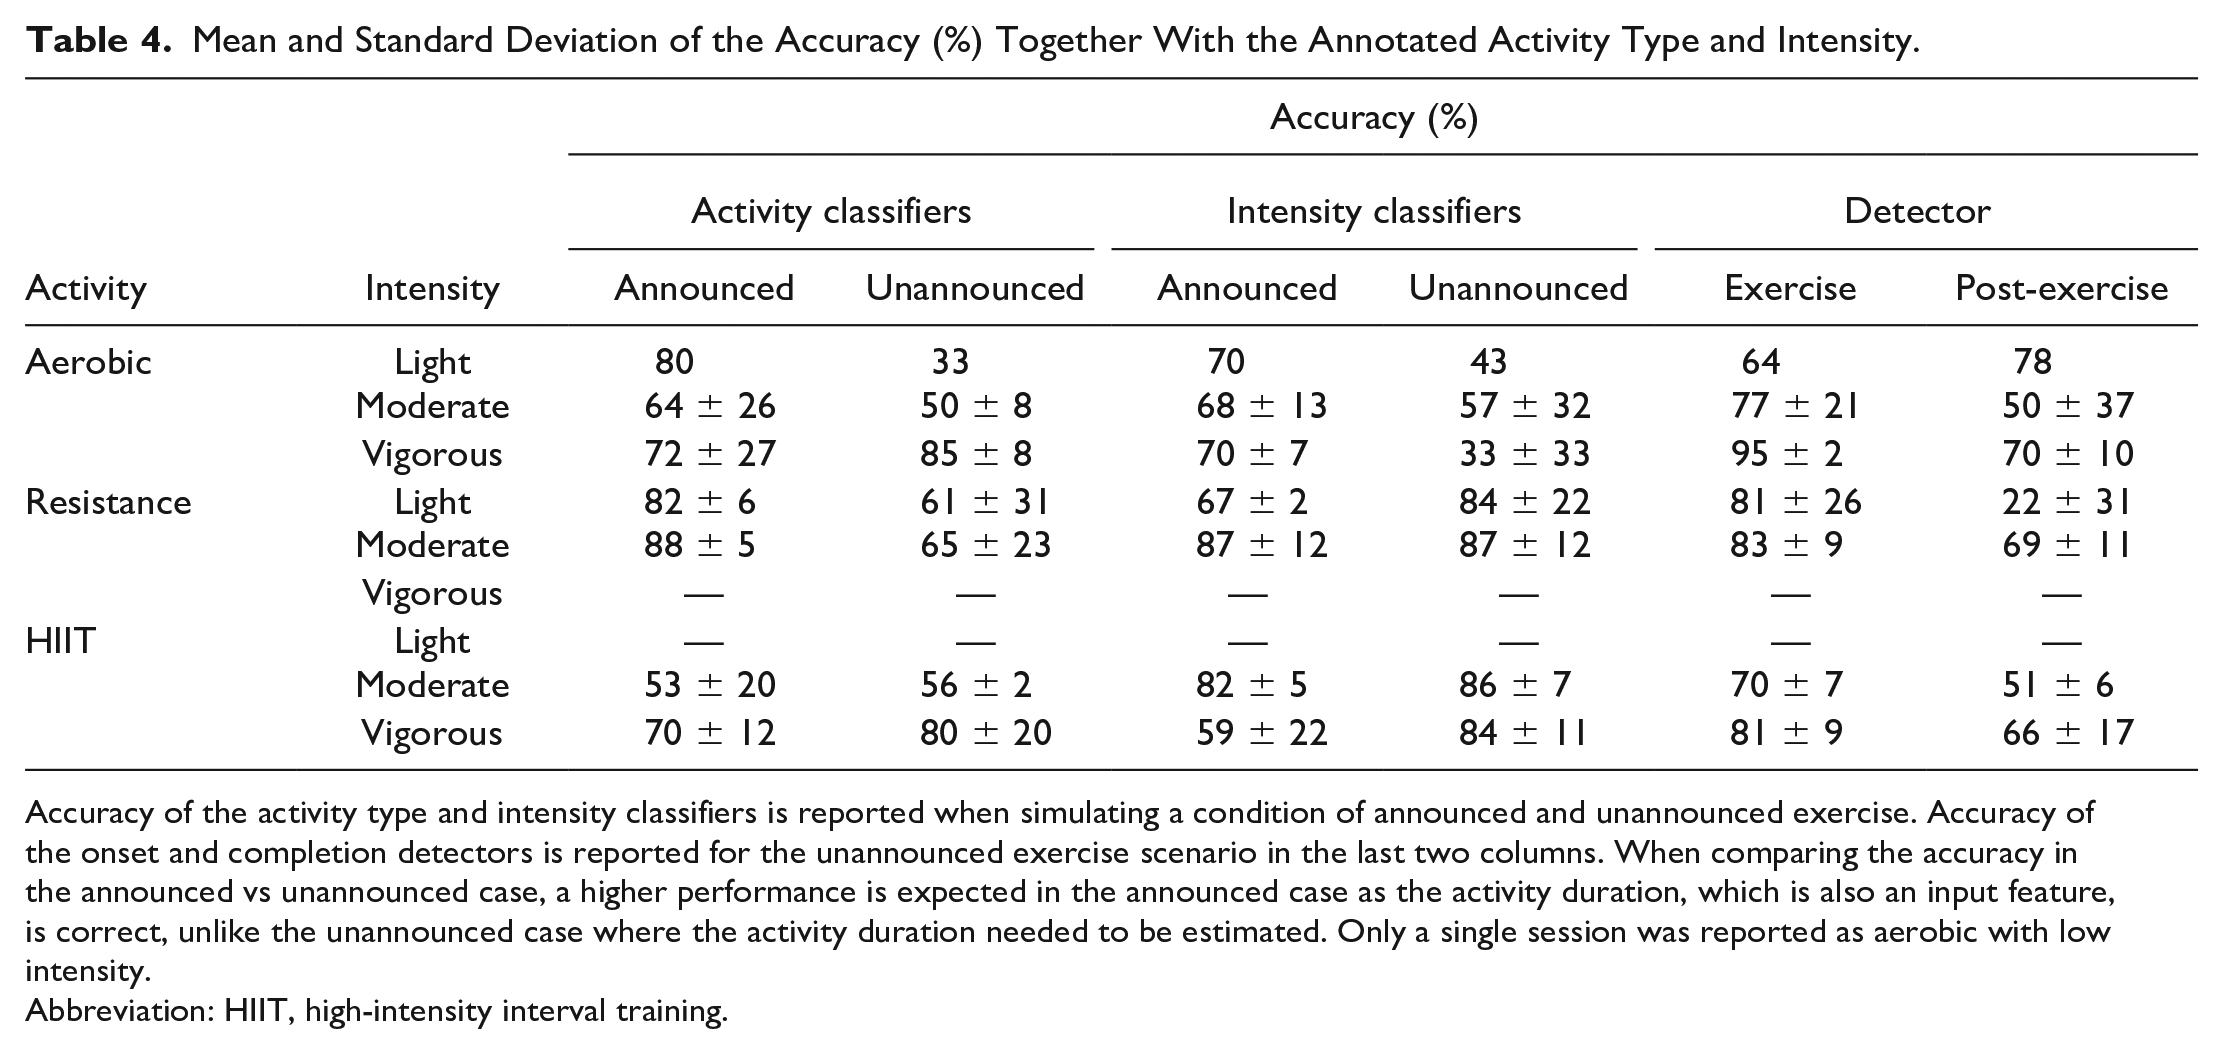
Accuracy of the activity type and intensity classifiers is reported when simulating a condition of announced and unannounced exercise. Accuracy of the onset and completion detectors is reported for the unannounced exercise scenario in the last two columns. When comparing the accuracy in the announced vs unannounced case, a higher performance is expected in the announced case as the activity duration, which is also an input feature, is correct, unlike the unannounced case where the activity duration needed to be estimated. Only a single session was reported as aerobic with low intensity.
Abbreviation: HIIT, high-intensity interval training.
Mean and Standard Deviation of the Detection Time (Minute) Together With the Annotated Activity Type and Intensity.
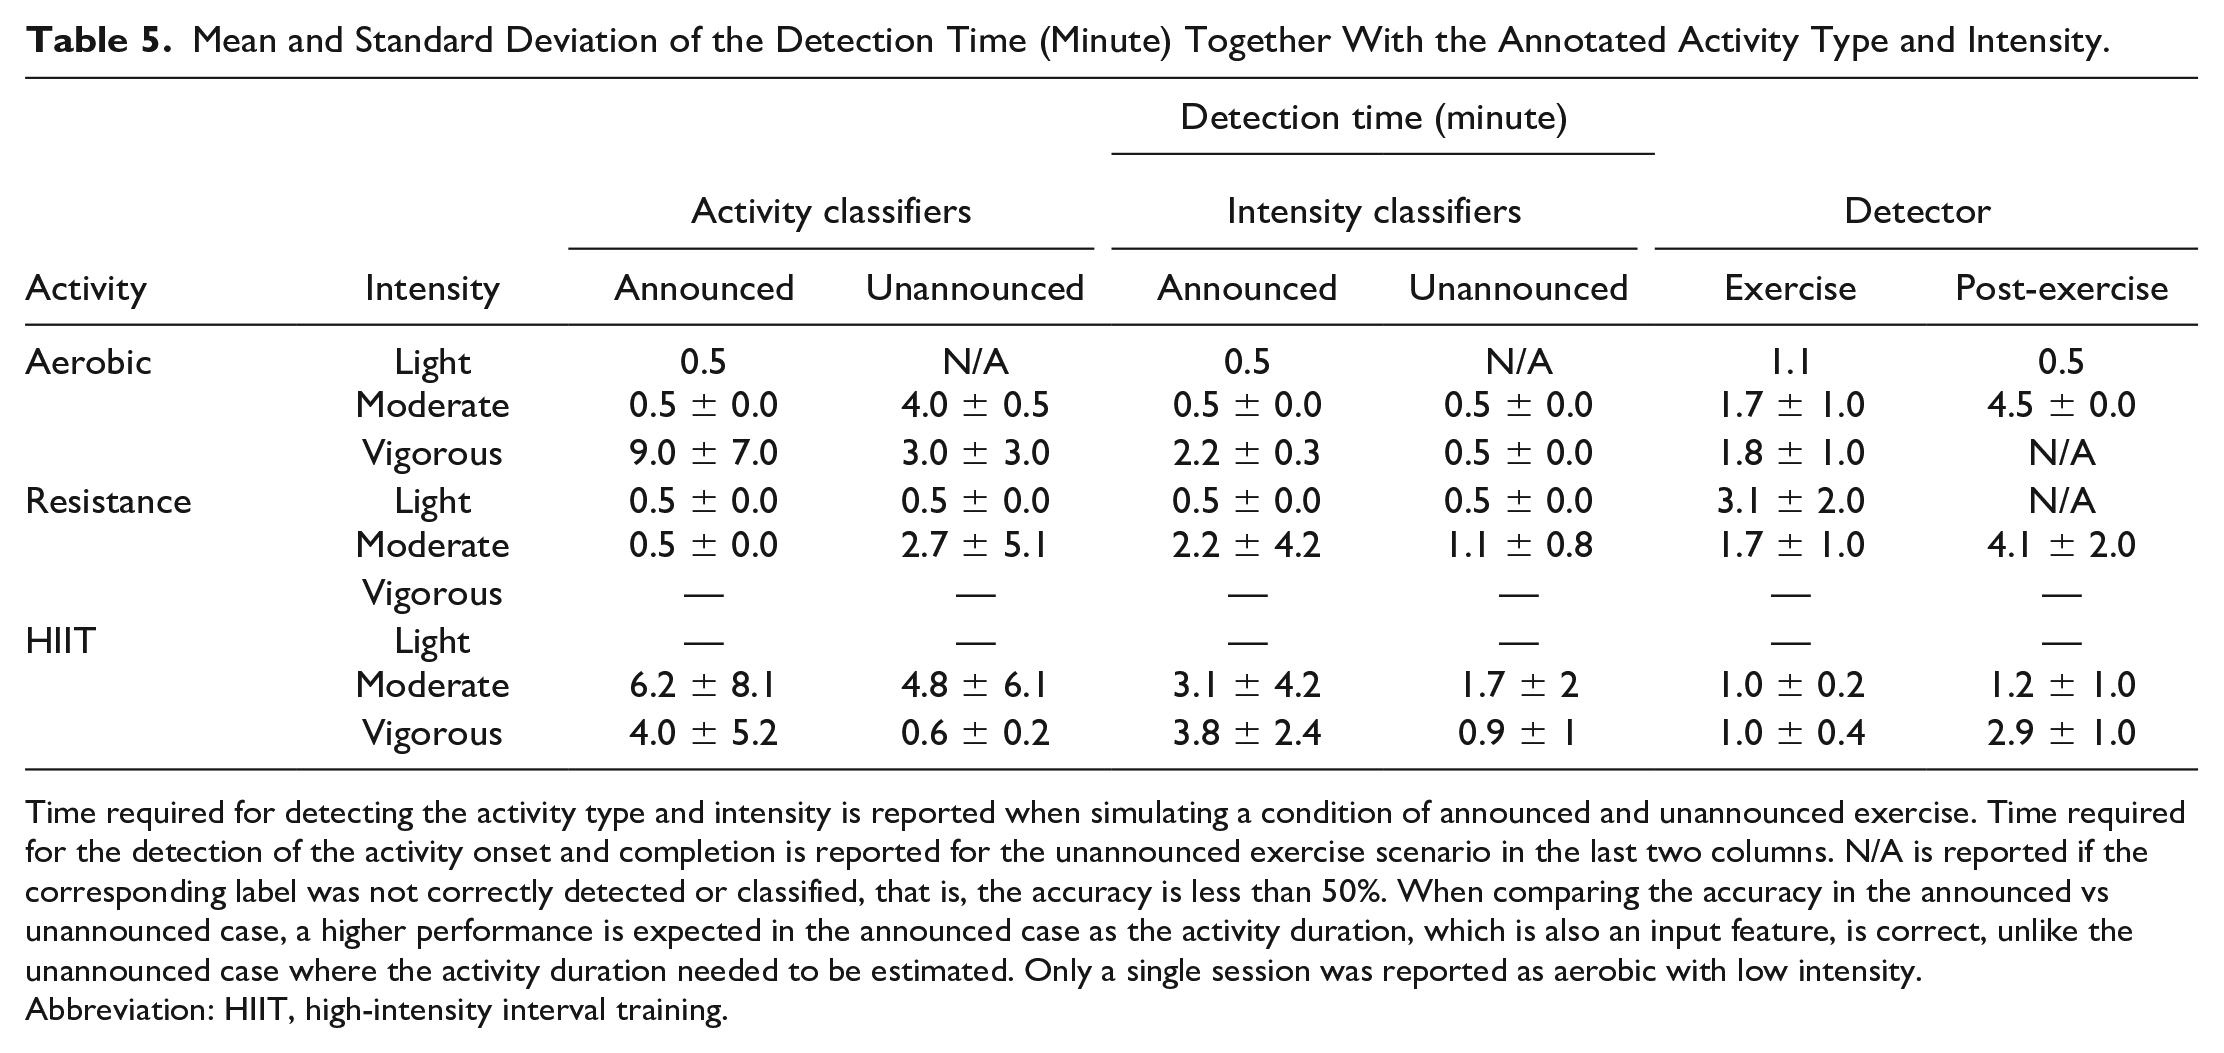
Time required for detecting the activity type and intensity is reported when simulating a condition of announced and unannounced exercise. Time required for the detection of the activity onset and completion is reported for the unannounced exercise scenario in the last two columns. N/A is reported if the corresponding label was not correctly detected or classified, that is, the accuracy is less than 50%. When comparing the accuracy in the announced vs unannounced case, a higher performance is expected in the announced case as the activity duration, which is also an input feature, is correct, unlike the unannounced case where the activity duration needed to be estimated. Only a single session was reported as aerobic with low intensity.
Abbreviation: HIIT, high-intensity interval training.
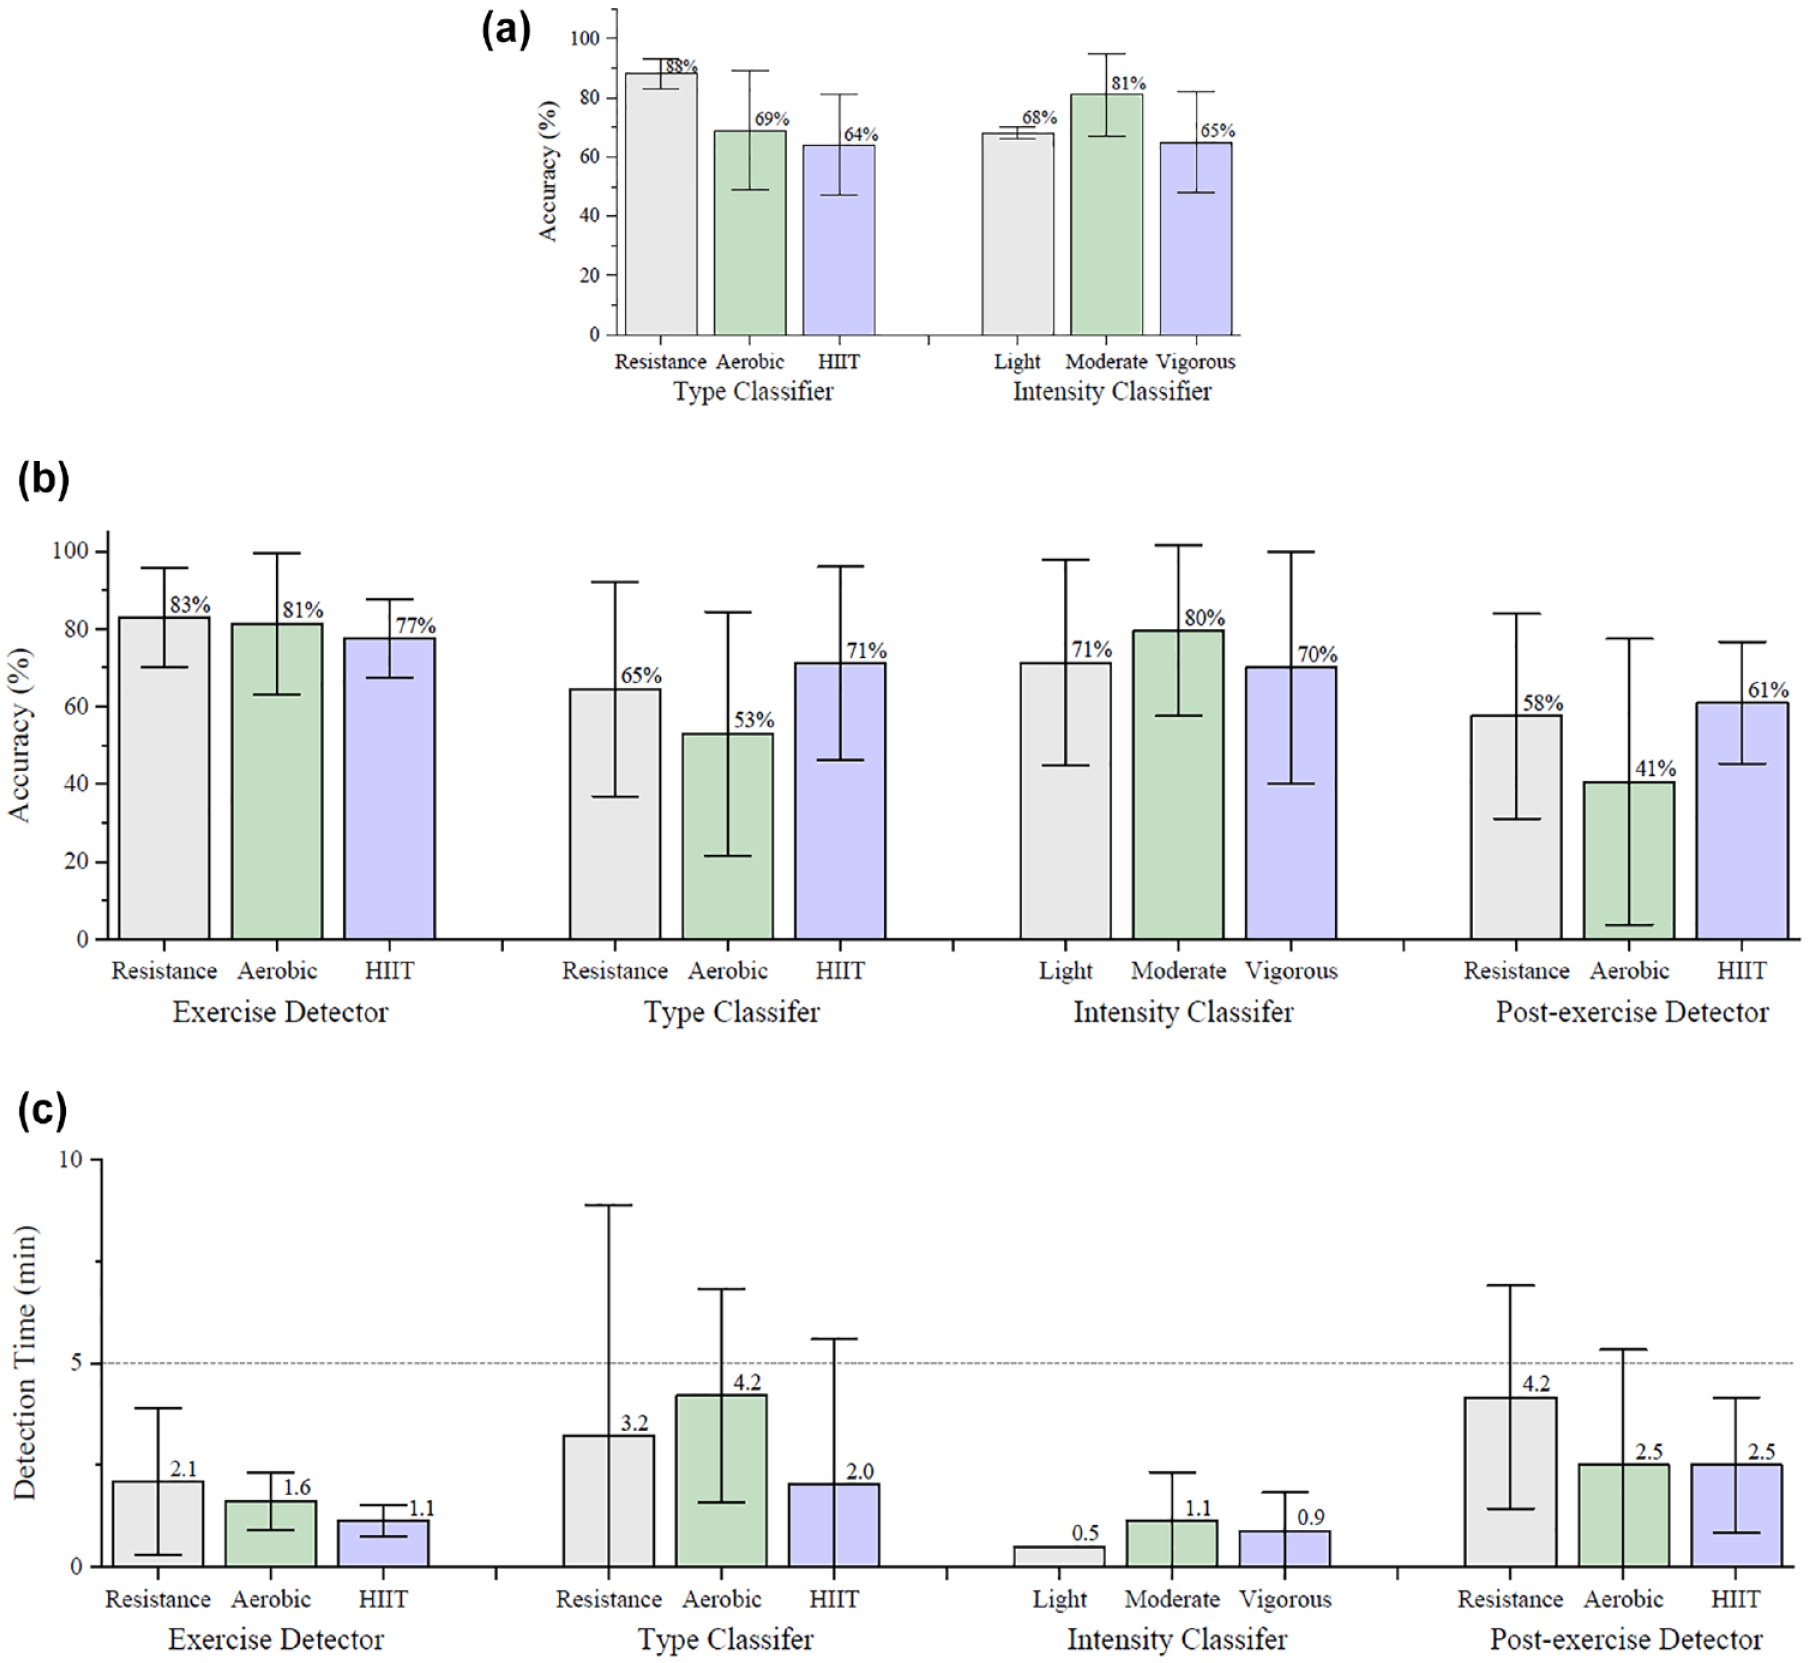
Evaluation of accuracy (%) and detection times (minutes) across the population. Bar plot of the mean values and error bar in a given class are included. Mean accuracy of the activity type and intensity classifiers are reported when simulating a condition of announced (a) and unannounced exercise (b). Mean accuracy of the exercise and post-exercise detectors is reported for the unannounced exercise scenario (b). Average time required for the detection of the activity onset and completion, as well as average time required for activity type and intensity detection is reported when simulating the condition of an unannounced exercise (c).
Mean and Standard Deviation of the Balanced Accuracy, False-Positive (FP) and False-Negative (FN) Exercise Detection Events Per Activity Type and Intensity, as Well as Population Level.
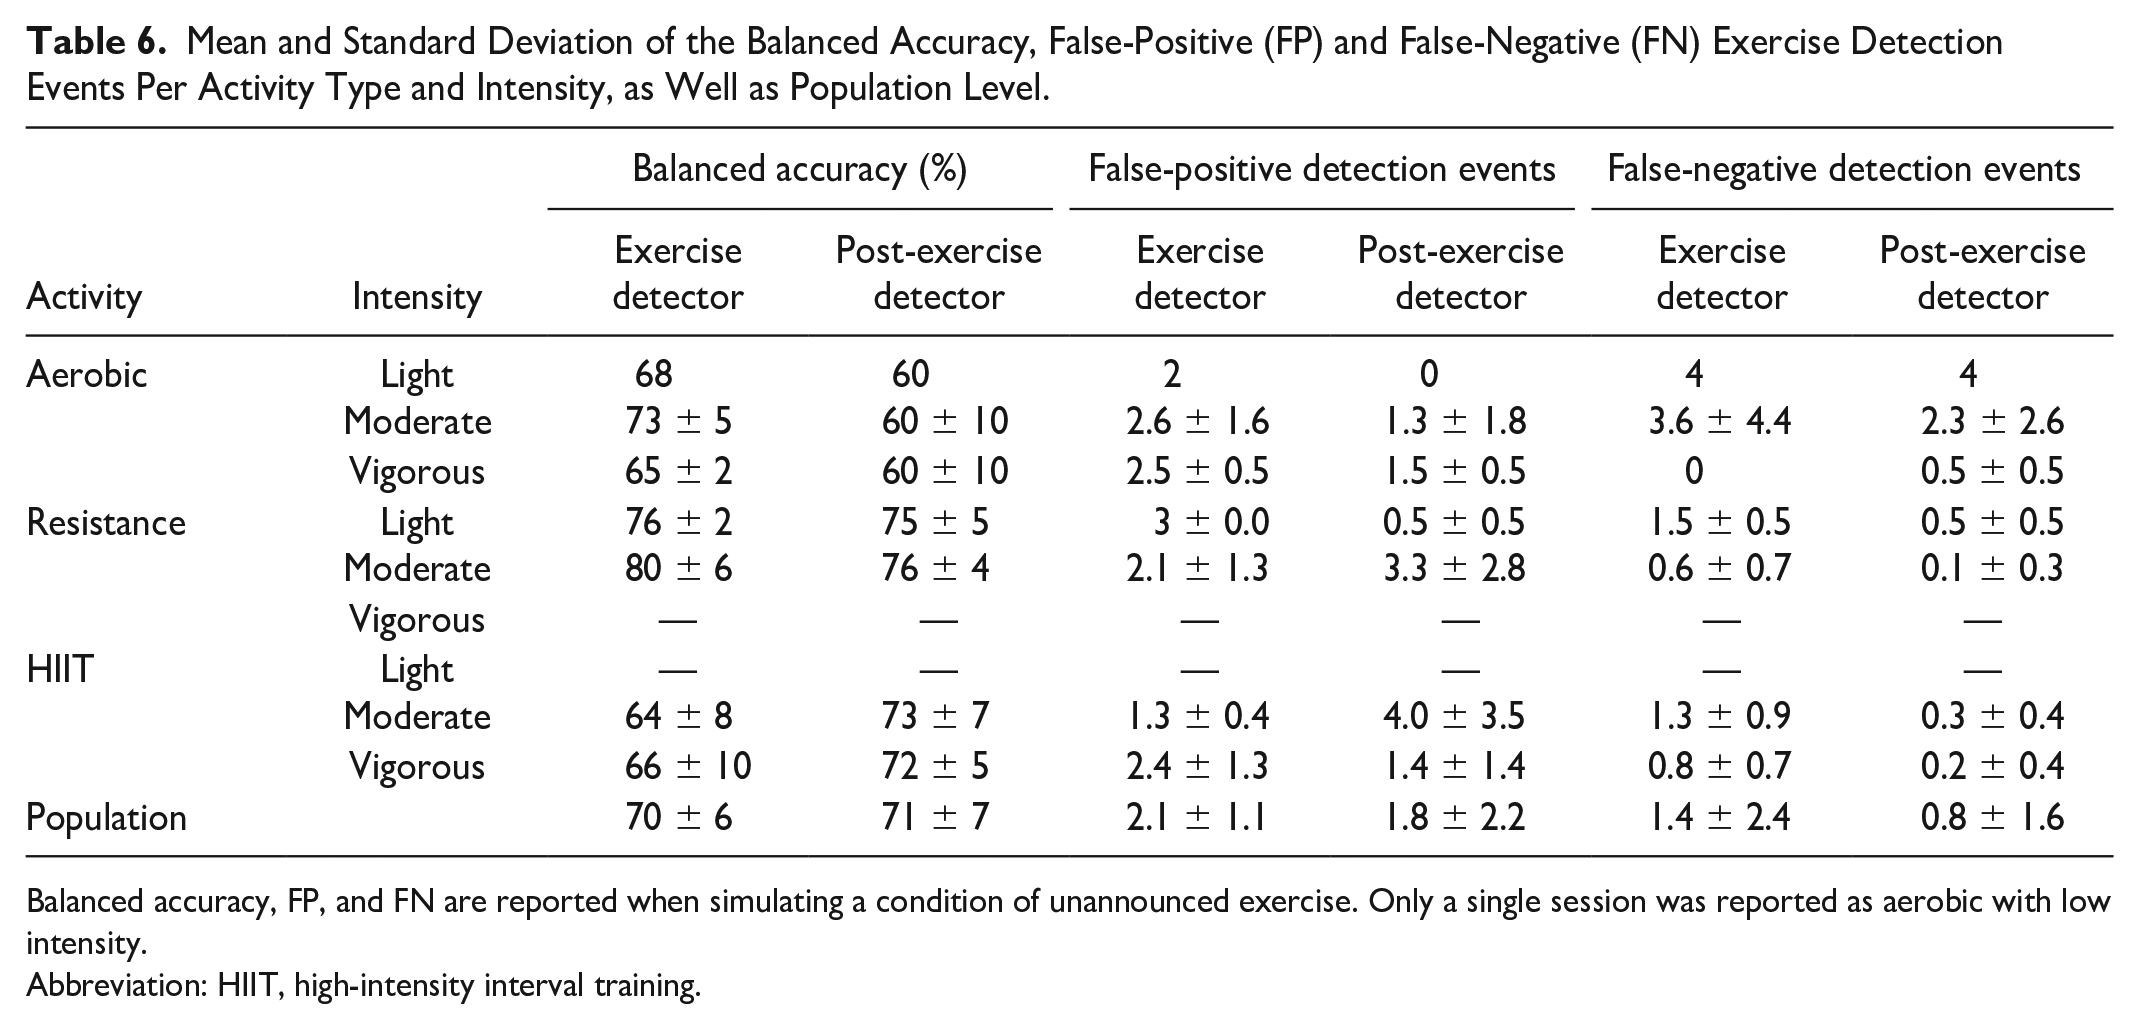
Balanced accuracy, FP, and FN are reported when simulating a condition of unannounced exercise. Only a single session was reported as aerobic with low intensity.
Abbreviation: HIIT, high-intensity interval training.
Classification Accuracy Versus Time During an Exercise Session
To augment a current AID or a decision support system with an exercise detector and classifier, so that, it can adapt insulin infusion accordingly, it is beneficial to understand how the performance of the module evolves throughout an exercise session. To understand how probable a certain class is over a time period, the mean and the standard deviation of how many samples are correctly classified versus time per class are shown in Figure 3. From Figure 3a, it is possible to see that around 80% of the time the exercise classifier detects the physical activity with small variability across different activity types, while the post-exercise detection is more critical, as shown in Figure 3d. Specially, for all activity types, the detection of the activity completion is rather a challenging task because the heart rate does not return to the baseline values immediately when the activity ends and the accelerator signal can cause some misleading samples. The classification accuracy of the activity type and intensity classifiers remains consistent for 70% of the time, as shown in Figure 3b and 3c. Short-time misclassifications can be due to the resting periods, but they do not compromise the efficacy of the module. In addition, each panel also shows the running accuracy over time in a red dashed line in Figure 3. The running accuracy of a class denotes the real-time accuracy of correct classification and keeps an updated track of the accuracy through the time window. The running accuracy undergoes a short-timed transient with an undershoot behavior until the class is correctly detected, then the accuracy remains stable over time. It may be due to the fact that the heart rate or accelerometer data are similar among different classes at the very beginning of an exercise session. As the session progresses, the data show a more defined pattern that is characteristic of the correct class. Once the class is correctly detected, the accuracy stops fluctuating and the classifier’s prediction is maintained. The running accuracy is a safety measure that can help to have unnecessary or risky adjustment to the insulin dosing in presence of the determined physical activity.
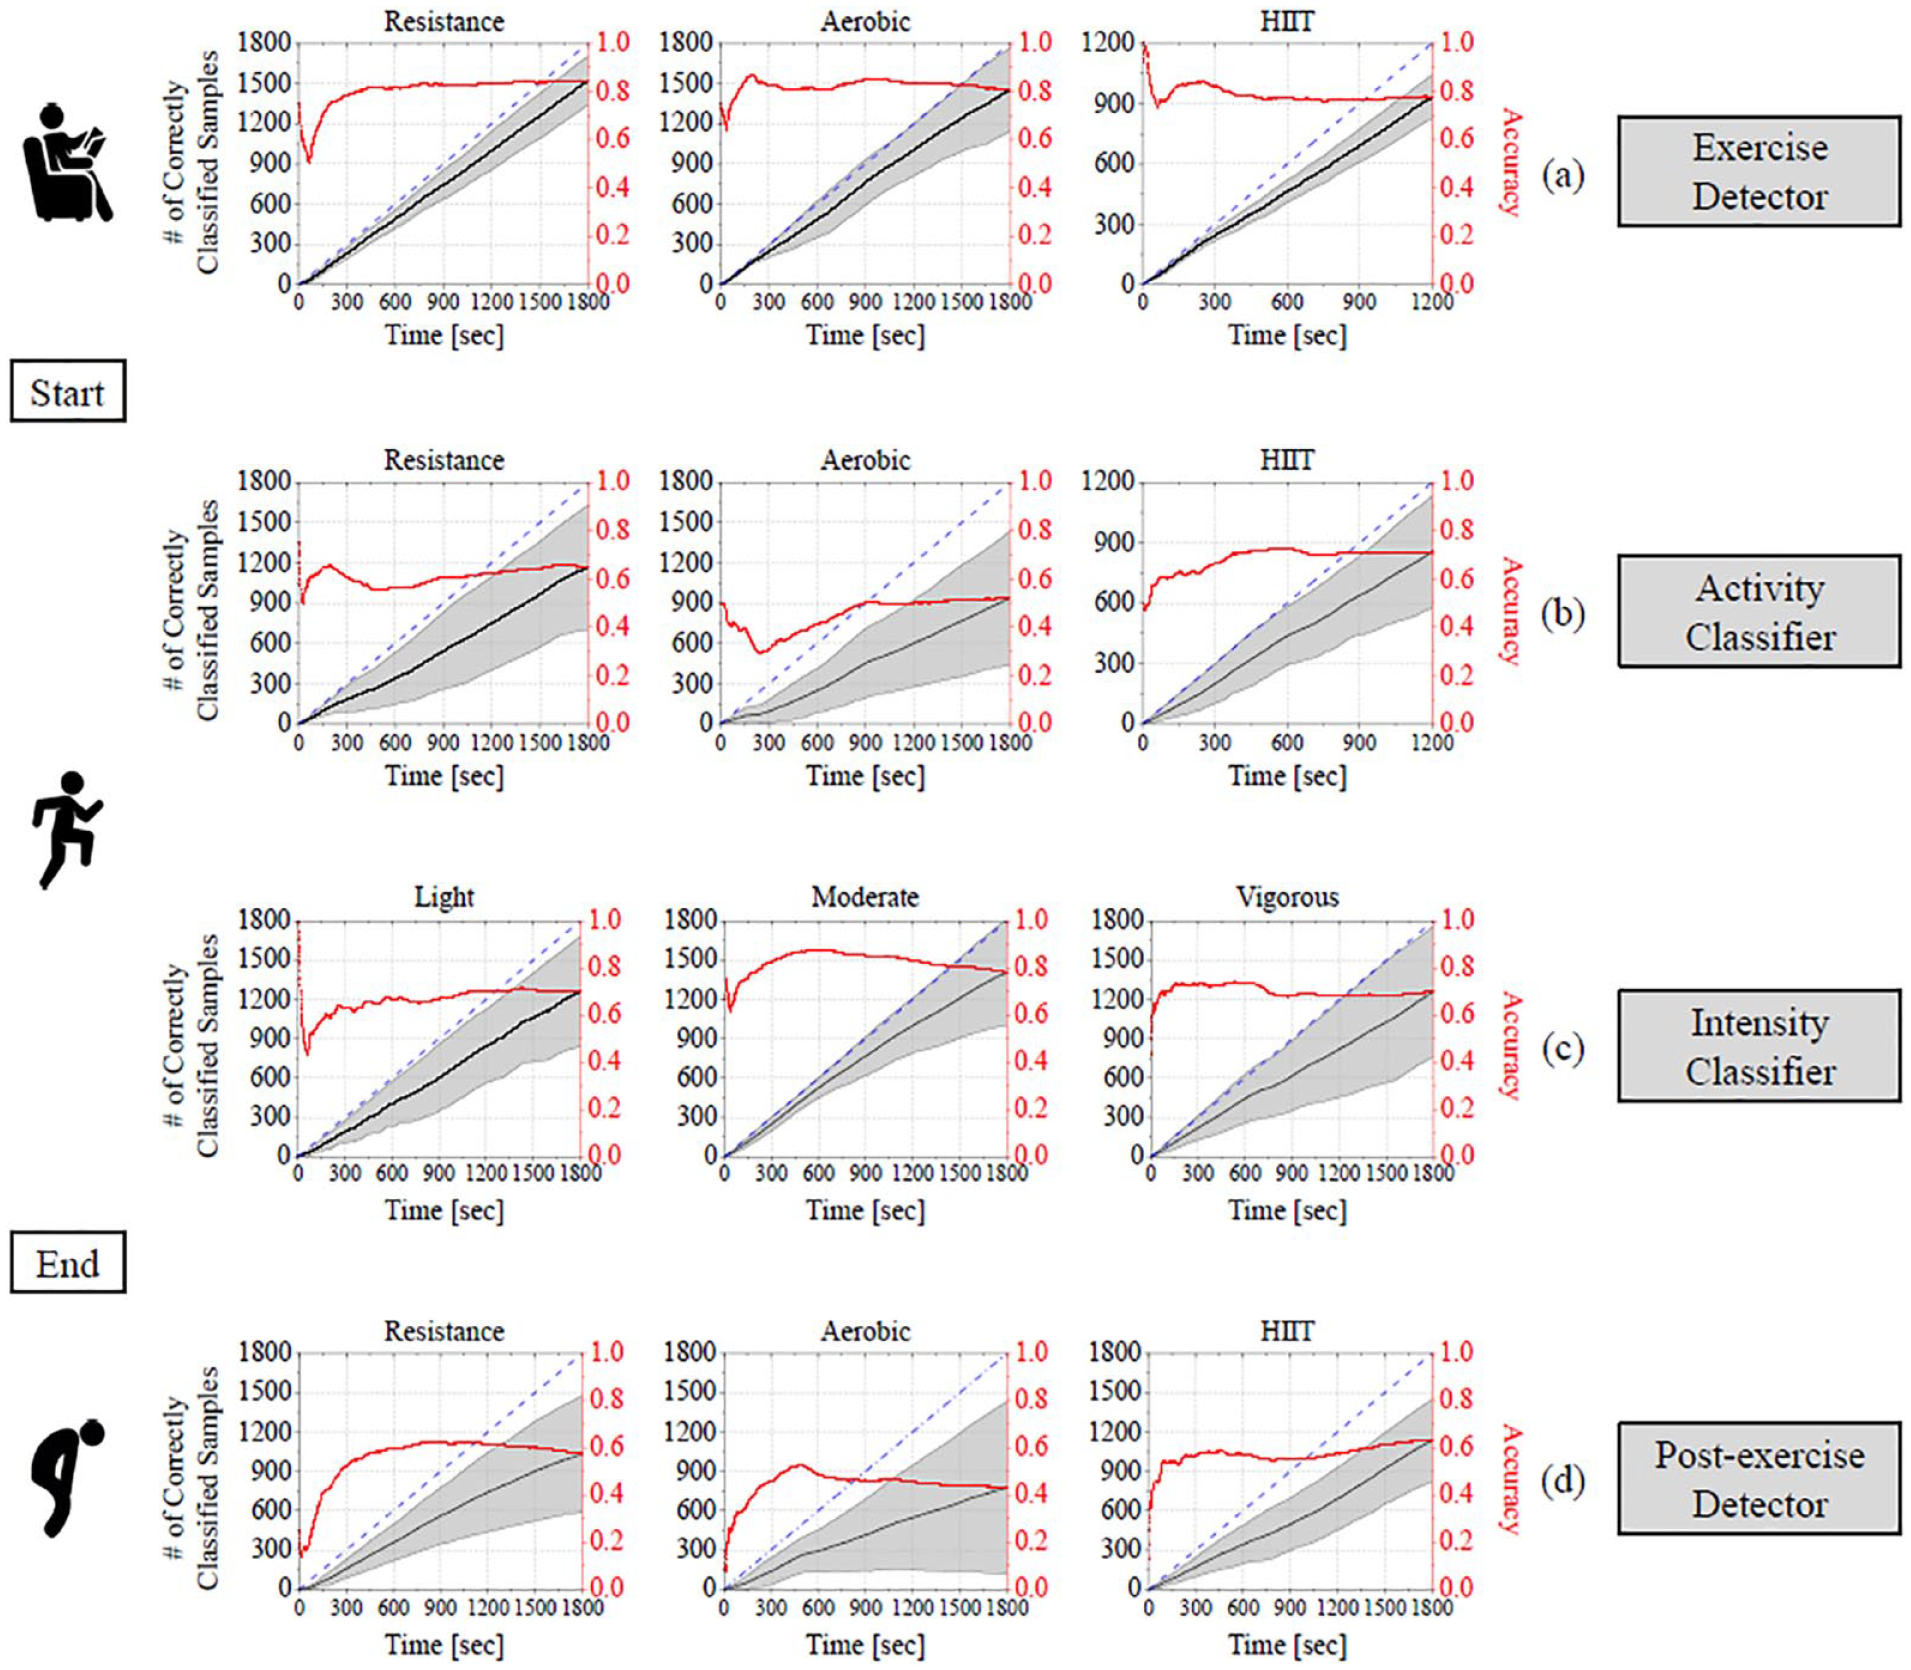
Mean and standard deviation of the total number of correctly classified samples versus time are reported in black per class. Each black point represents the total number of correctly classified occurrences of a given class up to the current line. The terminal point of the black curves corresponds to the overall accuracy, which is reported in Figure 2b. If all samples were correctly classified, the black line would lie on the blue line representing the diagonal from the top right to the bottom left. The running accuracy is reported in red: the running accuracy of a given class denotes the real-time classification accuracy of correct classification and keeps an updated track of the accuracy through the time window. (a) Performance of the exercise detector in case of resistance, aerobic, and HIIT. (b) Performance of the activity classifier: the reference class is reported in the title. (c) Performance of the intensity classifier: the reference class is reported in the title. (d) Performance of the post-exercise detector, in case of resistance, aerobic, and HIIT. The running accuracy is reported with a red dashed line.
Discussion
This work proposes a framework to estimate a complete picture of exercise activities in real-time by providing information on the onset and completion of the activity, as well as its type and intensity. This module aims to enhance an AID or a decision support by allowing a more informed and individualized insulin delivery profile to compensate for glycemic perturbations due to exercise. 18 The detection and classification framework was based on random forest algorithm. Random forest is known for achieving accurate and robust predictions as well as for its easy interpretability. The interpretability was a key feature toward the development of this module as we aimed to build the framework based on a meaningful feature set which included raw signals collected from wearable sensing devices without any transformation.
Aiming to use this module to inform appropriately the insulin dosing for any AID or a decision support system implies that the design decisions were oriented toward the safety of the individual. To avoid triggering a dosing adjustment due to a detection error, a mechanism that can filter spurious oscillation was introduced, as described in “Activity Detection and Classification Module” section. The detector has to predict the same class at least 30 seconds before recording a change in the state. A smaller N could be ineffective to filter any swinging behavior in the prediction, while a higher value of N can compromise a fast detection. Although having two independent detectors for exercise and post-exercise may look redundant, it can help to have unnecessary or risky adjustment to the insulin dosing. If the exercise detector predicts a “sedentary” state during the exercise window, that is, suggesting the completion of the activity, the outcome of the post-exercise detector can help either to confirm that the exercise was ended or to detect a long unexpected recovery state. In addition, the CGM signal is useful for helping to better predict exercise intensity as it likely changes differently for different intensities.
An 8% decrease in performance was achieved when the training procedure of the intensity classifier was repeated leaving CGM data out of the input feature set. Although the use of CGM leads to an increase in performance, the investigation showed that this classifier can be used also when CGM data is not available, for example, a temporary disconnection of the CGM, or for non-CGM users.
The average accuracy of the exercise and completion detection we obtained is comparable with the results reported in Mehrang et al, 28 although their model only predict the start and end of the exercise. Activity classification or detection was performed with higher accuracy in Cescon et al, 22 Mehrang et al, 28 and Ahmadi et al, 30 although not in real-time. In the case of the detection time, in the work of Dasanayake et al, 20 the authors reported a detection time around 5 minutes, while a detection time of 2.5 minutes was reported in the work of Turksoy et al. 25
A limitation of the current work lies in the fact that the intensity data were labeled by the participants. A method to detect and grade the energy expenditure could provide more reliable results. 21 Future work will be devoted to the investigation of additional activity types in the completely unsupervised free-living environment. 37
Conclusions
We developed a framework for real-time detection and classification of exercise for application to AID or decision support systems for T1D. In addition to satisfactory performance for different types of exercise at different intensities, the results show that this framework can perform these tasks quickly—within seconds—and with a low number of false-positive events using easily interpretable raw signals.
Supplemental Material
sj-docx-1-dst-10.1177_19322968231153896 – Supplemental material for Design of a Real-Time Physical Activity Detection and Classification Framework for Individuals With Type 1 Diabetes
Supplemental material, sj-docx-1-dst-10.1177_19322968231153896 for Design of a Real-Time Physical Activity Detection and Classification Framework for Individuals With Type 1 Diabetes by Sunghyun Cho, Eleonora M. Aiello, Basak Ozaslan, Michael C. Riddell, Peter Calhoun, Robin L. Gal and Francis J. Doyle in Journal of Diabetes Science and Technology
Footnotes
Acknowledgements
The authors would like to thank Prof. Peter Jacobs, Dr Clara Mosquera-Lopez, and Gavin Young (Oregon Health and Science University) for their helpful advice.
Abbreviations
AID, automated insulin delivery; BA, balanced accuracy; CGM, continuous glucose monitoring; FN, false negative; FP, false positive; HIIT, high-intensity interval training; TN, true negative; TP, true positive; T1D, type 1 diabetes.
Author Contributions
S.C., E.M.A, and F.J.D. conceived and designed the framework. S.C. designed the random forest models and wrote the original draft of the manuscript;. E.M.A. processed the datasets, performed formal analysis, and wrote the original draft of the manuscript. B.O., M.C.R., P.C., and R.L.G. revised the manuscript. F.J.D. revised the manuscript, acquired funding, and administered the project.
Declaration of Conflicting Interests
The author(s) declared the following potential conflicts of interest with respect to the research, authorship, and/or publication of this article: M.C.R. has received speaker’s honoraria from Medtronic Diabetes, Insulet, Ascensia Diabetes Program, Xeris Pharmaceuticals, Lilly Diabetes and Lilly Innovation. F.J.D. reports equity, licensed IP and is a member of the Scientific Advisory Board of Mode AGC. All other authors report no conflict of interest.
Funding
The author(s) disclosed receipt of the following financial support for the research, authorship, and/or publication of this article: This work was supported by the Leona M. and Harry. B. Helmsley Charitable Trust. The content is solely the responsibility of the authors and does not necessarily represent the official views of the Leona M. and Harry B. Helmsley Charitable Trust. Non-financial Support: Verily (South San Francisco, CA) provided the Study Watch at no cost. Dexcom provided continuous glucose monitors at a discounted rate. S.C. was supported by Korea Institute for Advancement of Technology grant funded by the Korea Government (P0017304, Human Resource Development Program for Industrial Innovation).
Supplemental Material
Supplemental material for this article is available online.
References
Supplementary Material
Please find the following supplemental material available below.
For Open Access articles published under a Creative Commons License, all supplemental material carries the same license as the article it is associated with.
For non-Open Access articles published, all supplemental material carries a non-exclusive license, and permission requests for re-use of supplemental material or any part of supplemental material shall be sent directly to the copyright owner as specified in the copyright notice associated with the article.