
Abstract
Background and Aims:
Hypoglycemia may lead to anxiety, poor adherence, and hypoglycemia unawareness and is especially a threat during the night in patients with insulin-treated type 2 diabetes (T2D). It would therefore be beneficial to warn patients at risk of hypoglycemia at bedtime so they can react accordingly and avoid the episode. Hence, the aim of the present study was to develop a model for predicting nocturnal hypoglycemia.
Methods:
Continuous glucose monitoring (CGM), mealtime, and insulin data were collected from 67 insulin-treated patients with T2D (NCT01819129). Data were structured into 24-hour periods and labeled as nocturnal hypoglycemia or not depending on whether 15 consecutive minutes were spent below 3.0 mmol/L (54 mg/dL) during the following night. Each period was divided into “last night,” “morning,” “day,” and “evening” for feature extraction purposes, and 72 potential features were extracted for every period. A five-fold cross-validation was used to select features by forward selection and for training and validating a model based on logistic regression.
Results:
The prediction model was based on 30 patients with 60/496 periods resulting in nocturnal hypoglycemia. Forward selection revealed that the best features were based on CGM and involved the last value and mean value during the evening, as well as the relative difference in maximum value during the day between the present period and previous periods. The model obtained a mean area under the receiver operating characteristics curve (AUC) of 0.82 with an accuracy of 0.79.
Conclusions:
The model was able to predict nocturnal hypoglycemia with an acceptable accuracy and could therefore prevent such cases.
Introduction
Intensive insulin therapy is a key element in the management of insulin-treated patients with type 2 diabetes (T2D) but increases the risk of severe hypoglycemia and early death.1 -4 In several studies, severe hypoglycemia has been associated with increased mortality in insulin-treated patients with T2D,5,6 and as Cryer 4 points out, there is no doubt that hypoglycemia can kill.
During night, where people are typically unable to react to declining blood glucose levels, hypoglycemic episodes are a particular threat to the patients. 7 Based on data from the ACCORD study, there is an increased risk of severe hypoglycemia among women and African Americans as well as people in intensive glycemic treatment, with longer diabetes duration, of increasing age, and with renal dysfunction. 8 Nocturnal hypoglycemia has been associated with increased morbidity and the sudden dead-in-bed syndrome.9,10 Moreover, hypoglycemic episodes affect the quality of life among people with T2D negatively as the episodes lead to fear of hypoglycemia and diabetes distress.11,12 The resultant fear of hypoglycemia further leads to reduced adherence to insulin 13 as patients may change behavior after hypoglycemic episodes including increased calorie intake and reduction or skipping of insulin doses.12,14 Walz et al 15 found that patients reporting moderate or worse symptoms of hypoglycemia had poorer adherence to medication, which increases the risk of late-diabetic complications. 16 This makes hypoglycemia the critical limiting factor in glycemic management of people with diabetes mellitus. 17
One possible solution for the management of hypoglycemia is a prediction model giving advice about the risk of nocturnal hypoglycemia at bedtime. A prediction at bedtime would enable the patients with T2D to adjust long-term glucose-affecting factors, such as basal insulin, or short-term by carbohydrate intake. Machine learning models using continuous glucose monitoring (CGM) data to predict nocturnal hypoglycemia have been developed with success in type 1 diabetes (T1D).18,19
To the best of the authors’ knowledge, no CGM-based model for the prediction of nocturnal hypoglycemia exists for T2D. Hence, the objective of this study was to develop a model for predicting nocturnal hypoglycemia at bedtime to obtain increased safety for insulin-treated patients with T2D.
Methods
Data Collection
Data for the present study were provided from a previous trial performed by Novo Nordisk A/S (Trial ID: NN1218-3853, NCT-number: NCT01819129), which is available to researchers at www.novonordisk-trials.com. The trial was designed to investigate the efficacy and safety of faster aspart compared with insulin aspart in combination with insulin glargine and metformin in patients with insulin-dependent T2D on multiple daily injections. The trial had an eight-week run-in period with basal titration of insulin glargine and metformin, followed by a 26-week treatment period with bolus titration where patients were randomized to either faster aspart or insulin aspart. A subgroup of 67 patients had their glycemic control monitored using a real-time blinded Dexcom G4 Platinum CGM device for 10 to 14 days prior to randomization and again for 10 to 14 days after the treatment period. Patients also reported the date and time for meals as well as bolus and basal injections. CGM, mealtime, insulin, and demographic data formed the basis for predicting nocturnal hypoglycemia in the present study.
Preprocessing
The data were structured into 24-hour periods from midnight to midnight the next day. Hypoglycemia was defined when the patient spent at least 15 consecutive minutes below 3.0 mmol/L (54 mg/dL), also referred to as a level 2 (moderate) hypoglycemia, and ended at the last timepoint before 15 consecutive minutes was spent above 3.0 mmol/L (54 mg/dL). The periods were then labeled as either nocturnal hypoglycemia or not depending on whether a hypoglycemia, or potentially several, occurred during the following night (00.01-05.59). For feature extraction purposes, each period was further divided into the time segments “last night” (00.01-05.59), “morning” (06.00-09.00), “day” (06.00-00.00), and “evening” (21.00-00.00). Periods were excluded from the analysis if there were more than 20% missing data in one of the time segments within the period or during the following night used for labeling the period. Patients having no periods resulting in nocturnal hypoglycemia were also excluded as they would solely contribute to unbalancing the data.
Feature Extraction
The following CGM-based features were extracted for each time segment in every period: Minimum value, maximum value, range (maximum value-minimum value), standard deviation, variance, and mean. Furthermore, the glycemic variability percentage and slope based on linear regression were extracted for “last night” and “evening,” and finally the last value was extracted during “evening.” A relative variant for each feature was also calculated by subtracting the mean of previous periods within the same patient. If there were less than three previous periods (eg, predictions for days 1-3), the mean of all periods within the same patient was imputed to calculate the relative features. Recent hypoglycemia was also extracted as the number of episodes as well as the number of minutes spent in a level 2 hypoglycemia for the last 6, 12, and 24 hours. Features related to meals and insulin use included the sum of bolus doses, number of meals, timing of the last meal, and time difference between the last meal and last bolus dose after 18.00. Demographic data were also included as potential features and involved age, sex, diabetes duration, HbA1c, and body mass index (BMI). Thus, 72 potential features were extracted for every period.
Feature Selection
A sequential forward selection was used to identify the most informative features prior to training the model. The selection was done in Python using the function SequentialFeatureSelector (library: mlxtend) using logistic regression as the classifier (library: scikit-learn) and scoring the features by the area under the receiver operating characteristics curve (AUC) using five-fold cross-validation. Features were included in the model training if they provided an average increase of >0.5 in AUC across the folds.
Model Training and Validation
The selected features were used to train a model also based on logistic regression and validated using five-fold cross-validation. The model was evaluated for its ability to differentiate between 24-hour periods resulting in nocturnal hypoglycemia or not. The result was assessed through receiver operating characteristics for each fold along with the mean curve with standard deviation. The sensitivity, specificity, accuracy, positive predictive value, and negative predictive value was reported as an average across the five folds when setting the prediction threshold closest to a specificity of 0.70. To determine the potential impact of a patient reacting on a false alarm, the distribution of false positives was visualized using histograms, where the periods were presented by the lowest CGM value during the following night.
Results
The preprocessing resulted in the extraction of 60/496 periods resulting in nocturnal hypoglycemia distributed among 30 patients. The baseline characteristics for the included patients can be found in Table 1.
Baseline Characteristics for the Included Patients.
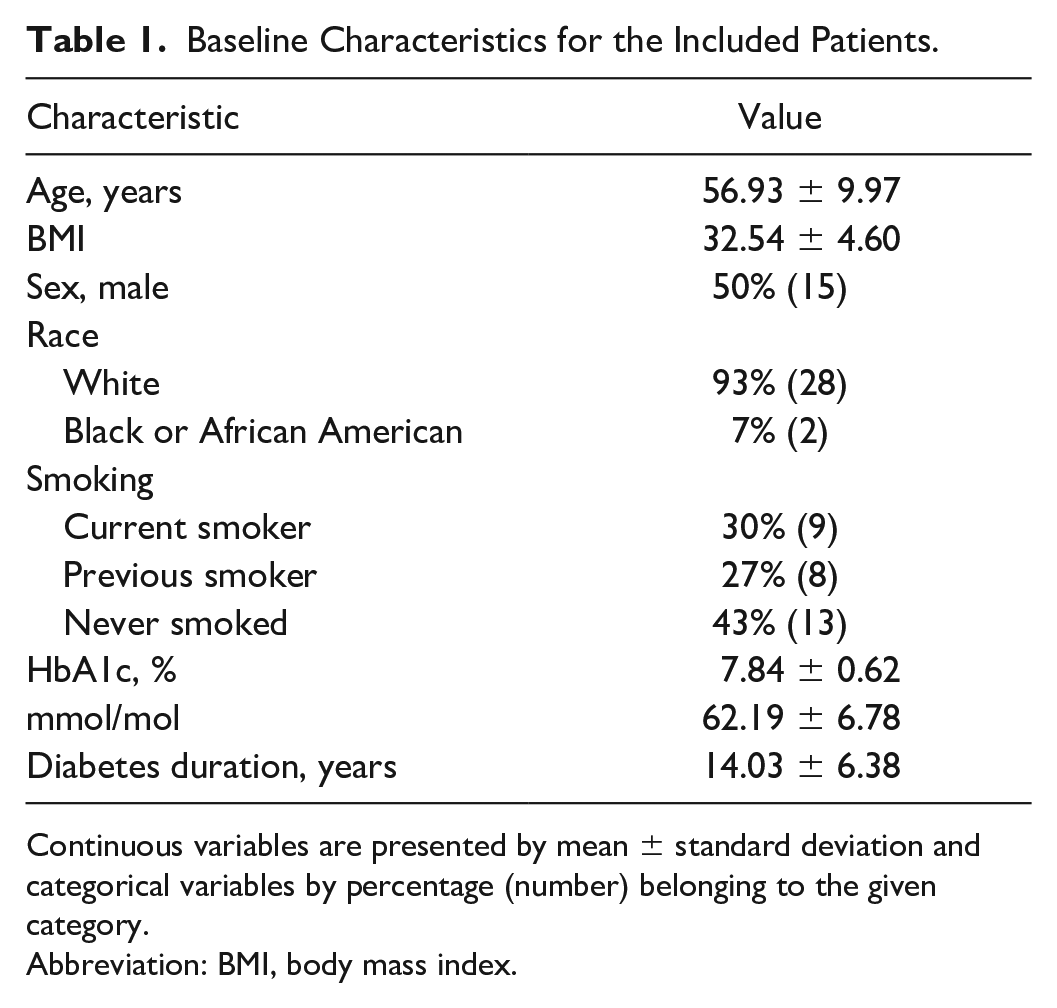
Continuous variables are presented by mean ± standard deviation and categorical variables by percentage (number) belonging to the given category.
Abbreviation: BMI, body mass index.
Based on forward selection, 3 out of the 72 potential features were selected for model training as their inclusion resulted in an averaged increase of >0.5 in AUC (Figure 1).
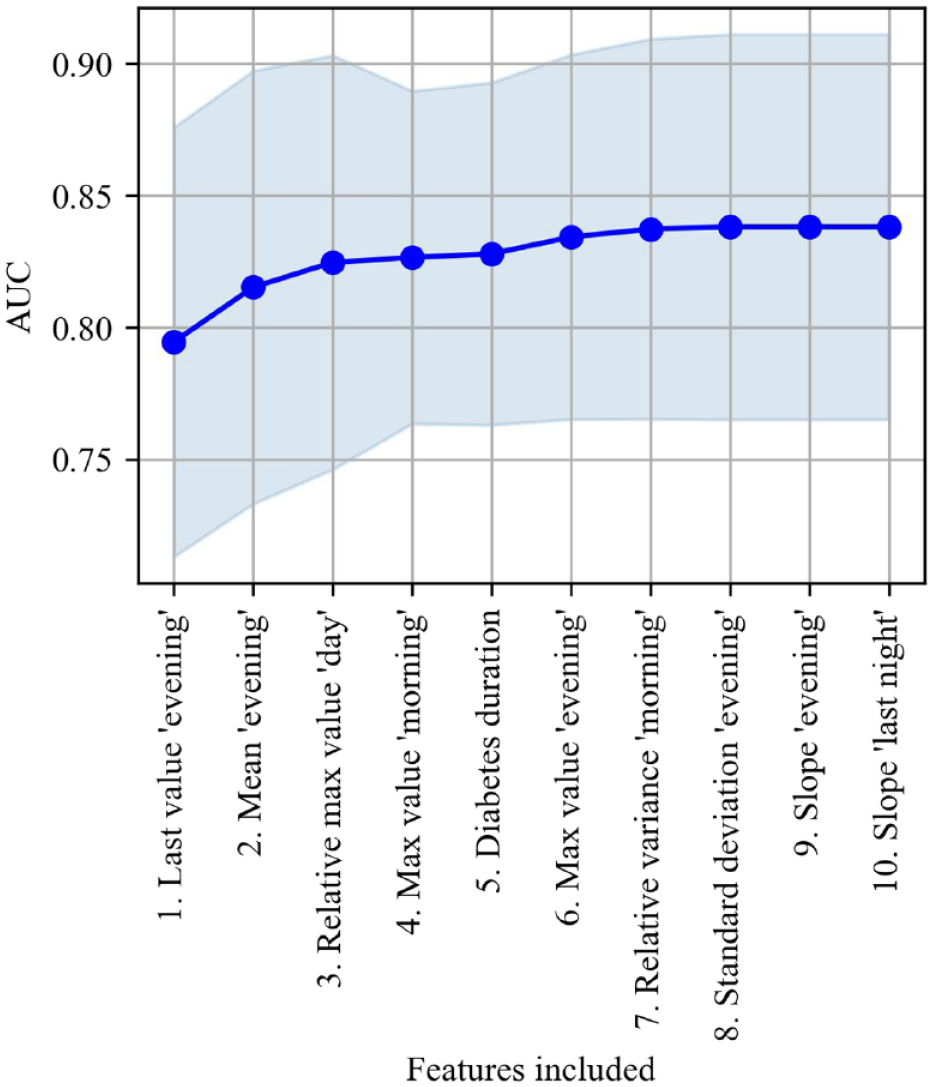
Forward selection showing the number of features included against the averaged increase in AUC with standard deviation on the validation set from five-fold cross-validation.
The three selected features were the last value during “evening,” the mean value during “evening,” and the relative difference between the maximum value during “day” and previous periods. A logistic regression model based on those three features was able to differentiate between 24-hour periods resulting in nocturnal hypoglycemia or not with an averaged AUC of 0.82 (Figure 2).
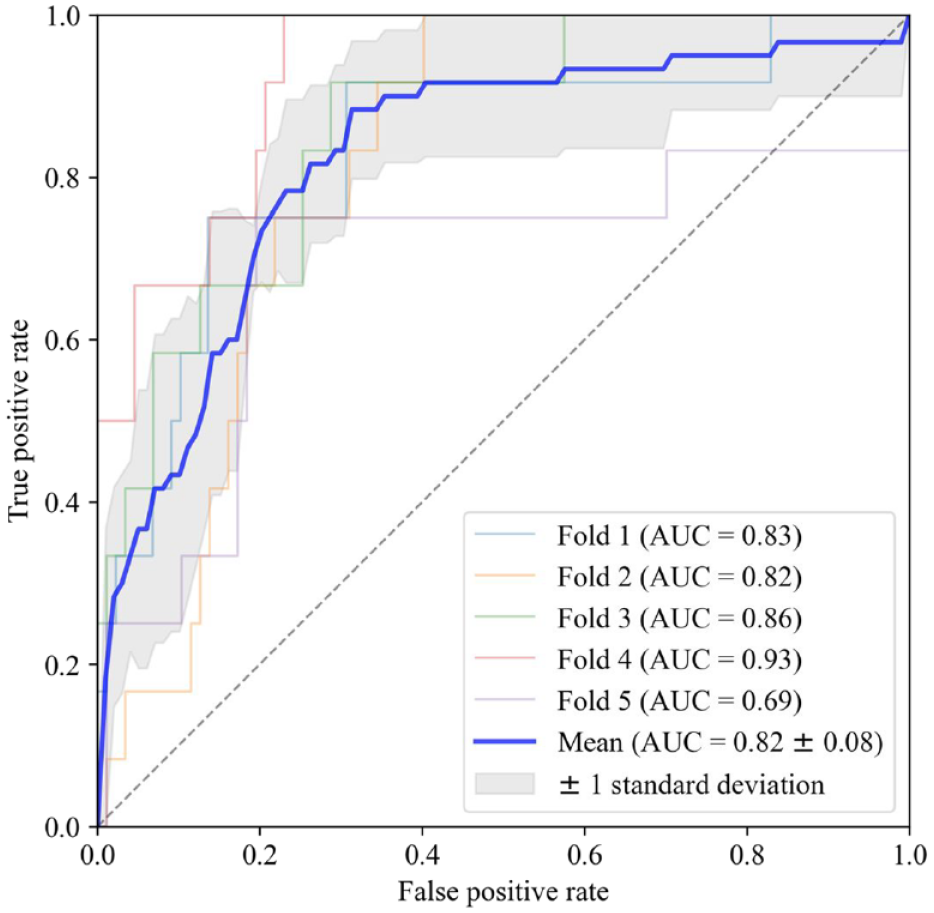
Receiver operating characteristics for each of the five-fold cross-validation along with the mean curve and standard deviation.
By setting the threshold for classification at a specificity closest to 0.70 in the five folds, the average sensitivity was 0.83 at a specificity of 0.79. This resulted in an averaged accuracy of 0.79 with a positive predictive value of 0.35 and a negative predictive value of 0.97. The distribution of false positives showed that these periods were predominantly in the lower regions and centered on a median of 3.83 mmol/L (69 mg/dL) as the lowest value during the following night (Figure 3).
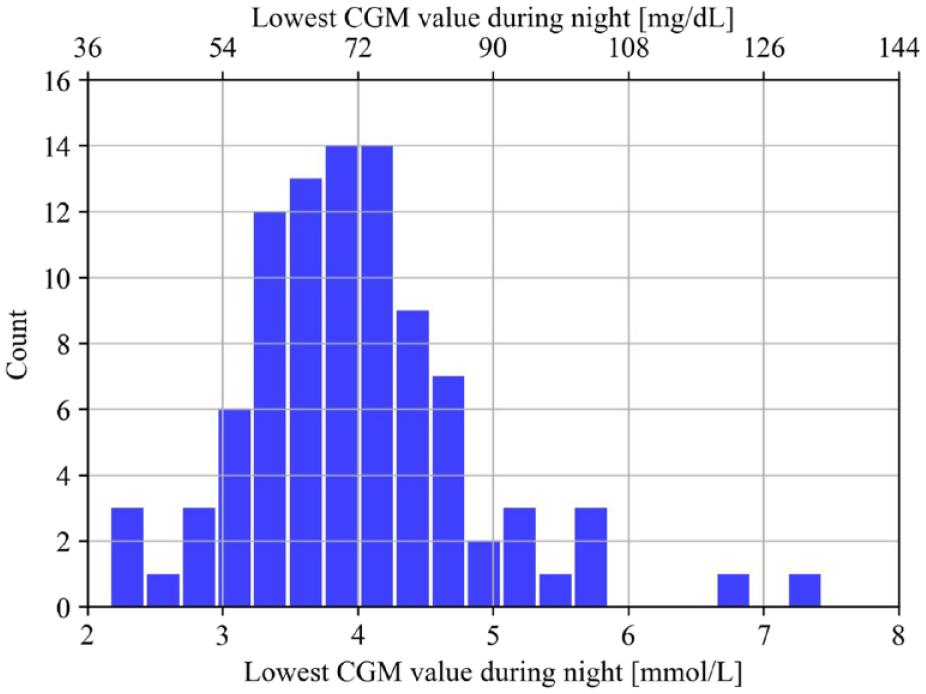
The distribution of the false positives presented by the lowest CGM value during the following night.
Discussion
In this study, we showed that it is possible to develop a model for predicting nocturnal hypoglycemia at bedtime in adult T2D patients with an acceptable accuracy.
To the best of our knowledge, no studies have investigated the possibility of predicting nocturnal hypoglycemia in T2D using machine learning on CGM data. In T1D, Bertachi et al 18 investigated whether nocturnal hypoglycemic episodes in 10 adult patients with T1D can be predicted using machine learning on CGM and physical activity tracker data. They found that a support vector machines model can predict the episodes with a sensitivity and specificity of 79% and 82%, respectively. Using support vector machines on a small sample size increases the risk of overfitting, and it was not possible to assess the risk of overfitting in their work as the manuscript does not mention if data were split in training, validation, and test, or if their cross-validation were done on a patient or instance level. Furthermore, the CGM-based definition of hypoglycemia did not follow the consensus with 15 consecutive minutes below the threshold. 20 In another investigation of 463 patients with T1D, Jensen et al 19 showed that it is possible to predict nocturnal hypoglycemia based on linear discriminant analysis of CGM data with an AUC of 0.79 corresponding to a sensitivity and specificity of 75% and 70%, respectively. Both these results confirm that the AUC of 0.82 (sensitivity of 83% and specificity of 79%) in this study is acceptable and high for a T2D prediction model considering that the heterogeneity of T2D is higher compared with T1D among many factors due to the remaining endogenous insulin production. 21
The present study was limited by having a small sample size of 60 periods with nocturnal hypoglycemia occurring in 30 patients and by not having an independent test set or performing external validation of the model. It was also not possible to normalize the insulin doses with respect to bodyweight as bodyweight was not included in the data. Neither were there any indication of meal size nor carbohydrate content related to the mealtime. This, in combination with the insulin use and meal timing being self-reported, could explain why features based on these parameters were not included in the model. Moreover, the study assumed fixed sleeping patterns and did therefore not account for variations both within and between patients (eg, night shift workers). It should also be noted that the participants in the original study used blinded CGM devices. Newer CGM devices have integrated notifications and alarms that can warn patients when their blood glucose drops too low and therefore greatly reduce the risk of hypoglycemia. However, patients will presumably prefer to be warned before bedtime compared with being alarmed and disturbed during their sleep. Finally, medications such as SGLT-2 inhibitors and GLP-1 receptor agonists can be used to effectively lower the blood glucose without increasing the risk of hypoglycemia. 22 Patients introduced to these medications could therefore have a lower risk of hypoglycemia compared with only using metformin and insulin. Yet, it is believed that a prediction model for nocturnal hypoglycemia could still be useful for patients with a high glycemic variability or when patients are concerned with taking their medication.
The study could have been improved by having self-reported bedtimes or by using an activity tracker that could indicate when the patients go to bed. Precise insulin data from smartpens could potentially also add predictive value indicating when patients injected a too high or too low insulin dose, missed a dose, double dosed, or even injected the wrong type of insulin (eg, mistake bolus insulin for basal insulin). However, this was not possible as the study was performed retrospectively on data that were collected for a different purpose. The study could be further improved by predicting the exact time and glucose level of an occurring nocturnal hypoglycemia. This would potentially empower the patients to consider the risk of hypoglycemia and react accordingly by either having a snack before going to bed or setting the alarm to eat during the night or early morning. Despite potential improvements, the results should not be under-estimated. A simple and transparent model based only on CGM was able to correctly predict a substantial proportion of the periods resulting in nocturnal hypoglycemia, for which the hypoglycemia could have been prevented if the patients reacted properly. Even if the patients were to react on a false positive by eating a snack at bedtime, it would presumably not result in nocturnal hyperglycemia as the false positives were distributed around a median below the threshold of 3.9 mmol/L (70 mg/dL) used for defining a level 1 hypoglycemia.
Conclusions
It was possible to develop a model based on CGM data with acceptable accuracy to predict nocturnal hypoglycemia in insulin-treated patients with T2D at bedtime. This prediction model may have potential to increase the safety of insulin-treated patients with T2D, reduce their fear for hypoglycemia, and thereby improve their adherence to prescribed insulin treatment.
Footnotes
Acknowledgements
We would like to show our gratitude toward Novo Nordisk A/S for providing the data on which this study was based.
Abbreviations
CGM, continuous glucose monitoring; T2D, type 2 diabetes; T1D, type 1 diabetes; AUC, area under the receiver operating characteristics curve.
Declaration of Conflicting Interests
The author(s) declared no potential conflicts of interest with respect to the research, authorship, and/or publication of this article.
Funding
The author(s) received no financial support for the research, authorship, and/or publication of this article.