
Abstract

Background
The homeostasis of plasma glucose levels is essential for the survival of an organism and proper functioning of its vital organs. Mammals have parallel circuits of counterbalancing control mechanisms which continuously and harmonically attempt to maintain blood glucose levels (BGLs) within the physiological range. 1 These regulatory mechanisms may induce direct and indirect electrocardiogram (ECG) changes. Indeed, hypoglycemia and hyperglycemia have been previously shown to affect excitability of the heart characterized by alterations on the ECG, which is utilized in noninvasive glucose monitoring.2-5
However, previous studies mostly assessed categorical changes occurring under nonphysiological conditions, although it is known that involvement of the neurohormonal mechanisms in regulatory response to fluctuating BGL occurs gradually, and it is proportional to the magnitude of the BGL changes. 1 Hence, to fully elucidate these relationships and fill the gap in our understanding, it should be understood whether the above-mentioned relationships observed in these studies can be extrapolated to propose a continuous relationship between ECG parameters and the BGL fluctuations under physiological conditions in people without diabetes beyond manifest categorical changes.
Method
A previously published data set containing BGLs measured six times/day over four to five days, and ECG signal recordings over the same period in 19 subjects without diabetes was used. 6 Electrocardiogram signals recorded within glucose measurement time ± five minutes were ensemble-averaged in MATLAB environment (R2021b, MathWorks, USA). R- and T-wave amplitudes, R/T ratios and T-wave integrals were calculated semiautomatically on the averaged ECG signals. Electrocardiogram parameters were matched with corresponding glucose levels. Patients with inadequate signal quality (n = 3), giant T (n = 1), or R (n = 1) waves were excluded. Standard statistical tests were used to analyze data on SPSS (IBM,USA).
Results
The 210 samples collected from 14 subjects had a mean blood glucose concentration of 99.6 ± 14.2 mg/dL. Figure 1 shows means, correlations, and comparisons of ECG parameters between above–below BGL subgroups. There was no significant correlation between amplitudes of R and T-wave, T-wave integral and glucose concentration except for a weak positive correlation between the R/T ratio and the blood glucose (r = 0.241, P < .001). Categorically, mean R-wave amplitude and R/T ratio were significantly higher in above-mean blood glucose concentration subgroup (P = .021 and <.001 respectively). T-wave and T-wave integral did not vary between above- and below-mean glucose subgroups (P > .500 for both). Importantly, the above and below-mean BGL groups consisted of almost identical sources where samples came from 13 out of 14 and 14 out of 14 subjects in the above- and below-mean subgroups, respectively; hence, possible other individual factors and ECG variations are expected to have affected both groups equally.
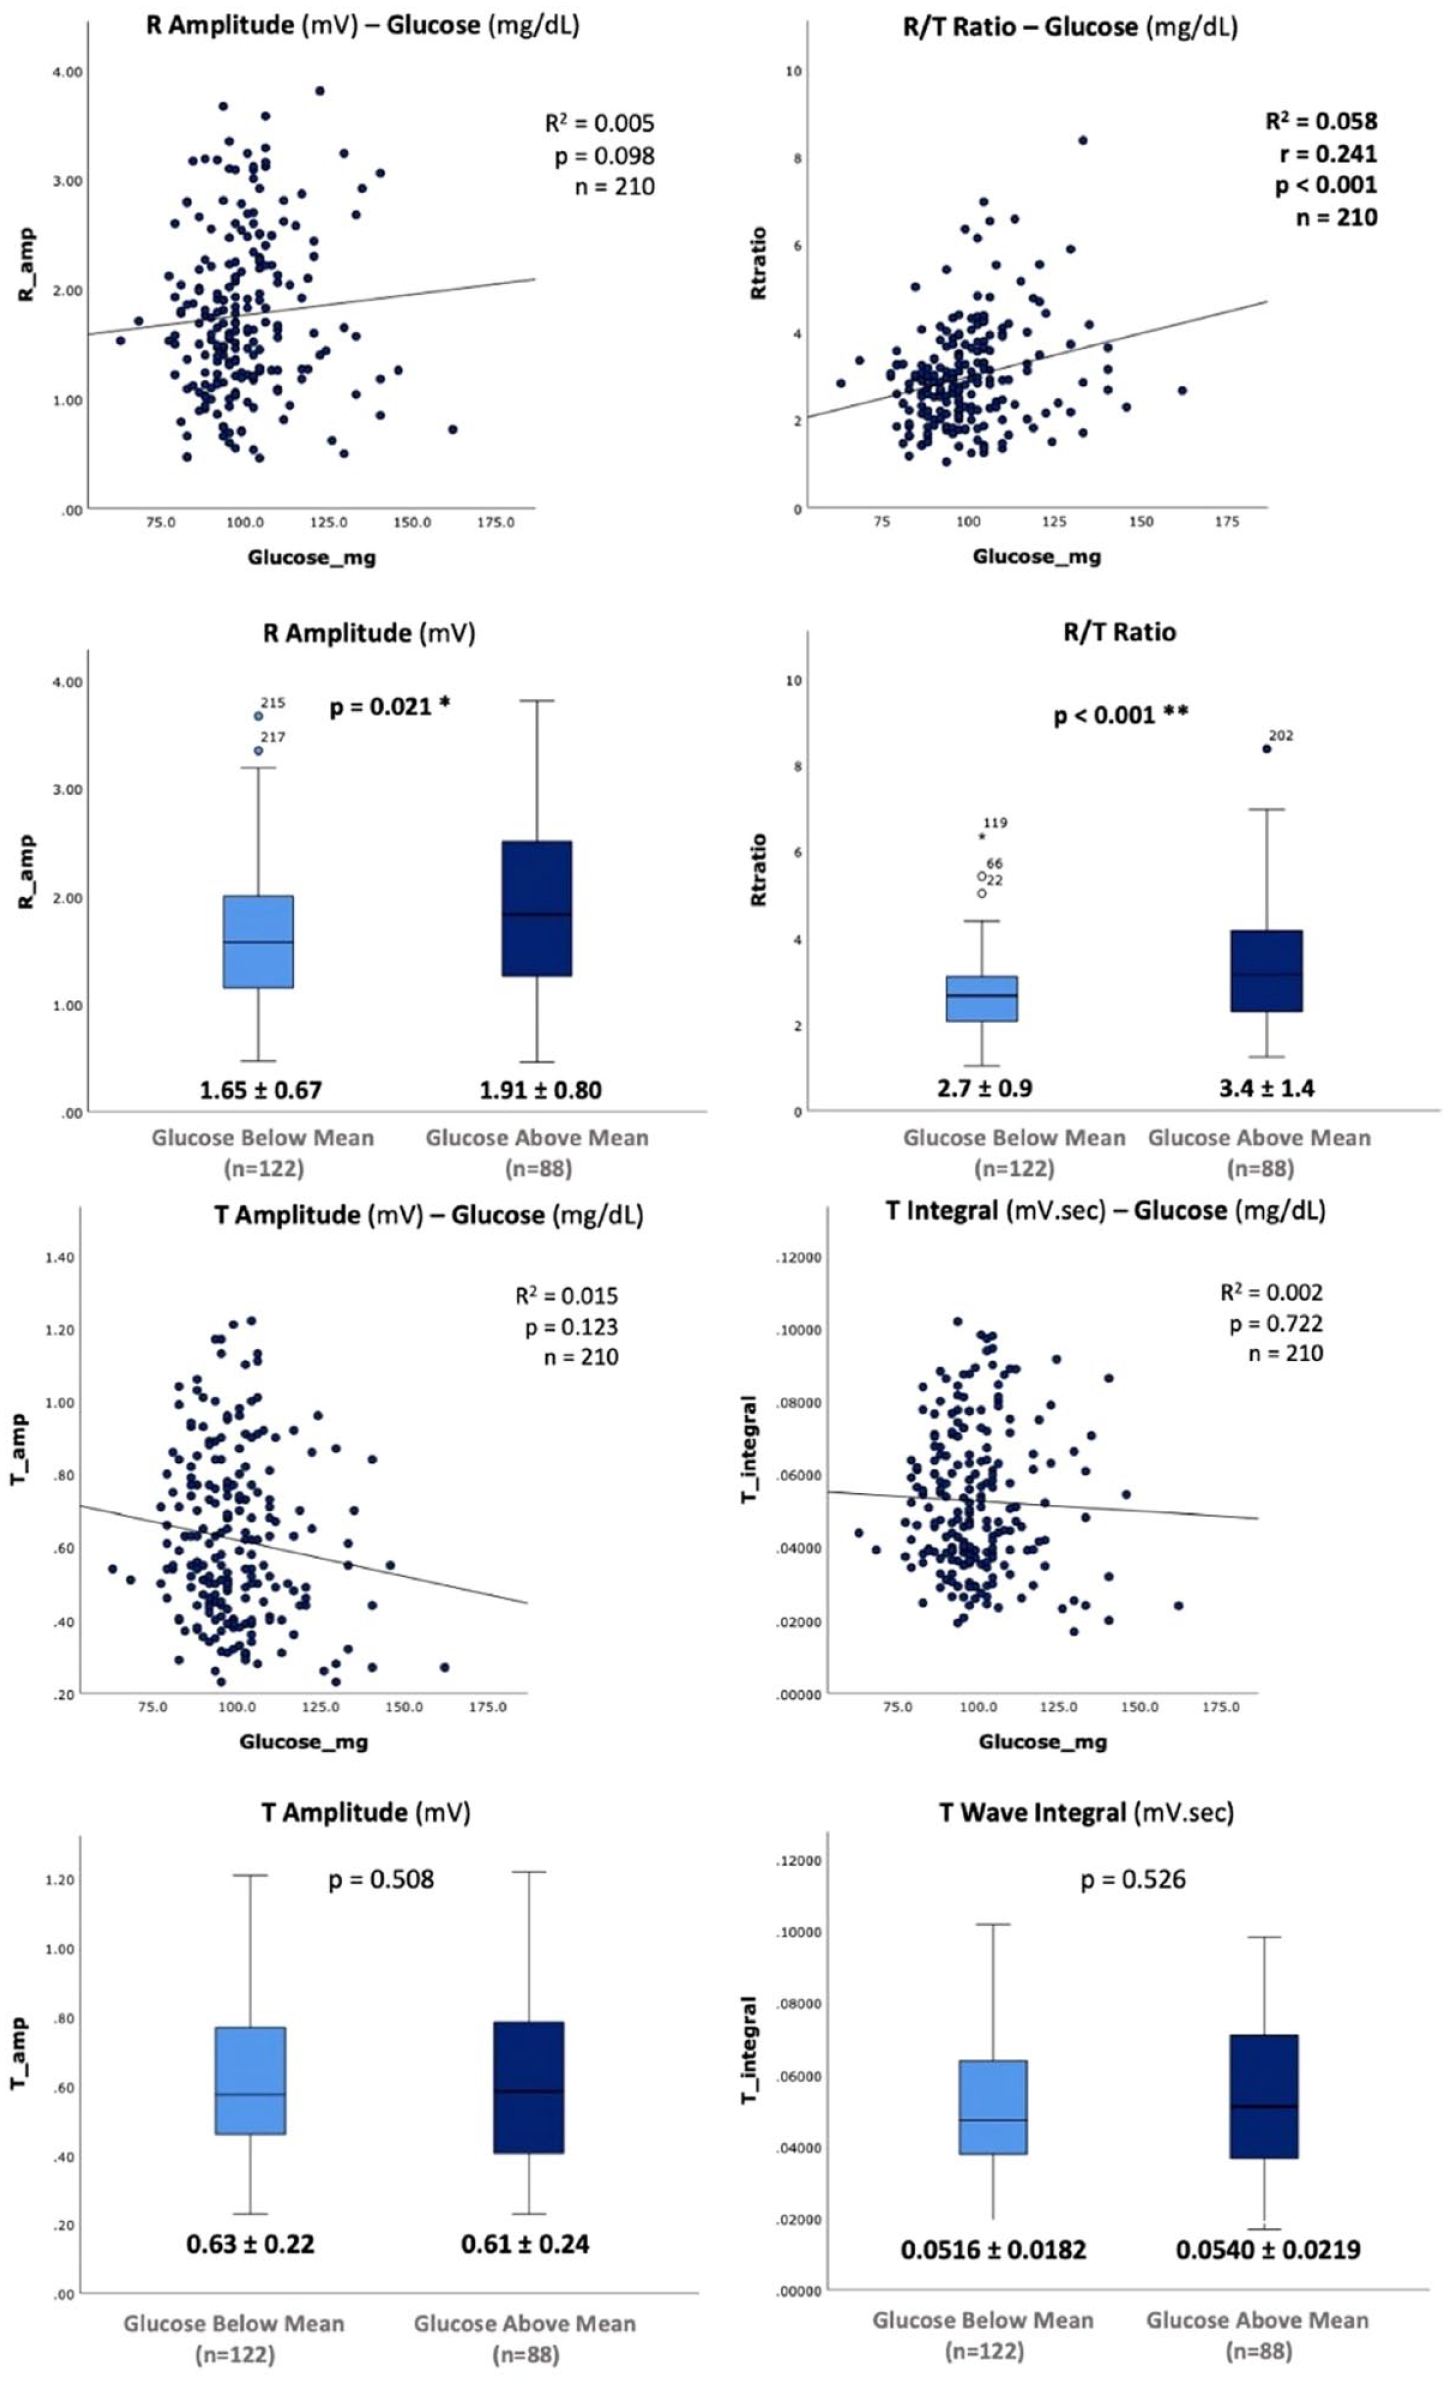
Correlations between glucose and ECG parameters and differences in ECG parameters between above- and below-mean glucose concentration (99.6 mg/dL) subgroups. Among the 210 samples from 14 subjects over five days, there were no remarkable correlations between R-, T-wave amplitudes and TWI, and glucose. There was a weak positive correlation between R/T ratio and BGL (r = .241 (P < .001). Mean T-wave amplitudes and T-wave were not different between below- and above-mean glucose subgroups. However, mean R-wave amplitude (1.91 ± 0.80 vs 1.65 ± 0.67 mV, P = .021) and R/T ratio (3.4 ± 1.4 vs 2.7 ± 0.9, P < .001) were significantly higher in the above-mean group than the below-mean group. Abbreviations: ECG, electrocardiogram; BGL, blood glucose levels; R/T, ratio between R- and T-wave amplitudes; TWI: T-wave integral.
Conclusion
In the light of this study, we conclude that previously reported ECG alterations seen in manifest hypoglycemia and hyperglycemia cannot be extrapolated to propose a continuous relationship between studied ECG parameters with glucose concentration under physiological circumstances. In contrast, as seen in our above-mean group, these relationships only start appearing once thresholds, beyond which neuroendocrine mechanisms start intervening, are crossed and counter-regulatory mechanisms are stimulated.
Footnotes
Abbreviations
BGL, blood glucose level; ECG, electrocardiogram.
Declaration of Conflicting Interests
The author(s) declared no potential conflicts of interest with respect to the research, authorship, and/or publication of this article.
Funding
The author(s) received no financial support for the research, authorship, and/or publication of this article.