
Abstract
Background:
We investigated wearable components of the Abbott Diabetes Care FreeStyle Libre® (continuous glucose monitoring [CGM 1), FreeStyle Libre® 2 (CGM 2), and FreeStyle Libre® 3 (CGM 3) systems in simulated diagnostic radiologic procedures.
Methods:
Sensors were loaded with simulated glucose data and exposed to X-ray scanning, computed tomography (CT), and magnetic resonance imaging (MRI) to simulate radiotherapeutic procedures. The exposure settings were representative of maximum in clinical settings. After the simulations, bench tests were used to assess data integrity and responsiveness of sensors to various concentrations of aqueous glucose.
Results:
All sensors passed all acceptance criteria following each session of X-ray, CT, and MRI exposures. During the 3 T MRI simulation, the displacement forces for the CGM 1, CGM 2, and CGM 3 sensors were 0.132, 0.109, and 0.063 N, respectively, which are more than 100× smaller than the force of 15.97 N required to dislodge the sensor from the body. Data stored in the sensors prior to the exposures remained intact.
Conclusion:
The sensors maintained functionality following a series of high exposure conditions in both X-ray and CT scanning systems, and the sensors were easily visible and identifiable when scanned using clinically relevant scanning parameters. Therefore, patients can continue to wear and use their sensors during and after imaging. The nonclinical MRI testing demonstrated that the sensors can be worn under the specified MRI conditions.
Introduction
Increasing numbers of patients with diabetes are integrating continuous glucose monitoring (CGM) into their diabetes self-management regimens. Unlike traditional finger-stick blood glucose monitoring, CGM delivers a continuous stream of glucose data in numerical and graphical formats that enable patients to easily review their current glycemic status and quickly identify trends that may indicate impending glycemic events.
Among the most commonly used products are the Libre, Libre Pro (CGM Pro), Libre 2 systems, and Libre 3 CGM systems. These products have two primary components: a sensor and a receiver (handheld reader or smartphone app). The sensor is adhered to the back of a patient’s upper arm for up to 14 days. During that time, it continually monitors a patient’s glucose levels, which are then retrieved by the remote handheld receiver that displays the values to a patient. The CGM Pro and CGM 3 sensors store 14 days of data, whereas the CGM 1 and CGM 2 sensors store eight hours of data, after which the continuous data logging overwrites the oldest data.
Although the accuracy and reliability of these sensors have been demonstrated,1-3 there are concerns that computed tomography (CT), X-ray imaging, and magnetic resonance imaging (MRI) may cause changes in the functionality of the sensors. Based on these concerns, patients who wear these sensors are strongly advised to avoid exposure to whole-body millimeter wave scanners at airport security checkpoints, to avoid putting sensors through baggage X-ray machines and to remove their sensor prior to MRI, CT, or X-ray diagnostic procedures. 4
However, whether or to what degree exposure to these radiologic scanning procedures impacts these sensors functionality has not been previously assessed. This study is a comprehensive evaluation of the effects of common radiologic procedures of CT, X-ray scanning, and MRI on the glucose sensor components.
Methods
Device Description
The CGM 1, CGM Pro, and CGM 2 sensors are approximately 5 mm thick and 35 mm in diameter with a flexible filament that is inserted just under the skin. The CGM 3 sensor is approximately 3 mm thick and 21 mm in diameter with a flexible filament that is inserted just under the skin. The sensors are similar in overall geometry and functionality but do have slight variations in internal components and materials. Table 1 presents the main attributes of the four products.
Libre, Libre Pro, Libre 2, and Libre 3 Continuous Glucose Monitoring System Features.
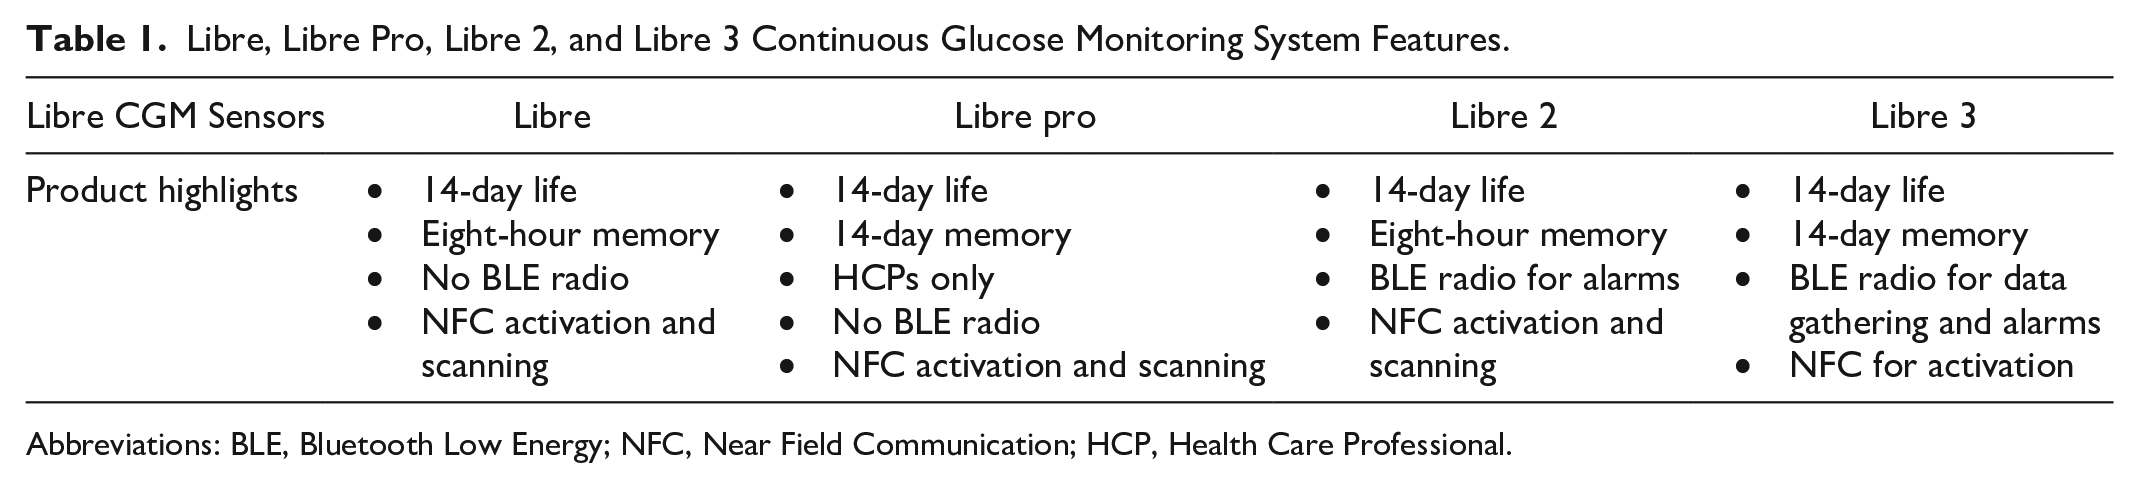
Abbreviations: BLE, Bluetooth Low Energy; NFC, Near Field Communication; HCP, Health Care Professional.
The CGM 1, CGM Pro, and CGM 2 sensors have significant overlap in design elements, including the use of identical sensors and utilizing identical sensor data acquisition circuitry. Because of the significant overlap in design, CT and X-ray evaluations were only conducted on the CGM 2 and CGM 3 devices as representative samples for the evaluation. Magnetic resonance imaging evaluations were conducted on the CGM 1, CGM 2, and CGM 3 sensors to accommodate the different design elements determined to be impacted by the MRI testing. The overlap in design elements between the CGM 1 and the CGM Pro allows this evaluation to be applicable to the CGM Pro.
No receivers were considered for evaluation because they are not attached to the patient and would not be present during an X-ray, CT, or MRI procedure.
X-Ray Scanner
A Siemens Multix QDRSERIES X-ray scanner (Siemens, Munich) was used for X-ray exposure evaluations. The system’s maximum settings of 150 kV and 500 mAs were used for the first 11 X-ray exposures after which the settings were dropped by 20% to 120 kV and 400 mAs for the remaining 9 exposures to address overheating of the X-ray system. The exposure settings are representative of maximum settings because the X-ray system was unable to scan for 20 repeated exposures using the higher settings. Table 2 outlines the X-ray exposure settings.
X-Ray Exposure Settings.
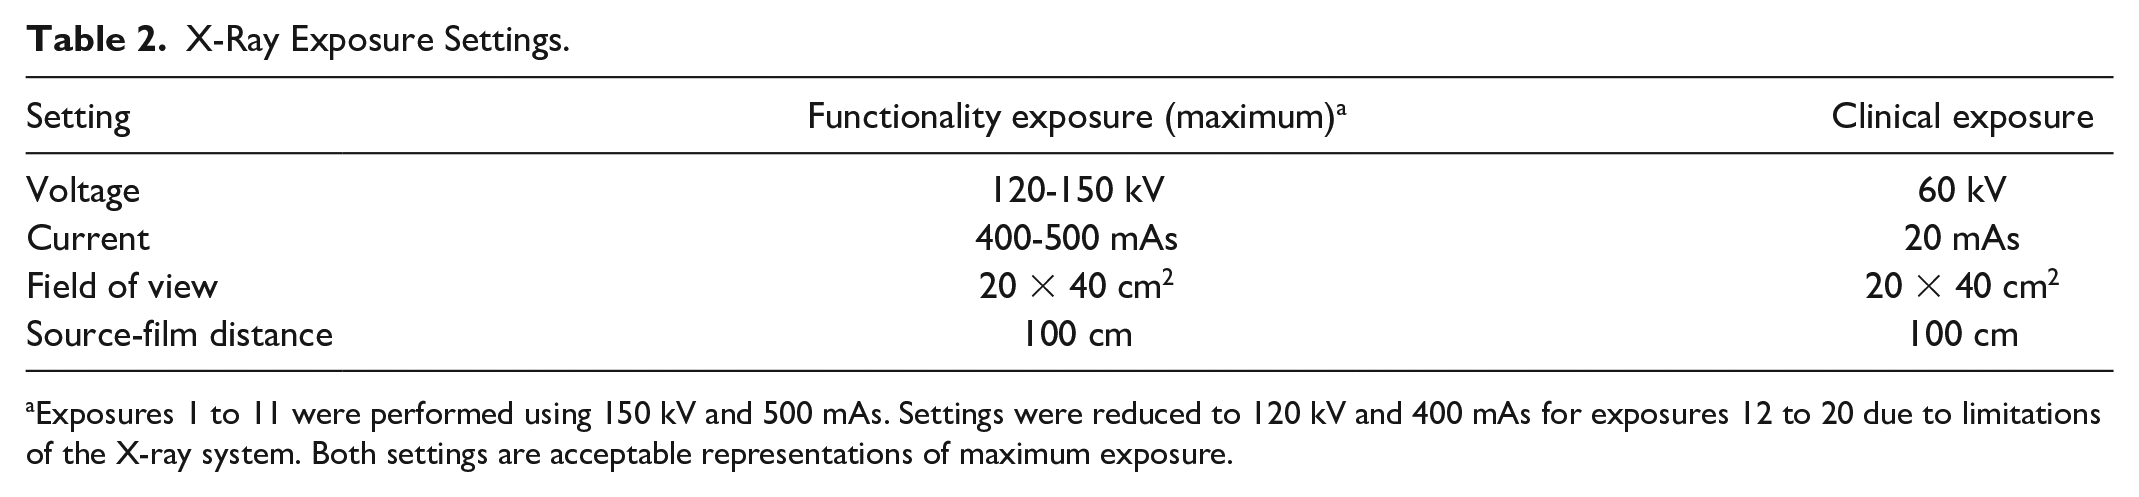
Exposures 1 to 11 were performed using 150 kV and 500 mAs. Settings were reduced to 120 kV and 400 mAs for exposures 12 to 20 due to limitations of the X-ray system. Both settings are acceptable representations of maximum exposure.
Device functionality was evaluated by examining glucose sensor current measurements after X-ray imaging in direct, indirect, and scattered exposure configurations on two CGM 2 and two CGM 3 sensors for each exposure type. The acceptance criterion was glucose error of ≤10 mg/dL for nominal glucose readings of 100 mg/dL. Prior to any X-ray exposure, sensors were activated, and a baseline reading was taken at least 30 minutes from the time of sensor activation. The sensors were positioned on a 0.5-inch (1.27-cm) thick aluminum body mimic plate and placed on the X-ray table. Functionality testing was performed immediately following X-ray exposure to determine if any malfunction occurred during the scanning period.
For each imaging session, the devices underwent a set of two maximum exposures, one in the frontal orientation and one in the side orientation. A total of ten imaging sessions were performed (20 exposures in total). Data were collected for all devices immediately following the final exposure. Device appearance under X-ray imaging was also evaluated by exposing the devices to a clinically relevant exposure setting.
CT Scanner
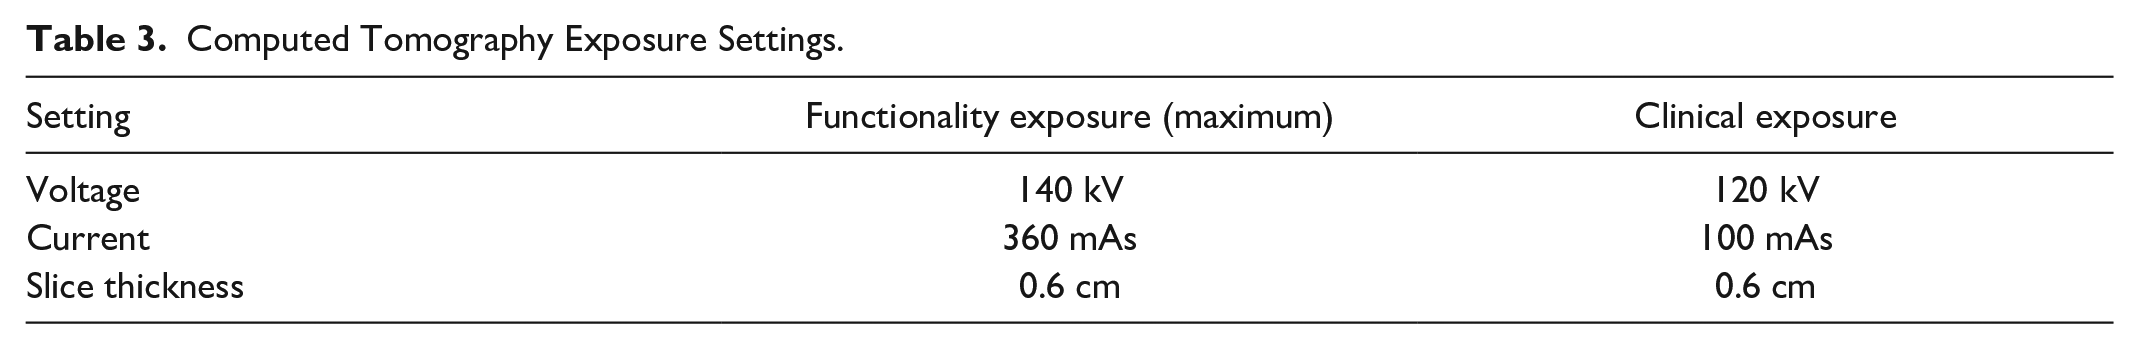
A Siemens Somatom Sensation CT scanner (Siemens, Munich) was used for CT exposure evaluations. The acceptance criterion was glucose error of ≤10 mg/dL for nominal glucose readings of 100 mg/dL. Exposure settings used for functionality testing (maximum settings) and clinical imaging are outlined in Table 3.
Computed Tomography Exposure Settings.
Device functionality was evaluated immediately after CT imaging in direct, indirect, and scattered exposure configurations on two CGM 2 and two CGM 3 sensors for each exposure type. Prior to any CT exposure, sensors were activated, and a baseline reading was taken at least 30 minutes from the time of sensor activation. The sensors were positioned on a 0.5-inch (1.27-cm) thick aluminum body mimic plate placed in the CT scanner.
Because CT scanners produce radiation beams that rotate around the device, only one orientation per imaging session was necessary. A total of ten imaging sessions were performed (ten exposures in total) with data collected every 15 minutes.
MRI Scanners
Magnetic resonance imaging evaluations were conducted using the following standards: ASTM F2052 for magnetically induced displacement force, 5 ASTM F2213 for magnetically induced torque, 6 ASTM F2119-07 (2013) for MRI artifact, 7 ASTM F2182-19e2 for radiofrequency (RF), 8 functionality after exposure to RF, 8 EN 60601-2-33:2010 for gradient-intense 9 sequences, and ISO/TS 10974:2018 for gradient-induced heating. 10
For displacement, torque, and artifact testing, a 3-T Siemens Magnetom Trio clinical scanner was utilized (Siemens, Munich). The system was operated using SYNGO MR B17 software with body coil transmission and reception. For RF heating evaluations, 64 MHz (1.5 T) and 128 MHz (3 T) RF research coils (Resonance Research Inc, Billerica, Massachusetts) were used. For gradient heating evaluations, a gradient research coil (Resonance Research Inc, Billerica, Massachusetts) was used.
Displacement Force Testing
Gravimetric measurements were taken for the test samples used for displacement force evaluations. Magnetically induced displacement force was conducted in accordance with ASTM F2052 Standard Test Method for Measurement of Magnetically Induced Displacement Force on Medical Devices in the Magnetic Resonance Environment. 5 Displacement testing was conducted near the bore entrance and on the axis of the bore in the 3 T scanner where the spatial gradient of the static magnetic field is known to be maximum. The displacement force test fixture consisted of a supported protractor from which the sample was suspended via a lightweight thread.
The displacement force and maximum allowable spatial gradient for each sample were calculated using the corrected angular displacement for each field strength according to ASTM F2052 acceptance criterion. 5 Given the results of the displacement force testing, the maximum allowable spatial gradients at magnetic field strengths of 1.5 and 3 T were determined, as calculated based on the ASTM acceptance criterion (maximum spatial gradient >19 T/m). 5 These were also evaluated by the proportional relationship between the magnetically induced displacement force for a paramagnetic material and the product of the magnitudes of the magnetic field and the spatial gradient of the magnetic field. 11
Torque Testing
Magnetically induced torque testing was conducted according to ASTM F2213 Standard Test Method for Measurement of Magnetically Induced Torque on Medical Devices in the Magnetic Resonance Environment. 6 Testing was conducted near the isocenter of the 3 T scanner to assess the interaction of the maximum uniform static magnetic field with the magnetization in the test sample.
The device was evaluated in three orthogonal orientations for any preferential alignment relative to the static magnetic field as specified in ASTM F2213. 6 As the device demonstrated preferential alignment when suspended in air, it was further evaluated by the low-friction surface method on paper. 6
The acceptance criterion for this test was defined such that if the test sample did not exhibit discernible torque effects, it could be concluded that the device poses no risk in the MRI environment in terms of device pull-off due to torque. Because magnetically induced torque is dependent on the strength of the magnetic field, if the sample passed the acceptance criterion at 3 T, then it also did not pose a hazard at 1.5 T. The test samples had exhibited preferential alignment to the magnetic field; therefore, the induced torque of the samples was further evaluated using a quantitative torque pulley method.
Magnetically induced torque evaluation was conducted using a custom setup designed for quantitative torque measurement. The test setup and test procedure used ASTM F2213 6 as a guide. The quantitative assessment test setup included a low-friction turntable, to which the test sample was affixed using custom fixtures. Testing was performed in three orientations, based on the qualitative torque results. The turntable was placed at isocenter of the 3 T scanner bore where the test sample should experience maximum magnetically induced torque. A nylon thread was connected from the turntable to a force gauge (Wagner Force One Digital Force Gage, Force cell FCMI 5, Wagner Instruments, Greenwich, Connecticut) positioned outside of the scanner bore, where it was verified to be unaffected by the magnetic field.
The test sample was placed on the turntable where it rotated to its preferential alignment. The force gauge stage was then incrementally pulled away from the scanner until the device was perpendicular or antiparallel to its initial alignment, and the maximum force was recorded. This process was performed for both counter-clockwise and clockwise directions for all three orientations.
The maximum acceptable magnetically induced torque of the sensors was set to be less than calculated pull-off torque of the devices. The pull-off torque was calculated by assuming rotation about its central plane and by simplifying the adhesive force to a single point force at the center of mass of the semicircle of the sensor. The resulting pull-off torque was determined to be 0.05 N·m for the CGM 1, CGM 2, and CGM Pro sensors, and 0.018 N·m for the CGM 3 sensor.
Artifact Testing
To assess the maximum image artifact due to wearing the sensor on the arm during MRI, artifact evaluation was conducted according to ASTM F2119 Standard Test Method for Evaluation of MR Image Artifacts from Passive Implants at 3 T. 7 The sensor was placed in copper sulfate solution (CuSO4, Sigma Aldrich product number 35185), which was produced at the standard-specified ratio of 14.4 L of H2O to 1.6 L of 0.1 M CuSO4.
The sensor was evaluated in three orthogonal orientations in the MRI scanner. Images were acquired using two spin-echo sequences, with phase-encoding set initially to the anteroposterior direction and then to the superoinferior direction. In addition, two gradient-echo sequences were acquired using different phase-encoding directions. The sample was rotated 90°, and the imaging procedures were repeated. In this way, each principal axis of the sensor was acquired and analyzed. Spin-echo and gradient-echo images with no sensor present and including a 1.0-cm nylon rod reference object were also acquired for comparison.
Images were analyzed using the software RadiAnt DICOM Viewer Version 2020.1.1 (Medixant, Poznan) for visualization and for quantifying the length of any artifacts. The maximum dimensions of artifact length and diameter were measured and annotated on each image analyzed. As the sensor boundaries could not be discerned within the images, the effective artifact dimensions were calculated as half of the difference between the overall artifact length and the dimensions of the sensor. No acceptance criteria are appropriate since the degree of acceptable artifact can only be determined by the clinician for each patient.
Experimental RF-Induced Heating Testing
Radiofrequency-induced heating evaluations were conducted using the general procedures outlined in the ASTM F2182 standard. 8 A Plexiglas® phantom container, whose dimensions were based on ASTM F2182, 8 was used for testing. Calorimetry testing was performed with the phantom filled with saline in the 64 MHz and 128 MHz RF coils, and the measured and scanner-reported whole-body specific absorption rate (SAR) values were documented for each scan. The acceptance criterion was defined such that the RF-induced temperature rise is less than 6°C over 15 minutes of scanning in Normal Operating Mode at a whole-body console SAR of 2.0 W/kg, as determined by the Whole-Body Modeling described below.
The sample was submerged in the ASTM F2182-specified phantom containing gelled saline solution formulated in accordance with the standard (sodium chloride, Sigma ultra, minimum 99.5% S7653-1KG; poly [acrylic acid], partial sodium salt, lightly cross-linked, 436364-1KG; Sigma-Aldrich, St Louis, Missouri). Conductivity of the gelled saline was verified prior to testing using a NIST-certified 5000 μS/cm reference solution (5000 μS/cm at 25°C, CPAchem). The temperature of the gelled saline was allowed to stabilize in the scan room for at least one hour prior to the commencement of testing.
The sensors were positioned on the periphery of the torso portion of the phantom, with the center of each sensor at the center with respect to the superior-inferior (vertical) dimension, as prescribed by the ASTM standard. The sensors were tested in both the 64 MHz and 128 MHz RF coils, and the sensors were aligned with the scanner axis. Temperature probes were placed above (superior) and below (inferior) the sensor and at the sensor tip. A fourth temperature probe monitored the bulk temperature on the contralateral (opposite) side of the gelled saline phantom.
A custom-pulsed waveform with a 10-Hz frequency was used for testing. The RF signal was delivered at a frequency of 63.66 MHz for 1.5 T testing and 128.23 MHz for 3 T testing. The input power was set so that the whole body SAR was 2.0 W/kg. The temperature was monitored during the 15 minutes of applied RF signal, as well as 2 minutes before and after the signal. The temperature rise was defined as the difference between the maximum measured temperature and the initial temperature.
Gradient-Induced Heating Testing
Gradient-induced heating testing was conducted using the general procedures outlined in ISO 10974. 10 Acceptance criterion for this evaluation was a temperature change <6.0°C with a gradient coil dB/dt = 54 T/s. A sinusoidal waveform with a frequency of 1750 Hz and an amplitude of 1.25 V was used for testing.
The device was exposed to a gradient field|dB/dt| rms of 54.1 T/s based on the maximum Normal Operating Mode|dB/dt| rms exposure for a device at a radial position of 25 cm from isocenter in a scanner with a slew rate of 200 T/m/s as specified in ISO 10974: Clause 9, which is the approximate distance of a device on the lateral upper arm. The magnetic field conditions were measured prior to testing using a 3-axis gradient field probe (Model ELT-400, NARDA Safety Testing Solutions, Hauppauge, New York), and an oscilloscope was used to collect the gradient field data. The|dB/dt| rms was calculated using equation 3 as specified in ISO/TS 10974: Clause 9.
Temperature probes were placed at locations of highest expected heating based on an initial hotspot evaluation. A fourth probe was used to monitor the bulk temperature in the homogeneous region of the gradient coil at least 2 cm from the device. Temperatures were measured using a calibrated Luxtron four-channel optical temperature measurement system (LumaSense Technologies, Oakland, New Jersey). The temperature was monitored during 15 minutes of applied gradient signal, as well as 2 minutes before and after the signal. The temperature rise was defined as the difference between the maximum measured temperature and the initial temperature.
Human Body Modeling
Human body modeling was performed to confirm predicted safety by scaling the experimental change in temperature (ΔT) values to predicted clinically relevant ΔT values. An ANSYS® male human body model 12 was used to characterize whole-body and local SAR values. The human body model includes skin, fat, muscles, bones, and organs. Dielectric and thermal tissue properties were derived from ISO/TS 10974. 10
Because the glucose sensors are intended for use on the upper arm, maximum local SAR values were quantified for a region encompassing the skin up to a 1-cm depth on the side of the upper arm. For local quantitative analysis, a region of interest was defined to encompass the skin of the anterior, lateral, and posterior upper arm with a subdermal depth of up to 1 cm, according to the CGM system’s indications for use. The local SAR values were determined by volume averaging 10 g of tissue to obtain accurate results, remove numerical artifact, and maintain reasonable computing times. The local SAR values were used for calculating predicted ΔT values.
The predicted ΔT values obtained from human body modeling were then scaled to a whole-body SAR of 2.0 W/kg (representing Normal Operating Mode in clinical scanners). These scaled values represent maximum expected heating over at least 15 minutes of scanning with the 2.0 W/kg SAR limitation.
The acceptance criterion was defined such that the RF-induced temperature is less than 6°C over 15 minutes of scanning in Normal Operating Mode at a whole-body console SAR of 2.0 W/kg.
Functionality Testing
The sensor functionality was evaluated on CGM 1, CGM 2, and CGM 3 sensors in both the 1.5 MHz and 3 T scanners by comparing sensor current before with sensor current during and after MRI exposure. Acceptance criterion for this evaluation was glucose error of ≤10 mg/dL for nominal glucose readings of 100 mg/dL. The baseline readings were taken more than 30 minutes from the time of sensor activation. The sensors were placed in saline solution and exposed to RF- and gradient-intense sequences for six minutes total at two locations and in three orientations (36 minutes of total exposure) as specified in ASTM F2182 8 and EN 60601-2-33:2010. 9 The RF-induced heating sequence was used as it is considered an RF-intense test environment. The sensors were exposed to this scan for six minutes at the same location used for RF-induced heating as it is known to exhibit a high electric field. The sensors were tested for functionality following scans in each orientation.
Following the RF-intense exposure, the sensors were exposed to a series of six scanning protocols provided by the MR scanner manufacturer which assess compatibility. The sensors were exposed to these scan sequences at the location previously determined to show a high time-rate-of-change of the gradient field. The sensors were tested for functionality following each scan orientation. In addition, the sensors were tested for functionality one hour after all MRI exposure.
Results
X-Ray Functionality Results
All sensors passed all acceptance criteria following each session of X-ray exposure (Table 4). Sensors were evaluated after each exposure session (front and side orientations) for the first three sessions, and then every 15 minutes of sequential exposures until ten sessions (20 exposures) were completed.
Summary of X-Ray Evaluation Results.
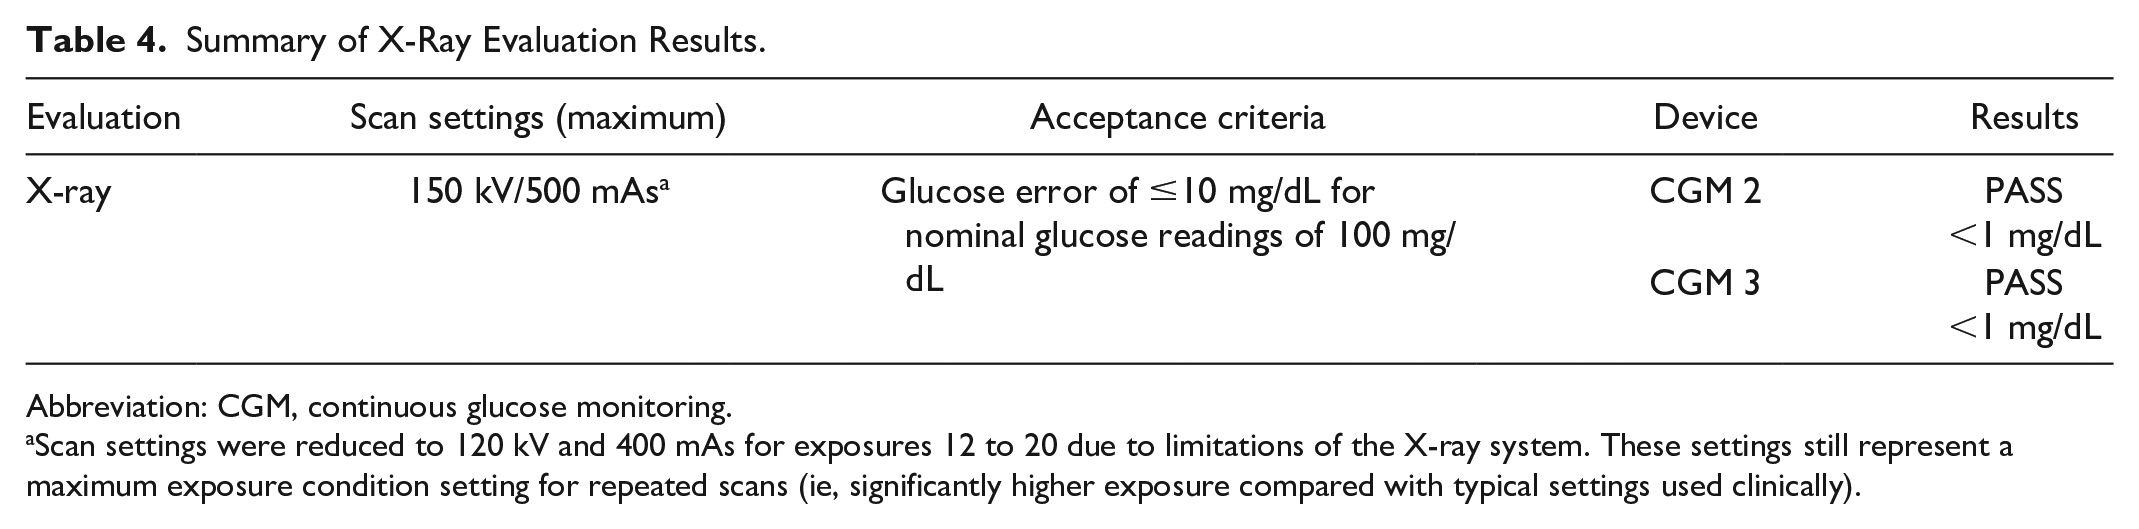
Abbreviation: CGM, continuous glucose monitoring.
Scan settings were reduced to 120 kV and 400 mAs for exposures 12 to 20 due to limitations of the X-ray system. These settings still represent a maximum exposure condition setting for repeated scans (ie, significantly higher exposure compared with typical settings used clinically).
CT Functionality Results
All sensors passed all acceptance criteria following each session of CT exposure (Table 5). Sensors were evaluated after each exposure for the first three sessions, and then every 15 minutes of sequential exposures until ten sessions were completed.
Summary of CT Evaluation Results.
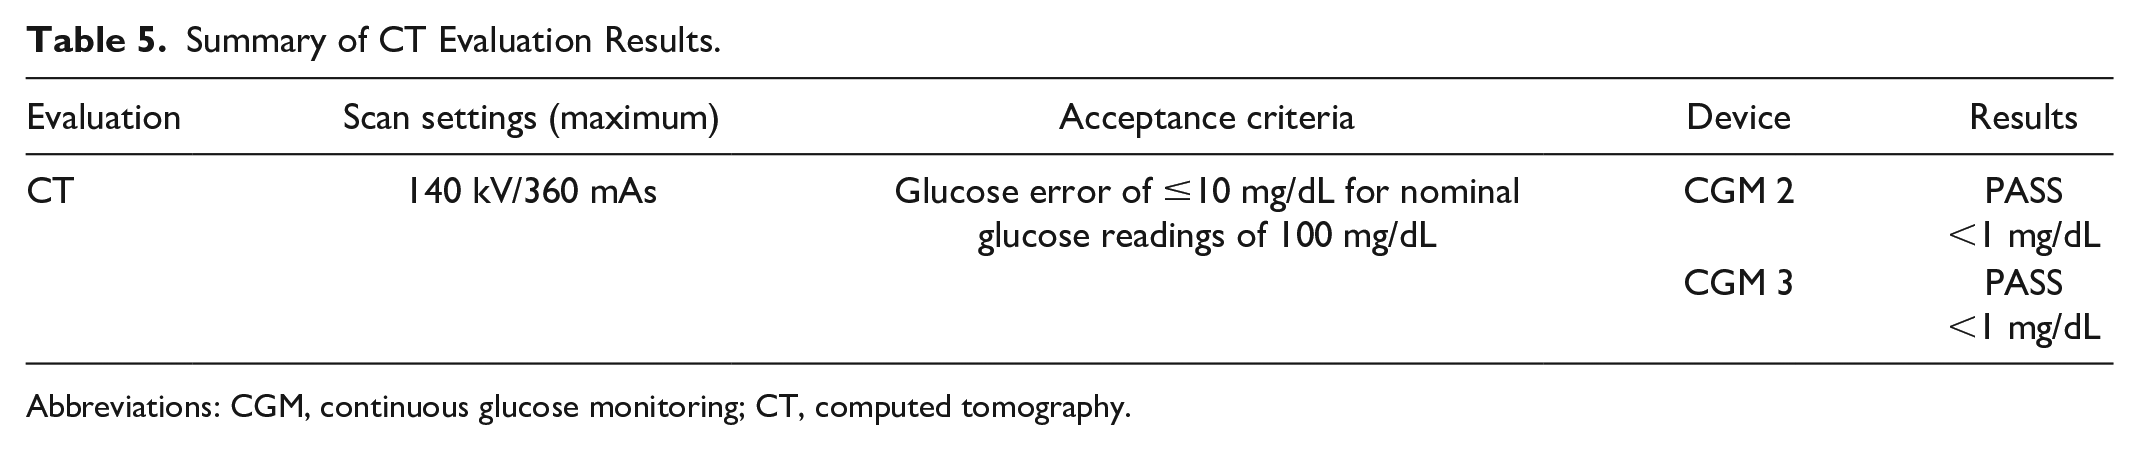
Abbreviations: CGM, continuous glucose monitoring; CT, computed tomography.
MRI Scanning
All sensors passed all acceptance criteria for MRI evaluations, as shown in Table 6.
Summary of MRI Evaluation Results.
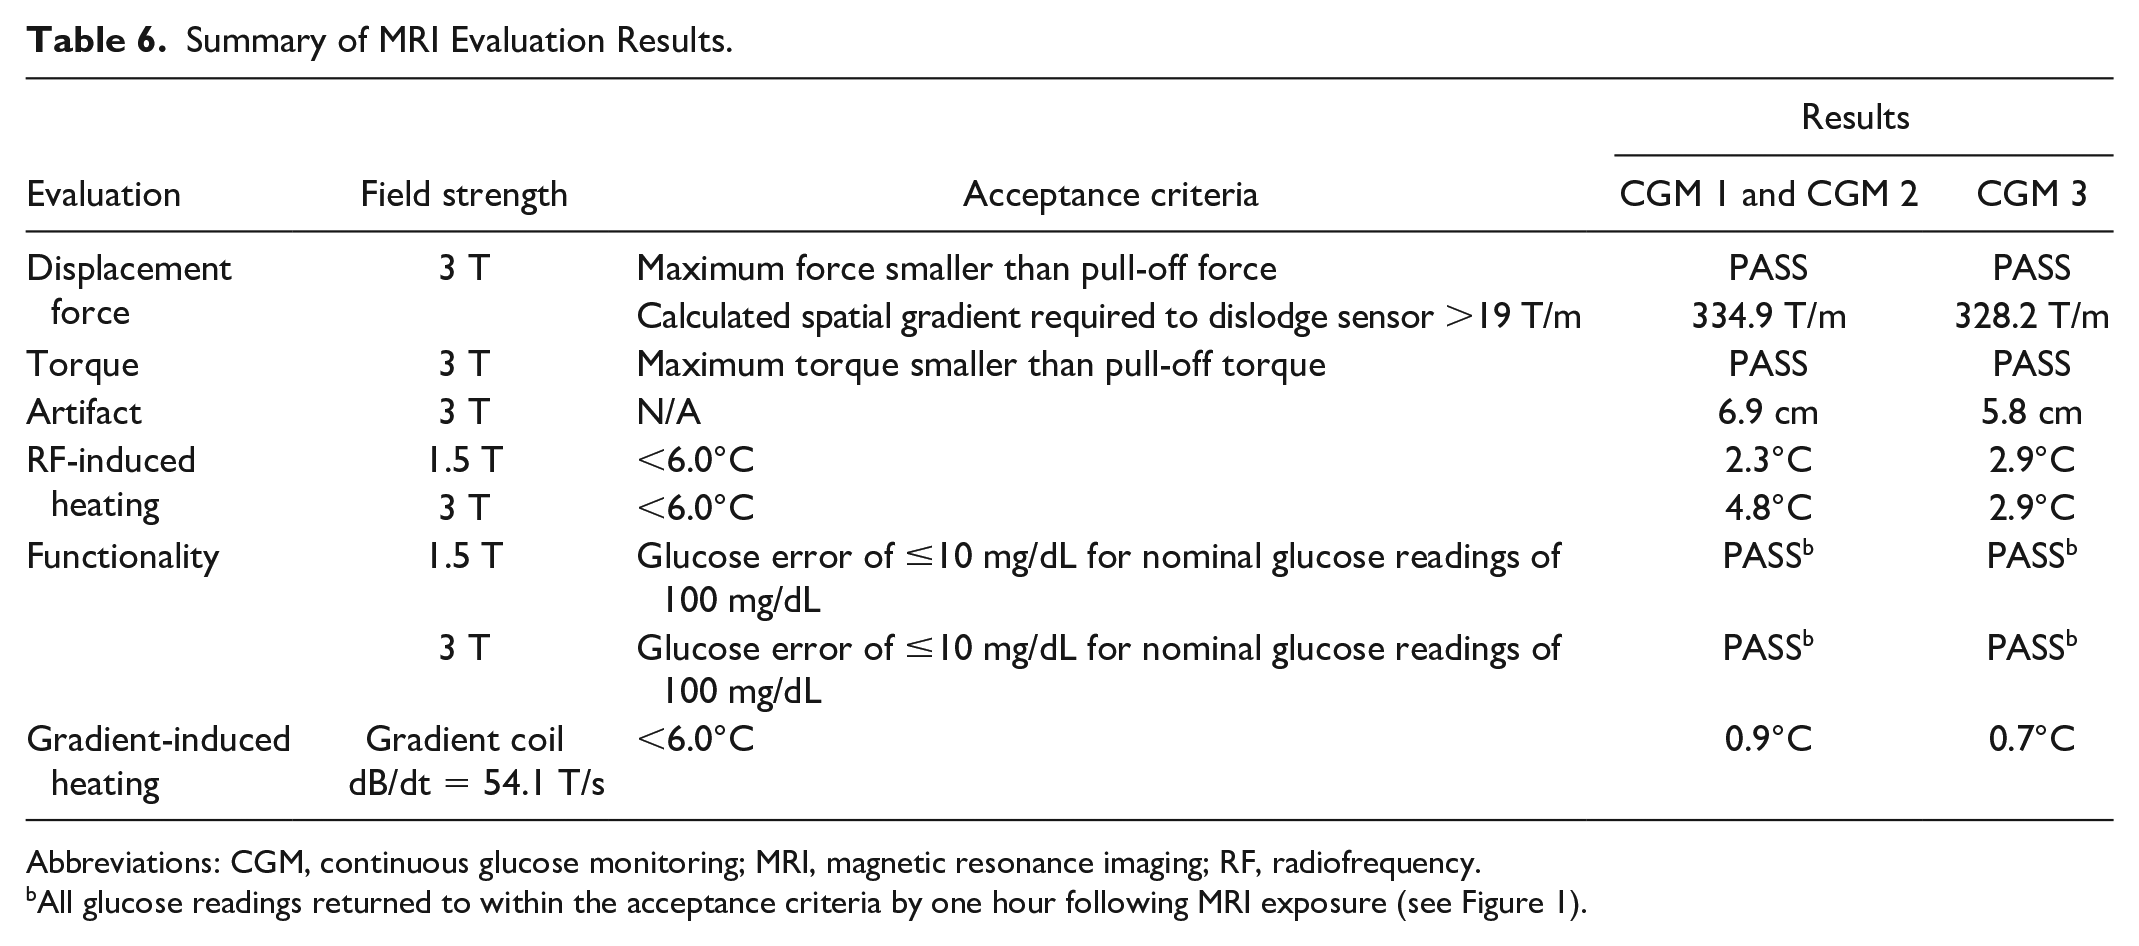
Abbreviations: CGM, continuous glucose monitoring; MRI, magnetic resonance imaging; RF, radiofrequency.
All glucose readings returned to within the acceptance criteria by one hour following MRI exposure (see Figure 1).
Displacement and Torque Testing
The displacement forces for the CGM 1 and CGM 2 sensors were 0.132 and 0.109 N, respectively, which are more than 100× smaller than the force of 15.97 N required to dislodge the sensor. 13 Similarly, the displacement forces for the CGM 3 sensor was 0.063 N, which is more than 100× smaller than the force of 7.95 N required to dislodge the sensor from the skin. 13 The pull-off force was used to calculate the spatial gradient required to dislodge the sensor and compared with the expected maximum spatial gradient of 19 T/m. The calculated spatial gradients required to dislodge the sensor were found to be 334.9 T/m for the CGM 1 and CGM 2 sensors, and 328.2 T/m for the CGM 3 sensors, far exceeding what is expected during clinical MRI procedures. The quantitative torque results showed that the maximum torques produced by the CGM 1, CGM 2, and CGM 3 sensors were significantly less than the pull-off torque of the sensors. Based on these results, the sensors were determined to impose no risks of dislodgement in the MR environment due to induced torque (Table 7).
Quantitative MRI-Induced Torque Evaluation Results.
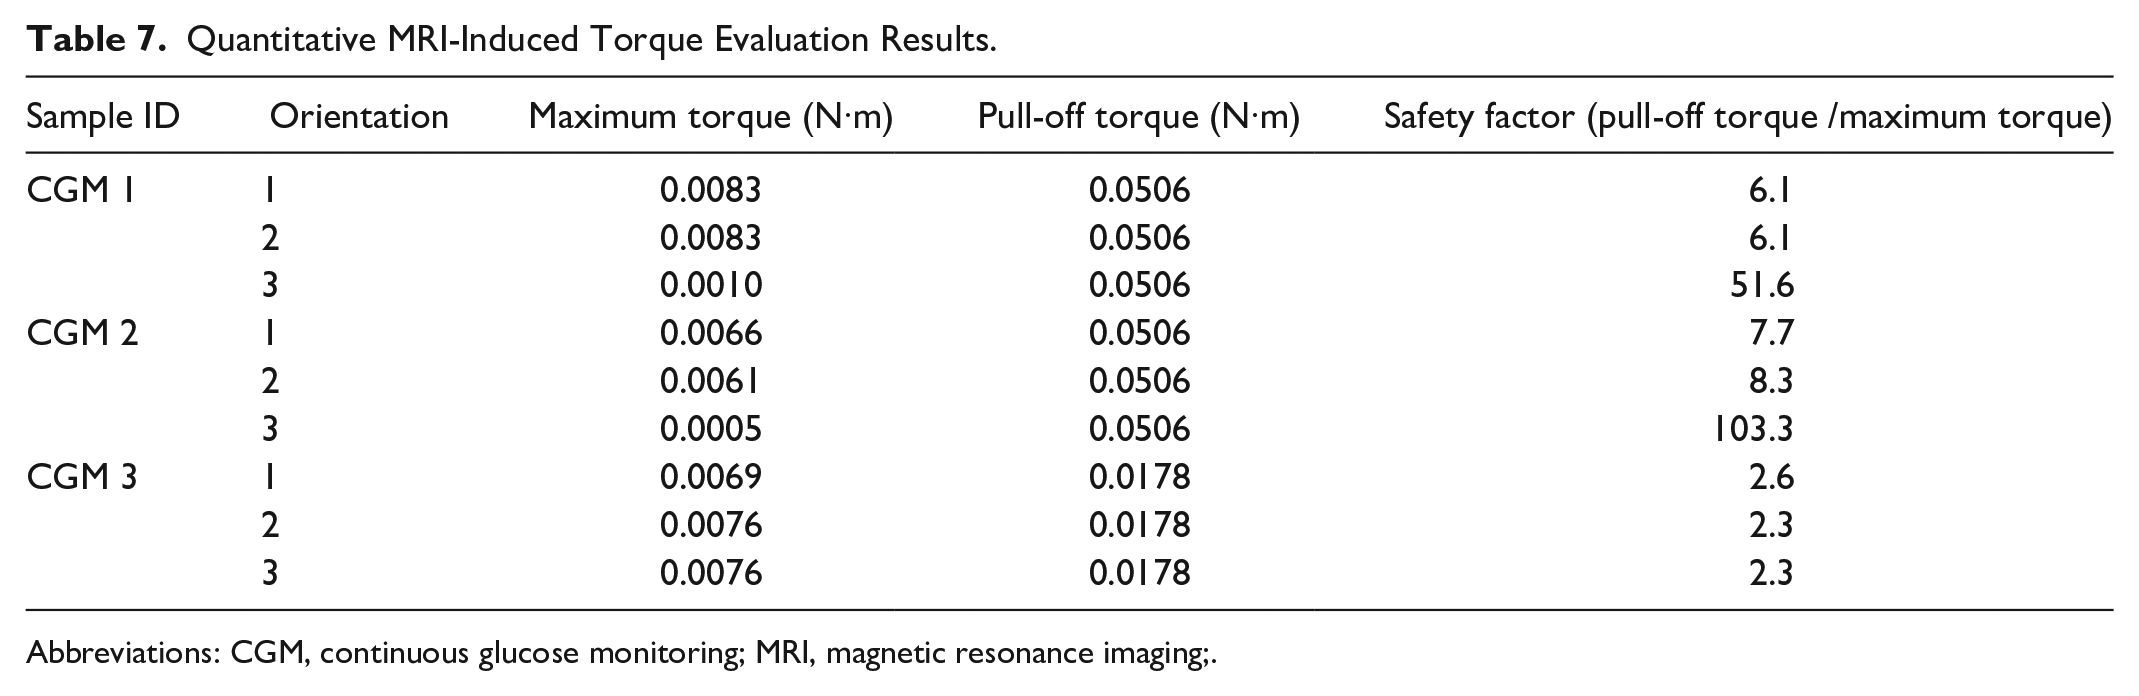
Abbreviations: CGM, continuous glucose monitoring; MRI, magnetic resonance imaging;.
Artifact Testing
The maximum radial artifact at 3 T per the ASTM standard was determined to be 6.9 cm for the CGM 2 sensors and 5.8 cm for the CGM 3 sensor (Table 8).
Maximum Artifact of Test Samples at 3 T for Gradient-Echo and Spin-Echo Sequences.
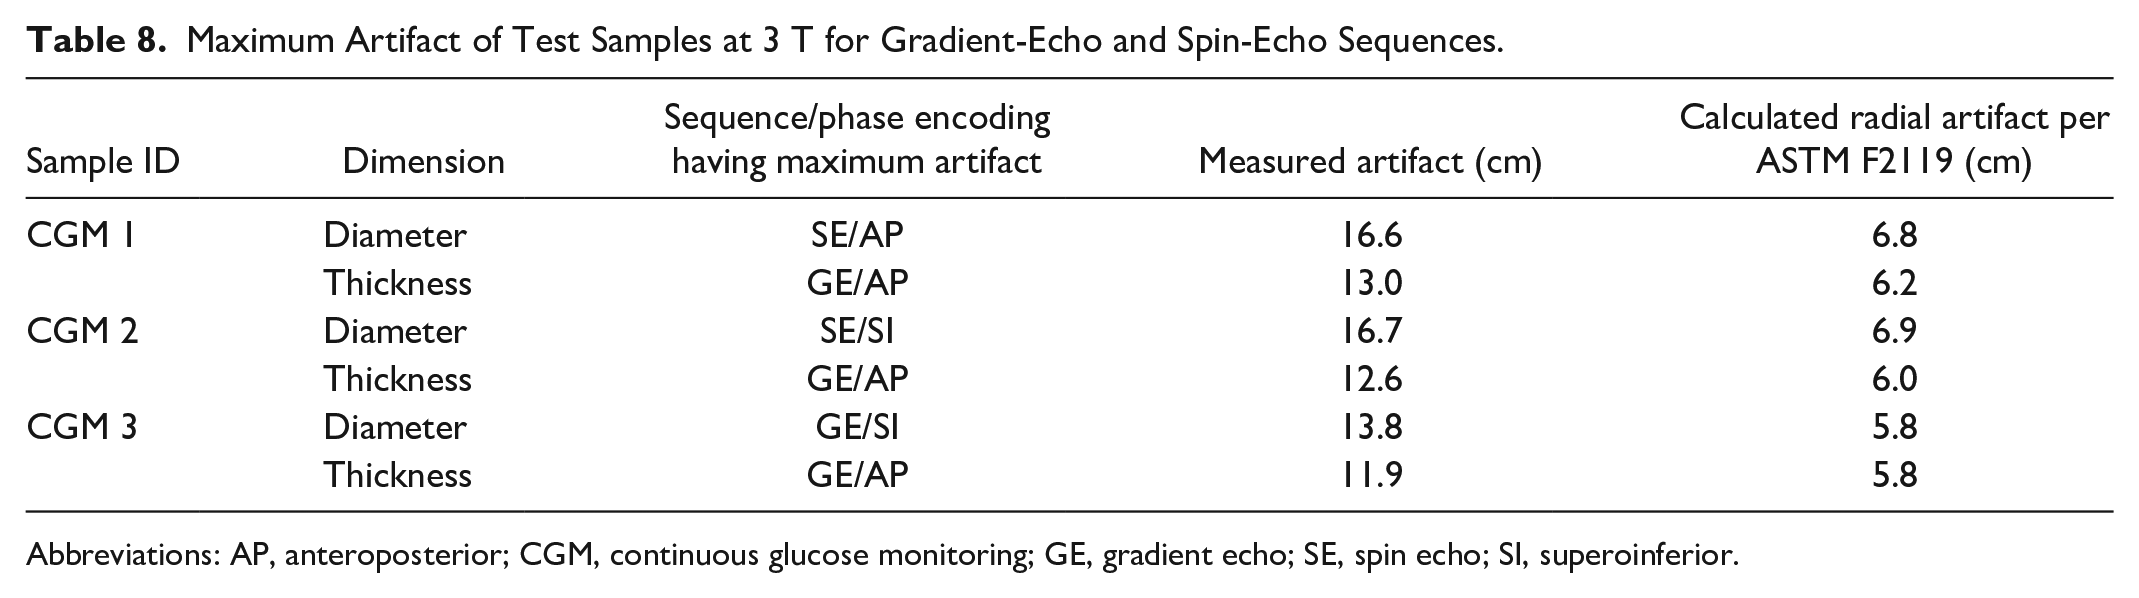
Abbreviations: AP, anteroposterior; CGM, continuous glucose monitoring; GE, gradient echo; SE, spin echo; SI, superoinferior.
Experimental RF-Induced Heating Results
The high electric fields to which the sensors were exposed resulted in temperature rises of 2.1°C at 1.5 T and 2.5°C at 3 T at a SAR of 2.0 W/kg, well below the acceptance criteria of <6.0°C. On additional evaluation of including 9% and 4.3% experimental uncertainty factors for 1.5 and 3 T, respectively, the temperature rises were determined to be 2.2°C at 1.5 T and 2.6°C at 3 T (Table 9).
Summary of MRI RF-Induced Heating Results.

Abbreviations: CGM, continuous glucose monitoring; MRI, magnetic resonance imaging; RF, radiofrequency; SAR, specific absorption rate.
RF heating evaluations were performed at 2.0 W/kg.
Control represents the average of the three probes placed at the approximate locations where they were positioned for sample testing.
Gradient-Induced Heating Testing
During the orientation and hotspot evaluation, there was found to be little to no heating observed in any configuration tested. Therefore, the sensors were oriented with the major conductive plane positioned orthogonal to the test coil field, and with the temperature probes placed over the largest areas of conductive material. The measured temperature change was scaled to a dB/dt of 54.1 T/s using equation 3 in ISO/TS 10974: Clause 9. 10 The gradient exposure 54.1 T/s over 15 minutes resulted in a maximum temperature rise of 0.8°C. Including a 7.6% experimental uncertainty factor, the temperature rise was 0.9°C (Table 10).
Summary of MRI Gradient-Induced Heating Results.
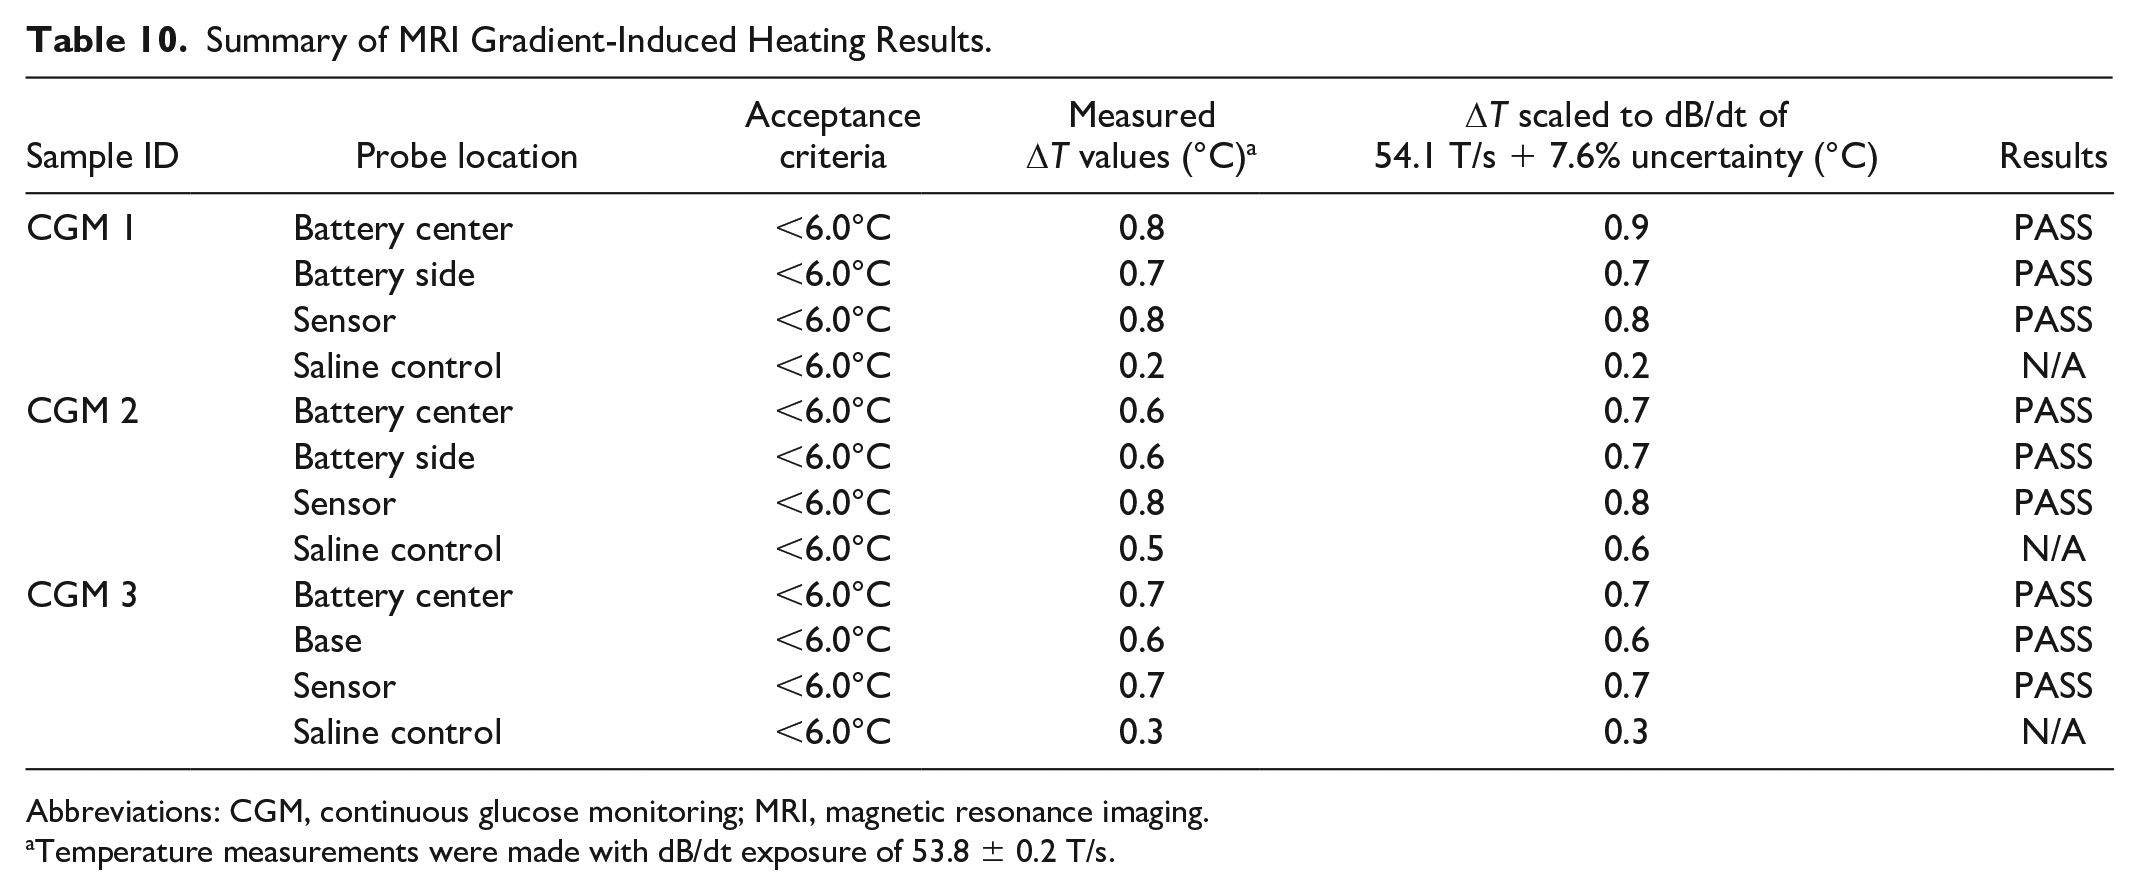
Abbreviations: CGM, continuous glucose monitoring; MRI, magnetic resonance imaging.
Temperature measurements were made with dB/dt exposure of 53.8 ± 0.2 T/s.
Human Body Modeling
As expected, the highest electric fields and levels of SAR occurred in the arms, shoulders, and on the sides of the body when the scanner landmark location was in the proximity of the upper arm. The highest change in temperature was found when the arm was located closest to the magnet bore isocenter. At 1.5 T, all expected change in temperature values were less than 4°C. At 3 T, a maximum scan time limit maintained all ΔT values below 4°C, including a calculated minimum cool down time between scans of six minutes. It was determined that the highest expected heating after a series of scans and cool down times was a total of 6°C relative to body temperature. When evaluating the region of interest isolation at the same landmark locations, the highest levels of volume-average SAR occurred in the center of the arm at both 1.5 and 3 T.
Functionality
During MRI exposure, several sensors failed the acceptance criteria by having induced currents resulting in more than 10 mg/dL change in glucose readings during either the RF or the compatibility protocols. However, all sensors had glucose readings that returned within the 10 mg/dL acceptance criteria one hour after exposure. The sensors are considered to be functioning normally if the glucose readings remain within ±10 mg/dL of their baseline level. It was found that during MRI scanning, all three device models displayed readings outside of this normal operation limit. However, all devices return to their baseline level by one hour following the MRI exposure. In addition, all devices were still at their baseline six hours following MRI exposure. This indicates that while the glucose readings and trend arrows during an MRI scan may not be reliable, the device is not permanently altered and glucose values can still be reliably used one hour after the MRI scanning is complete. The data presented in Figure 1 includes the minimum and maximum change in glucose readings from three replicate devices of each device type at the three stages of exposure (pre-, during, and one hour post-). In addition, six different MRI exposure conditions in a 3 T scanner were pooled together to comprise the “during exposure” plots. Within each group, maximum and minimum data points are overlaid on the average and standard deviation bars. Similar findings were observed when the devices underwent MRI exposure in a 1.5 T scanner.
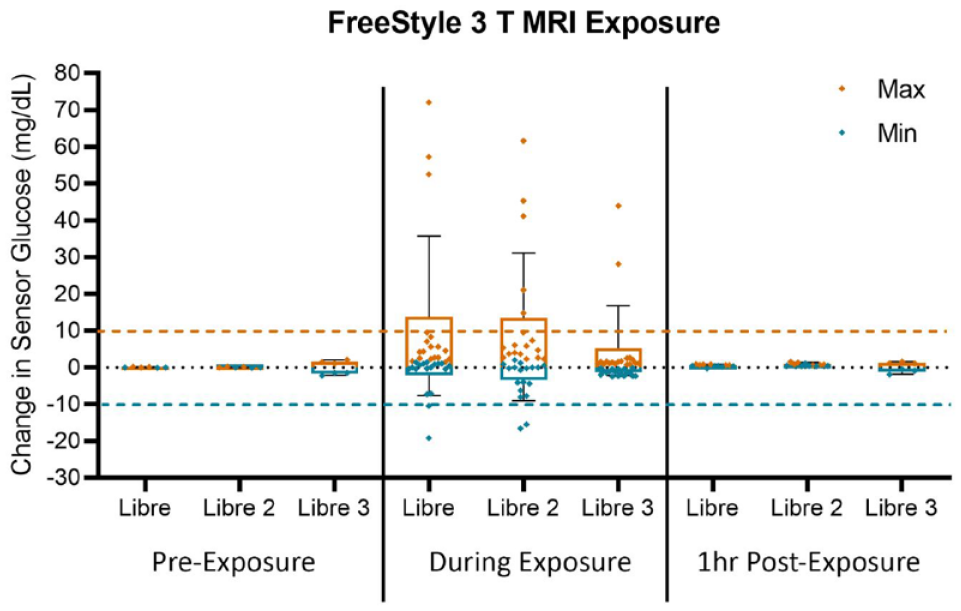
Change is sensor glucose before, during, and after exposure to MRI protocols at 3 T. Abbreviation: MRI, magnetic resonance imaging.
Discussion and Conclusions
Concerns regarding the potential impacts of radiologic scanning on CGM device performance and patient safety have prompted device manufacturers to instruct patients to remove sensors when undergoing X-ray, CT, and MRI procedures. However, the actual effects of these procedures have not previously been assessed. We report findings from comprehensive evaluations of sensor response and functionality following a series of high exposure conditions in X-ray, CT, and MRI scanning procedures.
For X-ray and CT evaluation, the CGM 2 (and by extension CGM 1 and CGM Pro) and CGM 3 sensors were both tested under three different radiation exposure conditions: (1) direct radiation; (2) indirect radiation; and (3) scattered radiation. At the maximum exposure scan settings allowable by each scanner, all devices passed the functionality testing acceptance criteria in all exposure conditions and orientations after each repeated exposure session. Given that a single sensor is only on the patient’s arm for up to 14 days, and the maximum exposure conditions were used for each scan, the amount of X-ray and CT radiation is well beyond what a single device would be exposed to clinically. Therefore, these data demonstrate that the sensor functionality is not impacted by X-ray or CT exposure, and that patients can continue to wear and use these devices during and after imaging procedures. It was also found that the sensor components are clearly visible with both X-ray and CT imaging modalities, and therefore allow clinical accounting when reading images. In addition, there is minimal image artifact created by the device.
A patient with a sensor can be safely scanned in an MRI system with a static magnetic field of 1.5 T or 3 T and the maximum spatial field gradient is 4000 G/cm (40 T/m). When scanning in a 1.5 T and 3 T scanner, patients can be scanned with a whole-body averaged SAR of 2.0 W/kg (Normal Operating Mode) without landmark placement restrictions. Importantly, the scanner SAR restrictions apply only to a whole-body RF coil using a circularly polarized transmit mode. For other RF coil types (eg, extremity, head, neck), appropriate SAR restrictions should be applied to ensure that similar levels of localized SAR are achieved. Under these scanning conditions, the sensors are expected to produce a maximum temperature rise of ≤4.3°C after 15 minutes of continuous scanning. When scanning in a 1.5 T scanner, a patient can be scanned for up to one hour of continuous scanning without a cooling period; however, when scanning in a 3.0 T scanner a patient can be scanned up to 13 minutes of scanning between the T12 vertebra and the hip, or up to 15 minutes of scanning above the T12 vertebra and below the hip, with a cooling period of 6 minutes between scans. Furthermore, the experimental RF-induced heating and gradient-induced heating testing showed that all of the sensors met the acceptance criteria of having any temperature increase of <6.0°C.
In phantom-based testing, we showed that the image artifact caused by CGM 2 (and by extension CGM 1 and CGM Pro) sensors extends radially approximately 6.9 cm from the device. For the CGM 3 sensor, the image artifact extends radially approximately 5.8 cm. Although the sensors may produce inaccurate glucose readings during the MRI exposure time under the conditions reported, functional testing showed that the sensors returned to normal operation by one hour following MRI exposure.
Our evaluations also showed that all of the sensors are at low risk of dislodgement during MRI procedures, either due to induced displacement or due to torque under the expected MRI exposures.
This evaluation was done as an extension of Electrical Safety Compliance testing to assess the effects on the sensors. A clinical study is not justified since the results show no lasting effect on the sensors. The sensors have a 14-day lifespan and there is no rationale that there is a build-up effect from transient results.
In summary, the results of testing indicated that the Abbott sensors maintained functionality following a series of high exposure conditions in both X-ray and CT scanning systems, and that the sensors were easily visible and identifiable when scanned using clinically relevant scanning parameters. Therefore, these findings demonstrate that patients can continue to wear and use their sensors during and after imaging. The nonclinical MRI testing described here demonstrated that the sensors are MR conditional, or pose no know hazards when used under the specified MRI environment and use conditions.
Footnotes
Abbreviations
AP, anteroposterior; BGM, blood glucose monitoring; CGM, continuous glucose monitoring; CT, computed tomography; GE, gradient echo; MRI, magnetic resonance imaging; SAR, specific absorption rate; SE, spin echo; SI, superoinferior.
Declaration of Conflicting Interests
The author(s) declared no potential conflicts of interest with respect to the research, authorship, and/or publication of this article.
Funding
The author(s) disclosed receipt of the following financial support for the research, authorship, and/or publication of this article: This research is funded by Abbott Diabetes Care. The authors are employees of Abbott Diabetes Care Inc.