
Abstract

Keywords
Clinical benefits of the FreeStyle Libre® flash glucose monitoring system (FSL) (Abbott Diabetes Care, Alameda, CA) have been well established.1,2 Users of the system may see their glucose values on a reader or a smartphone app, FreeStyle LibreLink, which facilitates seamless data access for healthcare providers and caregivers. This analysis compared glucose metrics between users of the app and readers in the United States.
De-identified glucose data uploaded from FSL users in the United States between May 31, 2020–May 31, 2021 was used to assess users’ mean glucose, coefficient of variation (CV), percent time in the range 70–180 mg/dL (TIR), percent time above 180 mg/dL (TA180), scanning frequency, and median percent time below 70 mg/dL (TB70) (due to a skew in TB70 distribution).
Reader and app users were separately rank-ordered by mean scan frequency. For each device type (app or reader), the analysis selected the 7 bins of 2000 devices with contiguous ranking (total 14,000 users) which had a mean closest to target bin values: 4, 5, 6, 7, 8, 9, and 10 daily scans. These target bin values captured the interquartile ranges of daily scans for both device types. Within each bin selection the range of users’ scan frequencies was narrow. Glucose control measures were assessed by device type—comparisons were performed within each bin via independent samples t-tests for mean values and comparison of bootstrapped 95% confidence intervals of the median for TB70.
Overall, app users had a mean TIR of 65.3%, approximately 5% higher than that of reader users (60.5%). App users also had a mean TA180 of 31.3%, mean average glucose of 162.0 mg/dL, and a mean glucose CV of 31.9%, while reader users’ respective measures were 36.0% TA180 (+4.7% greater than that of app users), 171.5 mg/dL avg glucose (+9.5 mg/dL), and 33.6% CV (+1.7%).
Across all scan frequencies, app users had higher TIR than reader users (range for difference 2.8%-6.3%), less TA180 (2.8%-6.4%), lower average glucose (4.1-13.6 mg/dL), and lower glucose CV (1.3%-1.9%) (see Figure 1). TB70 for reader and app was less than 2% in all bins; app users did appear to have slightly lower TB70. Differences in TB70 were small and only significant at 4,5, and 7 scans/day (maximum difference of 0.5% at 5 scans/day). For all other glucose metrics, t-tests yielded P < 0.001 for the differences at all frequencies, with the exception of the difference in average glucose specifically at 4 daily scans (P = 0.005).
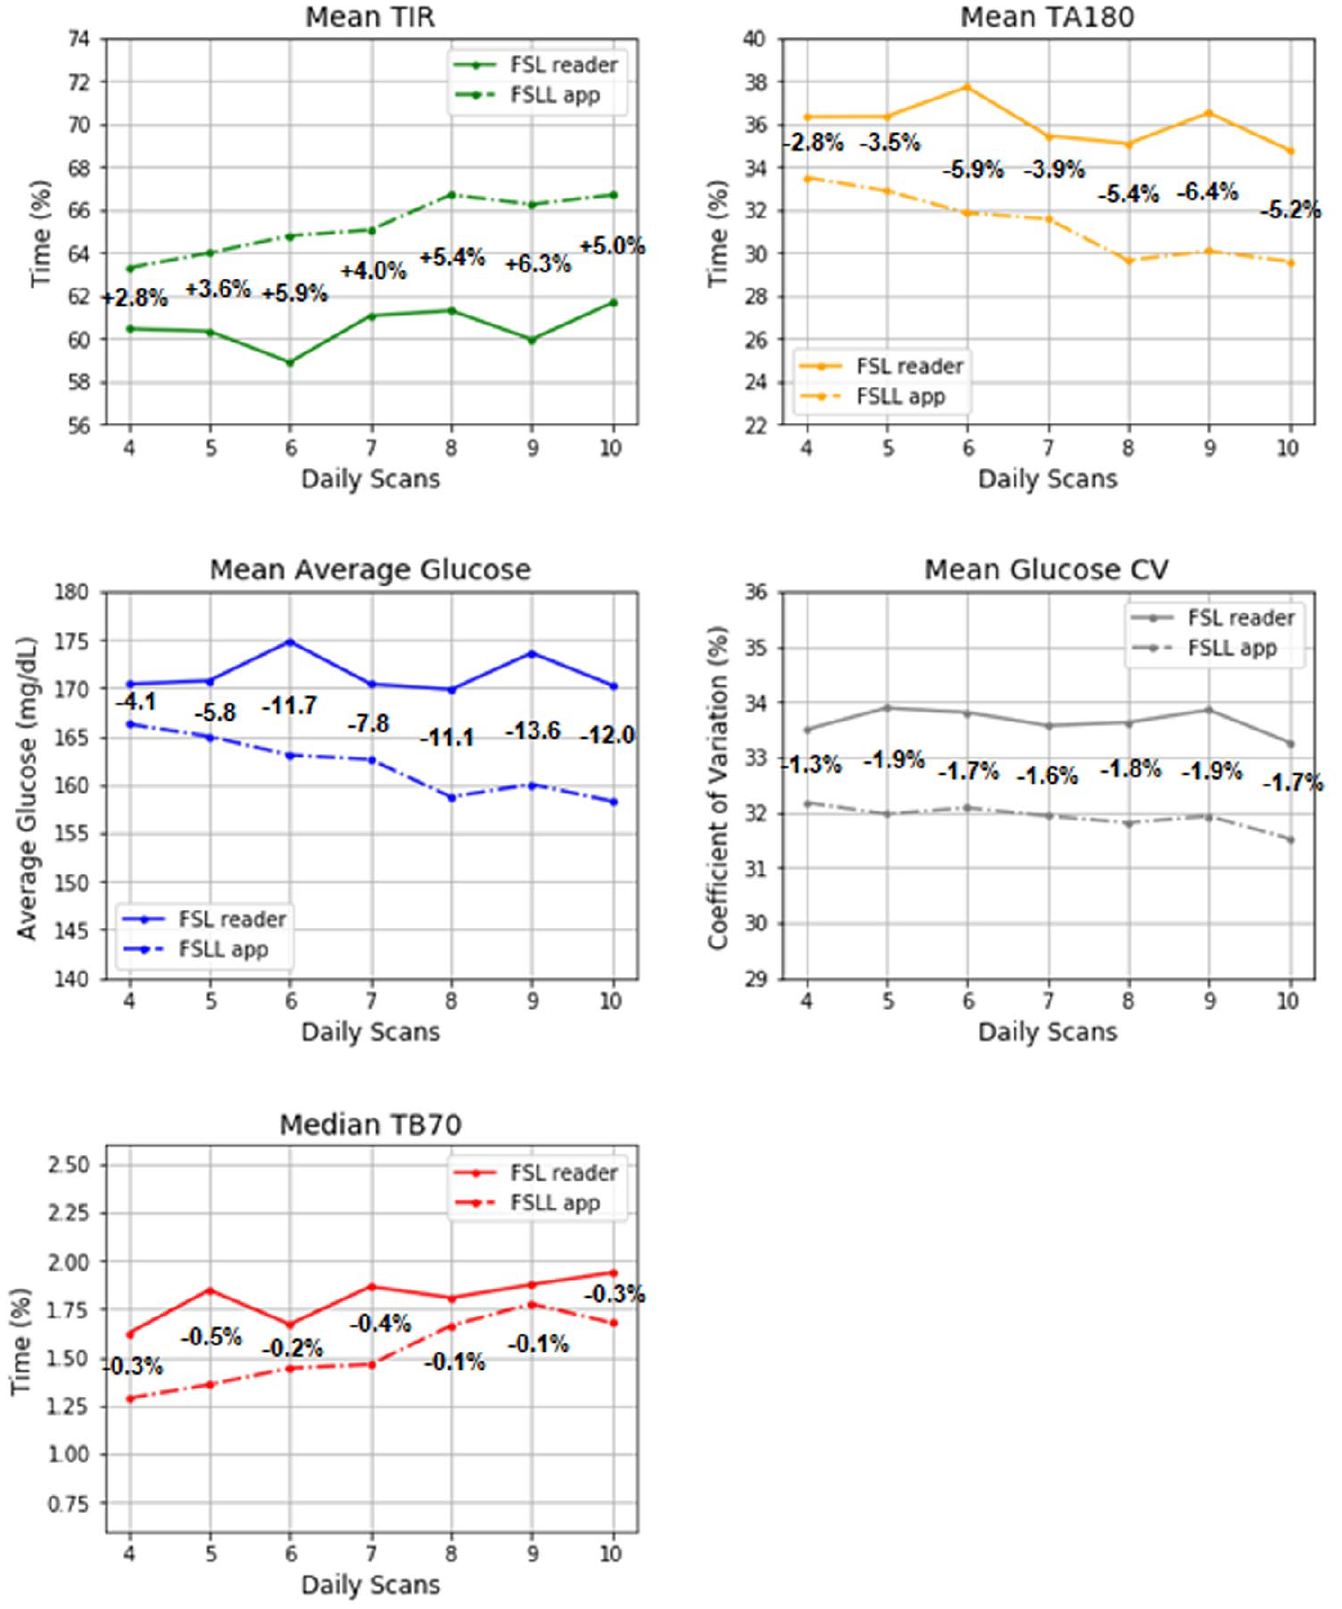
Comparison of glucose metrics between reader (solid line) and app (dashed line) users at 4, 5, 6, 7, 8, 9, and 10 daily scans.
In this retrospective analysis, app users experienced lower glucose variability, lower average glucose, less time in hyperglycemia, and greater time in range than reader users. The observed differences may be driven by the data sharing features inherent in the app. By sharing glucose data with one’s clinical team, healthcare professionals and patients may be able to make more informed treatment decisions. The difference in metrics may also be influenced by unknown demographic details (e.g., age, socioeconomic status, education), diabetes type and treatment, or other health differences between the groups.
Footnotes
Acknowledgements
None
Abbreviations
(CV) Coefficient of variation, (FSL) FreeStyle Libre, (TA180) Time above 180 mg/dL, (TB70) Time below 70 mg/dL, (TIR) Time in range (% time between 70 and 180 mg/dL)
Declaration of Conflicting Interests
The author(s) declared the following potential conflicts of interest with respect to the research, authorship, and/or publication of this article: All authors are employees of Abbott.
Funding
The author(s) disclosed receipt of the following financial support for the research, authorship, and/or publication of this article: All work was funded by Abbott.