
Abstract
Introduction:
Assessment of glucose exposure via glycated hemoglobin A1c (HbA1c) has limitations for interpretation in individuals with diabetes and chronic kidney disease (CKD). The glucose management indicator (GMI) derived from continuous glucose monitoring (CGM) data could be an alternative. However, the concordance between HbA1c measured in laboratory and GMI (HbA1c-GMI) is uncertain in individuals with CKD. The purpose of this study is to analyze this discrepancy.
Material and method:
We performed a multicentric, retrospective, observational study. A group of individuals with diabetes and CKD (n = 170) was compared with a group of individuals with diabetes without CKD (n = 185). All individuals used an intermittently scanned continuous glucose monitoring (isCGM). A comparison of 14-day and 90-day glucose data recorded by the isCGM was performed to calculate GMI and the discordance between lab HbA1c and GMI was analyzed by a Bland-Altman method and linear regression.
Results:
HbA1c-GMI discordance was significantly higher in the CKD group versus without CKD group (0.78 ± 0.57 [0.66-0.90] vs 0.59 ± 0.44 [0.50-0.66]%, P < .005). An absolute difference >0.5% was found in 68.2% of individuals with CKD versus 42.2% of individuals without CKD. We suggest a new specific formula to estimate HbA1c from the linear regression between HbA1c and mean glucose CGM, namely CKD-GMI = 0.0261 × 90-day mean glucose (mg/L) + 3.5579 (r2 = 0.59).
Conclusions:
HbA1c-GMI discordance is frequent and usually in favor of an HbA1c level higher than the GMI value, which can lead to errors in changes in glucose-lowering therapy, especially for individuals with CKD. This latter population should benefit from the CGM to measure their glucose exposure more precisely.
Keywords
Introduction
Diabetes mellitus is a disease marked by chronic hyperglycemia resulting from a defect in secretion and/or action of insulin. This hyperglycemia leads to microangiopathic (nephropathy, retinopathy, neuropathy) and macroangiopathic (myocardial infarction, stroke, peripheral arterial disease) complications.1,2
Although measurement of glycated hemoglobin A1c (HbA1c) has become the cornerstone of diabetes monitoring in clinical practice, the role of this biomarker in reflecting long-term glycemic control in individuals with diabetes and chronic kidney disease (CKD) has been questioned. 3 Indeed, the assessment of glycemic control by HbA1c in individuals with diabetes and CKD has limitations. 4 Some non-glycemic factors may affect HbA1c levels, such as anemia, 5 shorter or longer erythrocyte lifespan, erythropoietin, or martial therapy. 6
Therefore, in these individuals with diabetes and CKD, blood glucose monitoring became an important guide of diabetes management. 7
Until now, self-monitoring of blood glucose was achieved by capillary blood glucose tests. But, new medical devices, such as continuous glucose monitoring (CGM) or intermittently scanned continuous glucose monitoring (isCGM), now provide an effective method for controlling glucose levels.8,9 Studies on the use of CGM or isCGM sensors in the individuals with diabetes with CKD are limited.
Given these pitfalls in interpreting HbA1c in CKD, it is important to investigate new CGM-derived metrics including glucose management indicator (GMI). 10 The GMI equation was developed to estimate HbA1c from the mean interstitial glucose provided by the CGM [GMI (%) = 3.31 + 0.02392 × mean glucose (mg/dL)]. 10
Some studies reported discordances between lab HbA1c and GMI, but data are still limited in individuals with diabetes and CKD.10,11 The purpose of this study is to compare the relationship between HbA1c measured in the laboratory and GMI calculated from 14 and 90 days CGM data recorded in a large cohort of individuals with diabetes and CKD compared to individuals with diabetes without CKD.
Material and Methods
We conducted a retrospective, cross-sectional, multicenter, observational study approved by the qualification commission for research projects of the University of Rouen. We performed a review of isCGM users seen at the University of Rouen, University of Liege, and Mouscron Hospital diabetes care centers from January 2019 to June 2021. All individuals with diabetes used the isCGM FreeStyle® Libre™ 1 (Abbott Diabetes Care, Alameda, CA) (FSL1). FSL1 is a factory-calibrated sensor and do not require finger stick blood glucose calibrations and had no hypo/hyperglycemia alarms.
Although it is recommended that only CGM data captured at >70% over 14 days are sufficient to estimate HbA1c,12,13 we also recorded CGM data up to 90 days to maximally assess the glucose exposure associated with laboratory-measured HbA1c. Therefore, we selected individuals with diabetes and CKD whose laboratory-measured HbA1c was documented and associated with concomitant CGM data downloaded at 14 and 90 days.
The CGM-derived data collected were the percentages time in hypoglycemia <70 mg/dL (<3.9 mmol/L), time in hyperglycemia >180 mg/dL (>10 mmol/L), time in range (TIR) 70 to 180 mg/dL (3.9-10.0 mmol/L), mean interstitial glucose, coefficient of glucose variation (GV% = SD/mean interstitial glucose), and GMI. 12
Demographic characteristics such as type and duration of diabetes mellitus (DM), age, sex, body mass index (BMI), etiology of CKD, and microvascular and macrovascular-related diabetes complications were extracted from the computerized medical records. Glucose-lowering therapy, erythropoiesis-stimulating agents (EPO), martial supplementation, and red blood cell transfusions were recorded.
HbA1c, hemoglobin (Hb), hematocrit, and iron status were sought, the individuals were considered anemic for men if the Hb value was <13 g/dL and for women if <12 g/dL. 14
Individuals were stratified into stages of CKD according to the Kidney Dialysis Outcomes Initiative (KDOQI) classification based on the MDRD formula for calculating the estimated glomerular filtration rate (eGFR) (mL/min) as follows:
Stage 1: eGFR above 90; stage 2: eGFR between 60 and 89; stage 3a: eGFR between 45 and 59; stage 3b: eGFR between 30 and 44; stage 4: eGFR between 15 and 29; and stage 5: eGFR less than 15). 15
If eGFRs >60 mL/min CKD was excluded. The lab tests selected had to be performed within 30 days before the CGM analysis, except for the HbA1c which had to be performed within 7 days.
The exclusion criteria were age <18 years, pregnancy, acute CKD (<six months), red blood cell transfusions, and insufficient CGM data according to guideline criteria to estimate HbA1c. 12
Two groups of individuals with diabetes and CKD and without CKD (no-CKD) were established.
First, demographic characteristics, laboratory tests, and isCGM at 14- and 90-day data were compared between CKD and no-CKD groups.
Second, the GMI prediction of HbA1c from 14-day isCGM data was compared with 90-day isCGM data in each group, respectively.
Third, the HbA1c-GMI difference was calculated for individuals in each group and compared between the groups.
If the HbA1c-GMI difference in the CKD group is greater than in the no-CKD group, we calculate a new linear regression to calculate a GMI formula specific to the CKD group.
Finally, in both groups, demographic characteristics, comorbidities, laboratory tests, and isCGM parameters were compared between subjects with an HbA1c-GMI difference >0.5% and <0.5%, in order to identify which variables influence this difference.
Statistical Analysis
Categorical variables were reported as frequencies (%), and continuous variables were reported using means ± standard deviation (SD) (with their 95% confidence interval [95% CI]). Chi-square tests were used to compare categorical variables and t-test or analysis of variance (ANOVA) for continuous variables. The paired t-test was used to compare the prediction of HbA1c by the GMI formula from 14- and 90-day CGM data. Individuals were subdivided as a percentage ratio based on the HbA1c-GMI difference threshold. If a new GMI formula specific to the CKD group is calculated, we will use a linear regression relating the 90-day mean glucose values represented on the x-axis to the laboratory HbA1c on the y-axis.
The relationship between HbA1c and GMI from 90 days CGM data was studied using the Bland-Altman method in CKD and no-CKD groups.
The relationship between the HbA1c-GMI difference and recorded parameters was analyzed by univariate analysis. In a second time, a multivariate analysis will be performed if certain parameters that may influence the HbA1c-GMI discordance in the CKD group are statistically significant in the univariate analysis.
Variables with p
Results
A total of 355 individuals with diabetes were eligible for the study based on the selected criteria.
In total, 59% were male, 73% were type 1 DM, 19.7% were type 2 DM, and 7.3% other types of diabetes. Individuals were divided into two groups: with CKD (n = 170) and no-CKD (n = 185).
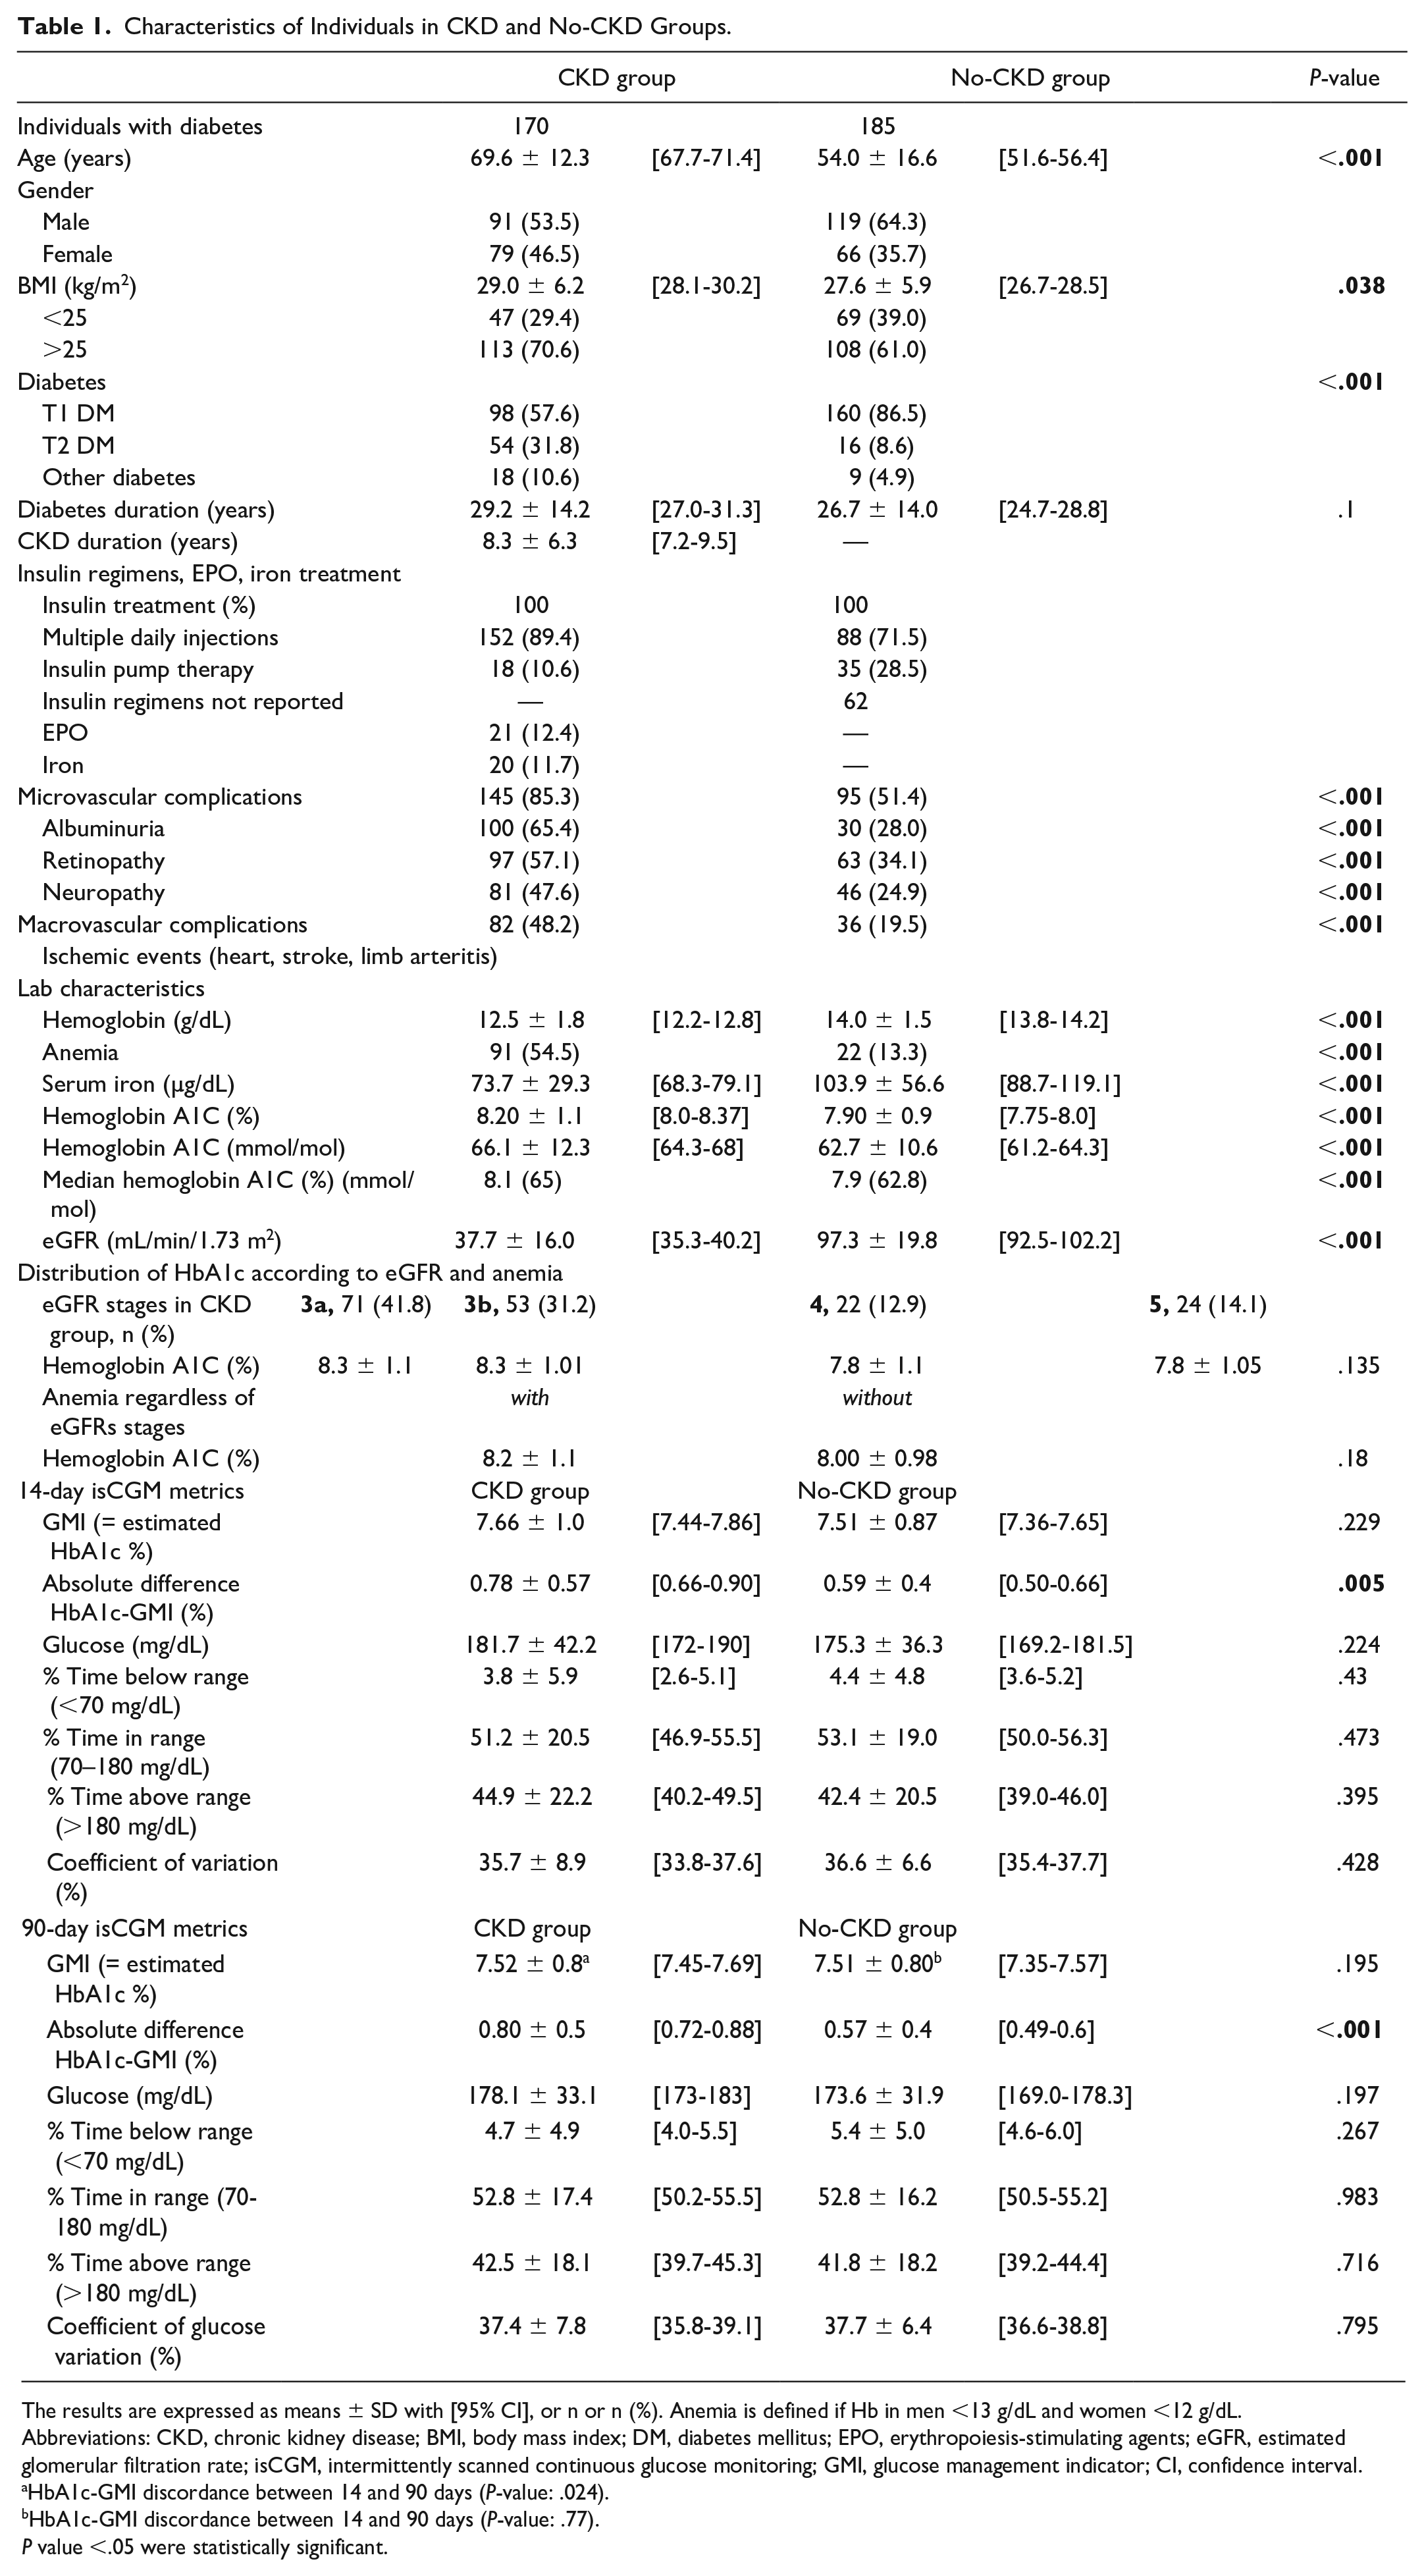
Main demographic characteristics are reported in Table 1.
Characteristics of Individuals in CKD and No-CKD Groups.
The results are expressed as means ± SD with [95% CI], or n or n (%). Anemia is defined if Hb in men <13 g/dL and women <12 g/dL.
Abbreviations: CKD, chronic kidney disease; BMI, body mass index; DM, diabetes mellitus; EPO, erythropoiesis-stimulating agents; eGFR, estimated glomerular filtration rate; isCGM, intermittently scanned continuous glucose monitoring; GMI, glucose management indicator; CI, confidence interval.
HbA1c-GMI discordance between 14 and 90 days (P-value: .024).
HbA1c-GMI discordance between 14 and 90 days (P-value: .77).
P value <.05 were statistically significant.
Individuals with diabetes in the CKD group were older (69.6 ± 12.3 [67.7-71.4] vs 54.0 ± 16.6 [51.6-56.4] years, P < .001), had a higher BMI (29.0 ± 6.2 [28.1-30.2] vs 27.6 ± 5.9 [26.7-28.5] kg/m2, P = .038), and type 2 DM and other diabetes was more frequent than in the no-CKD group. The mean duration of CKD was 8.2 ± 6.3 [7.2-9.5] years. The etiology of the renal disease was diabetic nephropathy in 71.2% of cases. The eGFR stages were distributed as follows: stage 3a: 41.8%; stage 3b: 31.2%; stage 4: 12.9%; and stage 5: 14.1%. The duration of diabetes was not significantly different between the two groups (26.7 ± 14.0 [24.7-28.8] vs 29.2 ± 14.2 [27.0-31.3] years, P = .1).
All individuals were treated with a basal-bolus insulin regimen, treatment with EPO concerned 12.4% and martial supplementation 11.7% in CKD group.
Micro and macroangiopathy-related diabetes complications were more frequent in CKD group: 85.3% versus 51.4% (P < .001) and 48.2% versus 19.5% (P < .001), respectively.
For the lab characteristics, hemoglobin values were lower in the CKD group (12.5 ± 1.8 [12.2-12.8] vs 14.0 ± 1.5 [13.8-14.2] g/dL; P < .001) with a higher proportion of anemia (54.5% vs 13.3%; P < .001). Iron serum was lower in CKD group (73.7 ± 29.4 [68.3-79.1] vs 103.9 ± 56.6 [88.7-119.1] µg/dL, P < .001). HbA1c was significantly higher in the CKD group (8.2 ± 1.1 [8.0-8.37] vs 7.9 ± 0.9 [7.75-8.0]%, P < .001) (66.1 ± 12.3 [64.3-68] vs 62.7 ± 10.6 [61.2-64.3] mmol/mol, P < .001).
In the CKD group, HbA1c was not different between eGFR stages (P = .135), nor for the subjects with or without anemia, regardless of eGFR stages (P = .18).
There was no difference in 14- or 90-day isCGM metrics (GMI, mean glucose, TIR, time spent in hypo/hyperglycemia, and GV%) between CKD versus no-CKD groups. Only the comparison between the absolute difference HbA1c-GMI was significantly higher in the CKD group versus no-CKD group at 14 days (0.78 ± 0.57 [0.66-0.90]% vs 0.59 ± 0.4 [0.50-0.66]%, P = .005) and 90 days (0.80 ± 0.5 [0.72-0.88]% vs 0.57 ± 0.4 [0.49-0.6]%, P < .001).
We analyzed in each group whether the GMI calculated from CGM data after 14 and 90 days predicted the HbA1C measured in the laboratory. In the no-CKD group, the mean lab HbA1C was 7.9% (62.7 mmol/mL) while the mean GMI were 7.51% (58 mmol/mol) regardless of the time period (P = .77). In the CKD group, the mean HbA1C was 8.2% (66.1 mmol/mol) and mean GMI were significantly different at 14 and 90 days (7.66 [60] vs 7.52% [59 mmol/mol], P = .024), respectively (Table 1).
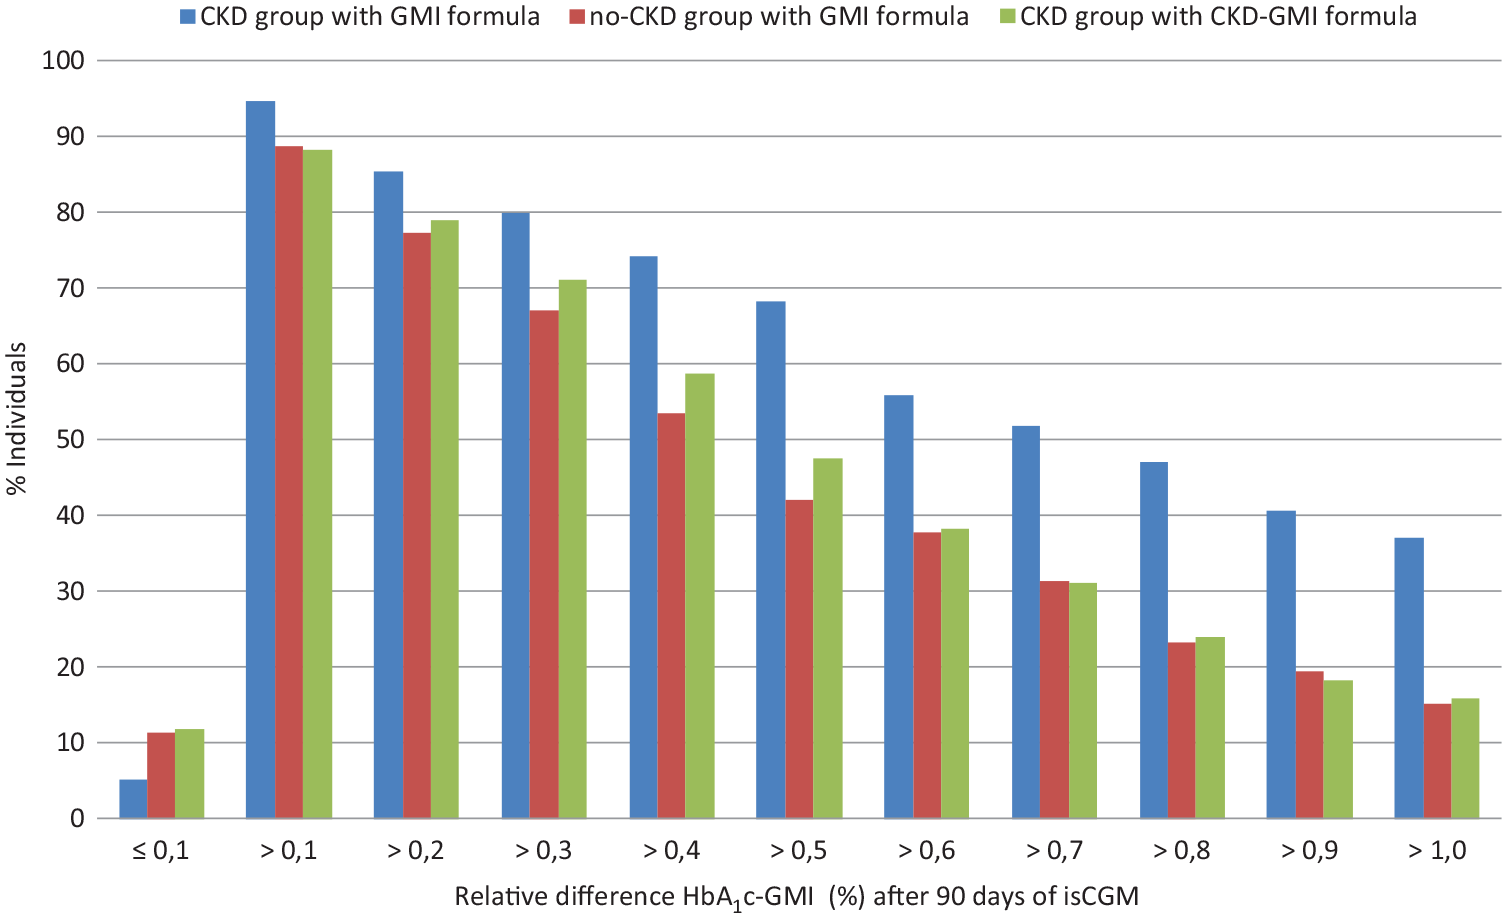
In Figure 1, individuals were subdivided as a percentage ratio based on the relative difference HbA1c-GMI threshold between CKD and no-CKD groups. The percentage of individuals is shown on the y-axis. The relative difference HbA1c-GMI is given on the x-axis after 90 days of isCGM.
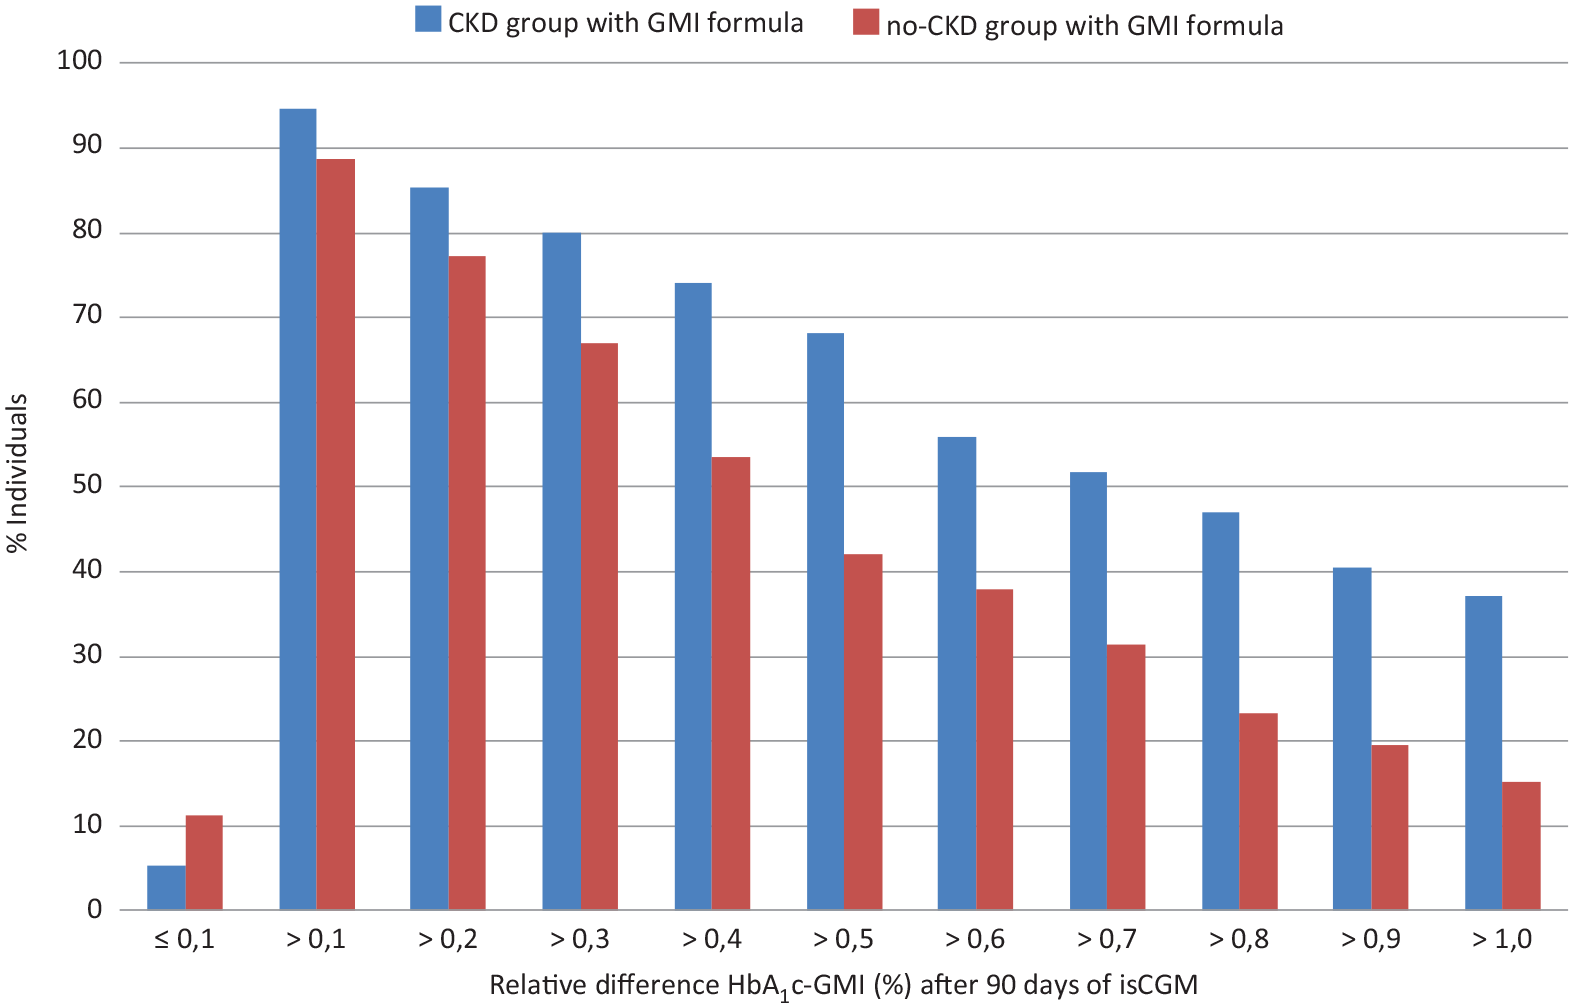
Individuals were subdivided as a percentage ratio based on the relative difference HbA1c-GMI threshold between CKD and no-CKD groups. Abbreviations: GMI, glucose management indicator; CKD, chronic kidney disease.
In the group with CKD, 9 (5.3%) individuals had a negative relative difference (HbA1c < GMI), whereas in the no-CKD group, 21 (11.4%) individuals had a negative relative difference (HbA1c < GMI). In each group, the most individuals had a positive relative difference (HbA1c > GMI). A relative positive difference HbA1c-GMI >0.5% was found in 68.2% of individuals in CKD group versus 42.2% in no-CKD group and a relative positive difference >1.0% was found in 37.1% of individuals in CKD group versus 15.1% in no-CKD group.
In Figure 2, Bland-Altman tests show that in the CKD group, the GMI calculated from 90-day CGM mean glucose data was 0.63% lower than the lab HbA1c (bias is 0.63%, SD of bias = 0.72; 95% limits of agreement were −0.79% to 2.05%). In the no-CKD group, GMI calculated from 90-day CGM mean glucose data was 0.43% lower than lab HbA1c (bias is 0.43%, SD of bias = 0.53; 95% limits of agreement were −0.60% to 1.47%).
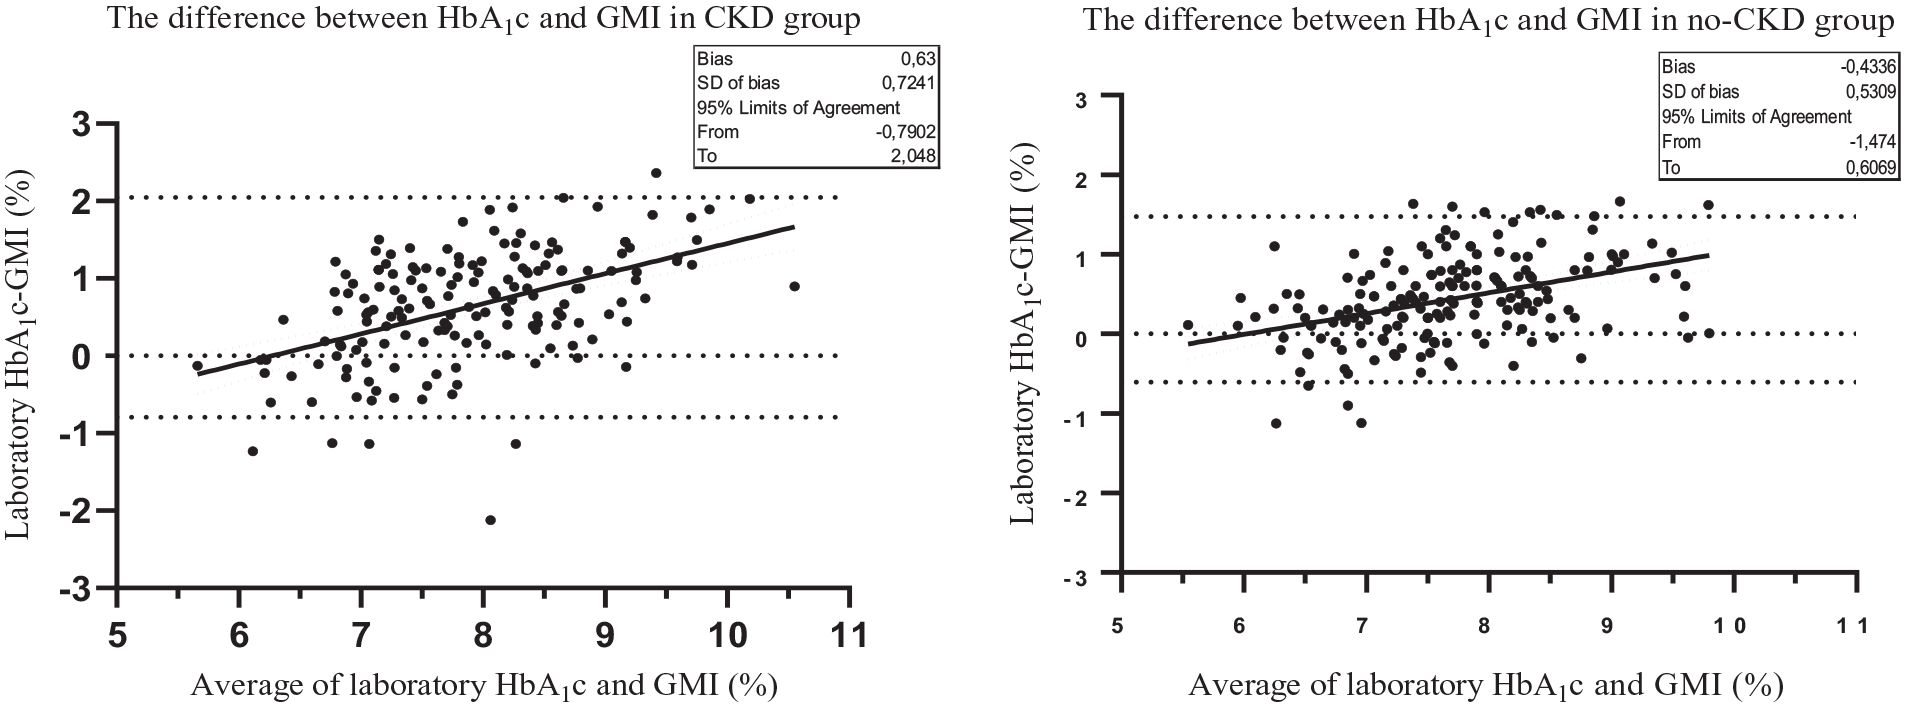
Bland-Altman test in CKD and no-CKD groups shows the difference HbA1c and GMI on the y-axis. The average of HbA1c and GMI is given on the x-axis. Abbreviations: CKD, chronic kidney disease; GMI, glucose management indicator.
Therefore, as described in the “Material and Methods” section, we suggest a specific new formula to calculate the GMI in CKD group (CKD-GMI) based on the linear regression between HbA1c and CGM mean glucose at 90 days = 3.558 + 0.026 × [CGM mean glucose (mg/dL)] (r2 = 0.59) (Figure 3). The Bland-Altman test shows that in the CKD group, the new formula (CKD-GMI) had near-zero average bias −0.007%, standard deviation of bias = 0.72; 95% limits of agreement are −1.42% to 1.4% (data not shown). Figure 4 is similar to Figure 1, adding the HbA1c-GMI difference according to the new CKD-GMI formula (green column) in the CKD group. We show that the CKD-GMI formula reduces the difference in the CKD group.
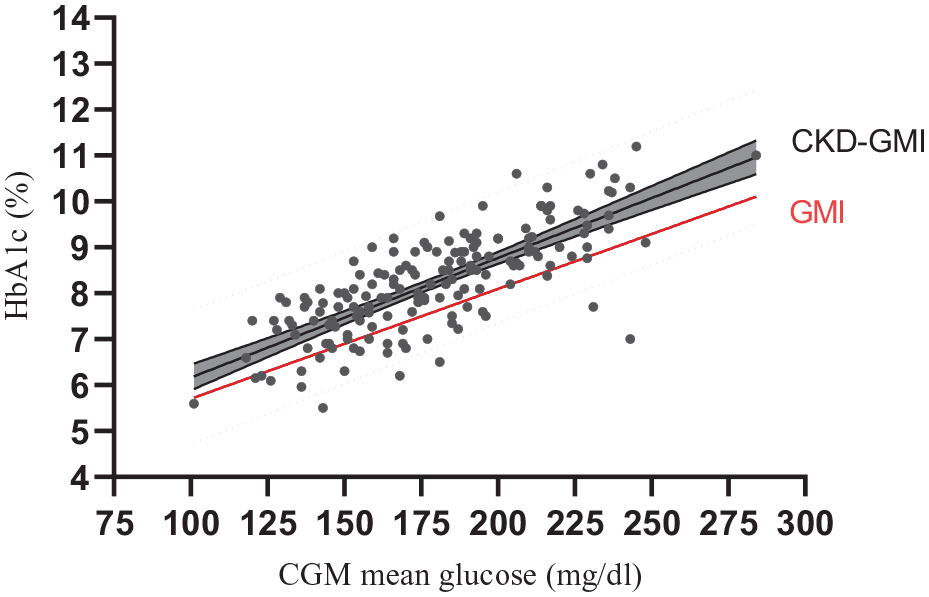
The regression linear of the CKD-GMI equation was plotted in solid black line. The 95% regression confidence intervals were shown in dark gray area and the prediction intervals were plotted in dotted black. The red line represents the GMI equation used in the CKD group. Abbreviations: CKD, chronic kidney disease; GMI, glucose management indicator.
Individuals were subdivided as a percentage ratio based on the relative difference HbA1c-GMI threshold between CKD and no-CKD groups. Abbreviations: GMI, glucose management indicator; CKD, chronic kidney disease.
We then performed a univariate analysis (Table 2) to investigate the relationship between the HbA1c-GMI difference >0.5% versus
Univariate Analyses Investigating the Relationship Between the Absolute Difference HbA1c-GMI and the Parameters Studied.
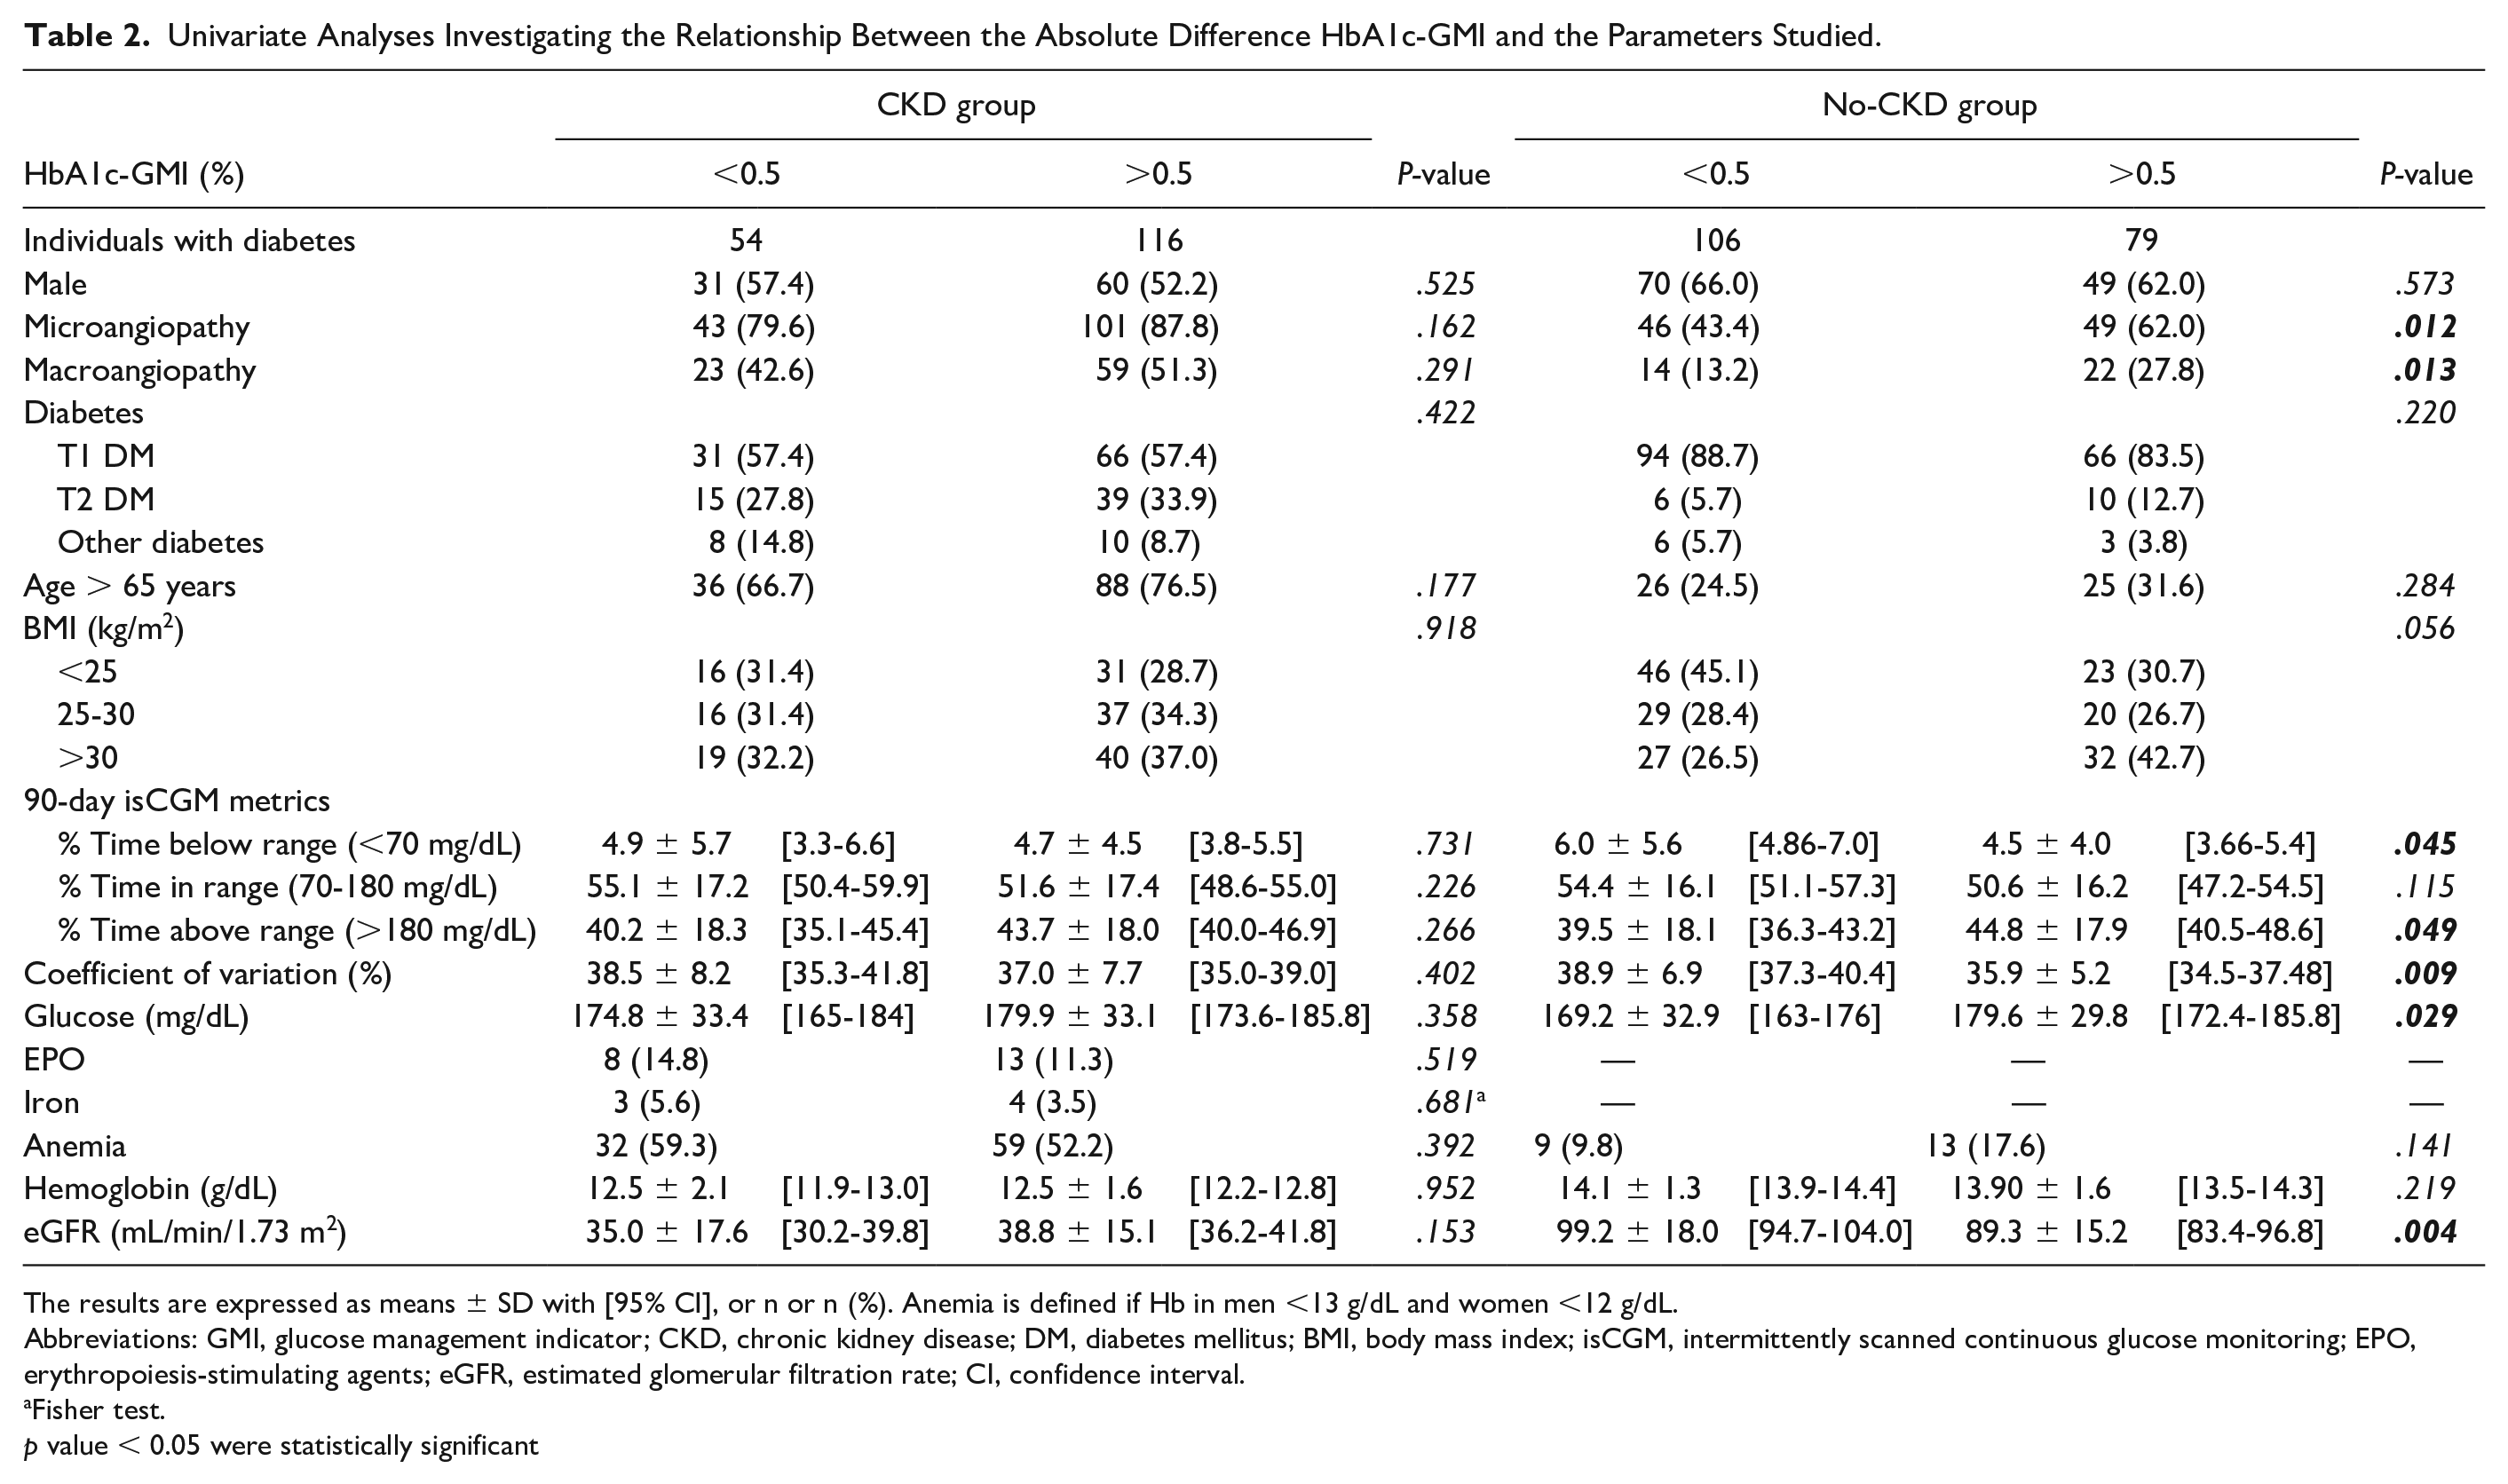
The results are expressed as means ± SD with [95% CI], or n or n (%). Anemia is defined if Hb in men <13 g/dL and women <12 g/dL.
Abbreviations: GMI, glucose management indicator; CKD, chronic kidney disease; DM, diabetes mellitus; BMI, body mass index; isCGM, intermittently scanned continuous glucose monitoring; EPO, erythropoiesis-stimulating agents; eGFR, estimated glomerular filtration rate; CI, confidence interval.
Fisher test.
p value < 0.05 were statistically significant
Discussion
In this large multicenter study, mainly involving individuals with type 1 diabetes, we show that between the groups compared (CKD vs no-CKD), CGM-derived parameters were similar while HbA1c levels were different. HbA1c is mostly higher than GMI. We found discordances (HbA1c-GMI) especially in individuals with diabetes and CKD.
In fact, 68% of individuals with CKD and 42% of those without CKD had an absolute discordance greater than 0.5%. These data are higher than those of the original Bergenstal cohort, where 28% of individuals had a difference greater than 0.5%. 10 Our results are therefore closer to those of a recent “real life study” by Perlman et al, 16 which showed that 50% of subjects had a discordance over 0.5%. Furthermore, in the Perlman study, only CKD was associated with the discordance.
The significance of the discordance has not sufficiently been studied in the CKD population. 4
In our study, HbA1c was significantly higher in individuals with diabetes and CKD than in those without, whereas CGM-derived data were similar. However, we did not identify in the CKD individuals, the underlying cause of the discordance.
Older age of individuals would be a factor in the difference between HbA1c and average blood glucose, 17 but this parameter was not found in our study, nor was gender, 18 anemia or degree of eGFRs rates, iron, or EPO.6,19
Nevertheless, some hypothesis can be suggested.
First, laboratory HbA1c interpretation has limitation for people with CKD. 4 However, some potentially interfering parameters were not recorded in our study, such as erythrocyte life span, hypoxia, uric acid levels, dysthyroidism, or liver disease. 18 Second, the GMI formula estimates HbA1c from mean glucose values regardless of the CGM model used.
However, the GMI formula has only been validated for the Dexcom G5, Guardian 3, and Navigator 2 CGM. 20 Recent studies have therefore raised the question of the accuracy of the GMI formula depending on the CGM used.16,21 Pleus et al described differences in GMI measurements between Dexcom G5 and FreeStyle Libre sensors, worn by the same study subjects, GMI differed by up to 1.13% (absolute differences), with a 75th percentile of 0.42%. 21 Therefore, this suggests that the formula for estimating HbA1c from average glucose should be specific to a brand of CGM including the Free style Libre used in our study.
Nevertheless, although there are still significant interpretation problems in understanding the HbA1c-GMI difference, it is interesting to consider this difference from a clinical perspective.11,22
The question is whether the presence of a difference implies a risk of developing diabetic nephropathy or whether the difference is simply indicative of a more extensive glycation process in individuals with CKD. At present, there are no large prospective studies using CGM over the long term to demonstrate a causal relationship.
The main strength of our study is the analysis of discordance between HbA1c-GMI through a comparison of 14- and 90-day isCGM data with HbA1c measurement in a large “real-life” population. Thus, isCGM provides an efficient method to understand the full spectrum of glucose exposure. In previous studies including people with diabetes and CKD, the discordance was analyzed only with data for up to 14 days. We validate the discordance also at 90 days of CGM data. 23
Moreover, it is recognized that 14 days of CGM data are sufficient to predict HbA1c. 12 We therefore compared the prediction of HbA1c from GMI calculated from 14-day and 90-day CGM data in the two study groups. In no-CKD group, we confirm that 14 days of CGM data provide a suitable estimate of glucose parameters for a three-month period. 12 Whereas, for individuals with CKD, GMI were significantly different at 14 and 90 days (7.66% vs 7.52%, P < .024). Thus, GMI appears to be closer to HbA1c with analyses at 14 days than with analyses at 90 days in CKD. These findings are in accordance with the study of Presswala et al 24 who found a correlation between HbA1c and mean glucose concentration by FSL at 14 days in individuals with CKD (however, 90-day recordings were not analyzed).
The main limitation of our analysis is the lack of knowledge about the accuracy of isCGM in the CKD population, because there was no calibration of the CGM device worn by the individuals. But in contrast to other studies, all individuals had the same isCGM. This reduces the misinterpretation due to different CGM-derived data.
To understand the discordance, we looked at patients with various comorbidities known to affect the accuracy of HbA1c. However, our study does not determine the reason for the discordance, probably due to the cross-sectional nature of the study.
Finally, as recently advocated in a pediatric population, 25 we recommend a new formula estimating HbA1c from the mean interstitial glucose captured by the isCGM sensor specific to individuals with CKD.
But, to reduce the gap HbA1c-estimating HbA1c, it is therefore advised that new models take into account not only CGM-derived data but also the patient’s renal status, and other interindividual variations such as red blood cell life span, glucose uptake, and glycation rates. 26
Conclusions
The difference between HbA1c and GMI is yet described in real-world clinical practice. We also noted a discrepancy of >0.5% in 68% of individuals with diabetes and CKD. The difference showed a lower GMI than HbA1c, significantly more important in the CKD group than in the non-CKD group.
The physiological consequences of this discrepancy are not clear. However, this HbA1c-GMI difference should be explored because studies have hypothesized a relationship between the glycation gap and the development of micro or macro vascular complications. 27 However, a large prospective study is needed to validate this hypothesis. Finally, our study suggests that GMI data should be adapted to some populations, such as individuals with diabetes suffering from CKD.
Footnotes
Acknowledgements
The authors thank all the doctors and nurses who participated in data collection and patient care.
Abbreviations
BMI, body mass index; CGM, continuous glucose monitoring; CKD, chronic kidney disease; DM, diabetes mellitus; FSL1, freeStyle® Libre™ 1; GMI, glucose management indicator; GV%, coefficient of glucose variation; HbA1c, hemoglobin A1c; isCGM, intermittently scanned continuous glucose monitoring; TIR, time in range.
Contribution by the Authors
PO, CV, AV, SG, JC, and GP wrote, edited, reviewed the manuscript, and contributed to the discussion. PO, CV, and AV contributed to the data collection. CV and SG analyzed the statistical data. All authors participated in the conception and design or analysis and interpretation of the data; drafting the article or revising it critically for important intellectual content; and approval of the final version.
Declaration of Conflicting Interests
The author(s) declared no potential conflicts of interest with respect to the research, authorship, and/or publication of this article.
Funding
The author(s) received no financial support for the research, authorship, and/or publication of this article.