
Abstract
Introduction:
This technology report introduces an innovative risk communication tool developed to support providers in communicating diabetes-related risks more intuitively to people with type 2 diabetes mellitus (T2DM).
Methods:
The development process involved three main steps: (1) selecting the content and format of the risk message; (2) developing a digital interface; and (3) assessing the usability and usefulness of the tool with clinicians through validated questionnaires.
Results:
The tool calculates personalized risk information based on a validated simulation model (United Kingdom Prospective Diabetes Study Outcomes Model 2) and delivers it using more intuitive risk formats, such as “effective heart age” to convey cardiovascular risks. Clinicians reported high scores for the usability and usefulness of the tool, making its adoption in routine care promising.
Conclusions:
Despite increased use of risk calculators in clinical care, this is the first time that such a tool has been developed in the diabetes area. Further studies are needed to confirm the benefits of using this tool on behavioral and health outcomes in T2DM populations.
Keywords
Good patient–provider communication and shared decision-making have been associated with improved self-management1,2 and glycemic control 3 in type 2 diabetes mellitus (T2DM) populations. Although significant progress has been made to enhance this “patient–provider partnership” over the past two decades, 4 some challenges remain. For example, many patients still face difficulties in understanding the probabilistic risk information traditionally used by clinicians to convey increased risks of complications associated with poor glycemic control. 5 Given that risk perceptions play a key role in the behavior change process,6,7 and that people with T2DM tend to have inaccurate perceptions of these risks 5 , there is a need to develop risk communication strategies that are more effective than existing methods in correcting for risk misperceptions.8,9 Most interventions to date have hardly produced any effect on risk perception accuracy, with the most effective strategies only leading to short-term improvements lasting between two 8 and six weeks. 10 This article reports on the development of a digital tool designed to support providers in communicating diabetes-related risks more intuitively in routine care, so that patients can update their risk perceptions and, in turn, engage in shared decision making more effectively.
Methods
A team including two digital health specialists, two health economists, one behavioral economist, and one general practitioner experienced with diabetes research (“the research team”) took part in the development process. This consisted of three steps: (1) selecting the content of the tool; (2) developing the digital interface; and (3) testing the usability of the interface with a sample of target end users (ie, providers) and refining it accordingly.
Content of the Tool
Selection of the content and format of the risk message (what should be communicated, and how) was guided by a thorough review of the risk communication literature and by insights from behavioral science. Evidence suggests that the risk message should stay brief and simple (so that it can be understood regardless of patient numeracy skills), 11 and should be personalized. 12 In addition, the use of imagery and interactive features, which stimulate attention and working memory, has been recommended.13,14
Based on these recommendations and on the results of a feasibility study conducted in routine care with 40 patients with T2DM, in which specific innovative risk metrics were found to be superior over probabilistic information in increasing risk perception accuracy, 15 we chose to limit the content of the tool to just two types of risk information, conveyed through carefully selected formats.
Increased cardiovascular risks, expressed through “effective heart age”
Despite being the major threat associated with lack of diabetes control, increased cardiovascular (CV) risks tend to be largely underestimated by people with T2DM. 5 We chose to use the concept of effective heart age to express those risks, which corresponds to the age of a similar “well-controlled” individual (ie, whose risk factors are within normal value ranges) with matching CV risk probability. 16 This format makes the risk information more salient and memorable as compared to communication of (seemingly abstract) probabilistic information.17,18
Reduced life expectancy, conveyed using a short time frame
Communicating reductions in life expectancy associated with lack of diabetes control has the advantage of capturing a more global impact of the detrimental effects on health (ie, conveying the “big picture”). We chose to use a shorter (monthly) time frame to communicate such losses of lifetime, because positive effects on risk understanding 19 and perceptions 10 , 20 have been reported. For example, a 0.5% (14 mg/dL) increase in HbA1c may translate into a 3-day loss of lifetime each month, rather than a 2-year loss at the end of life. This may be interpreted as “aging faster” than a similar, well-controlled individual. 21 The superiority of shorter time frames, which make losses look more immediate, may be explained by recent findings in behavioral science where many people with T2DM were found to express a present bias (the tendency to value immediate rewards more than future, bigger rewards) 22 and loss aversion (the tendency to dislike losses more than enjoying equivalent gains). 23
Digital Interface
We then developed a digital interface based on the selected content described in the previous section. The code uses simulation data produced by the United Kingdom Prospective Diabetes Study (UKPDS) Outcomes Model (version 2) to calculate personalized risk estimates. 24 To maximize the user-friendliness of the interface, we collaborated with a digital studio specialized in user experience design and with two volunteer patients. Two design criteria were considered of higher priority: ease of use and speed of use, in order to minimize the risk of providers being reluctant to adopt the tool in routine care.
Usability Testing
Finally, we tested the usability of the interface with a sample of providers. Following Li et al (2013), 25 our protocol consisted of a three-step iterative process whereby we (1) tested the pilot version to identify modifiable usability issues (Cycle 1); (2) stopped testing after no new issue could be identified and made revisions; and (3) tested the revised version to identify new issues (Cycle 2). A usability issue was identified when a participant was unable to move on to the next step due to design or programming errors, or when at least two participants commented on the same issue.
Participants were given a virtual patient profile and asked to use the tool in a simulated way while expressing their thoughts aloud. Notes were taken and sessions were audio-recorded. The participants were also asked to complete two questionnaires: (1) the System Usability Scale (SUS) 26 for ease of use; and (2) a tailored questionnaire rooted in the Technology Acceptance Model (TAM) for intentions to use the tool, if made available. 27 We used descriptive statistics to summarize participant characteristics and SUS- and TAM-based scores after each testing cycle. No statistical comparisons were conducted between cycles, as hypothesis testing was not a goal of this study. Our data analysis was inductive, as we sought to understand the participants’ experience with the tool rather than to test a preconceived theory.
Results
The tool was given the name “PERCODIA”, which stands for “personalized risk communication for people with type 2 diabetes”. It is available in English language and compatible with both computers and electronic tablets. The digital interface is made up of four pages: a welcome page, a data-entry page, and two pages displaying heart age and speed of aging. It is intended to be displayed on a screen that is viewed simultaneously by both the clinician and the patient. Figures 1 and 2 illustrate the data-entry and heart age pages, respectively; other pages and a more detailed description can be found in Supplementary Materials. In addition, Table 1 provides the list of information needed to calculate the patients’ personalized risk estimates, and Table 2 indicates the modifiable risk factors that can be targeted by clinicians to visually show patients the potential improvement (or degradation) in risk estimates associated with an improvement (or degradation) of those risk factors.
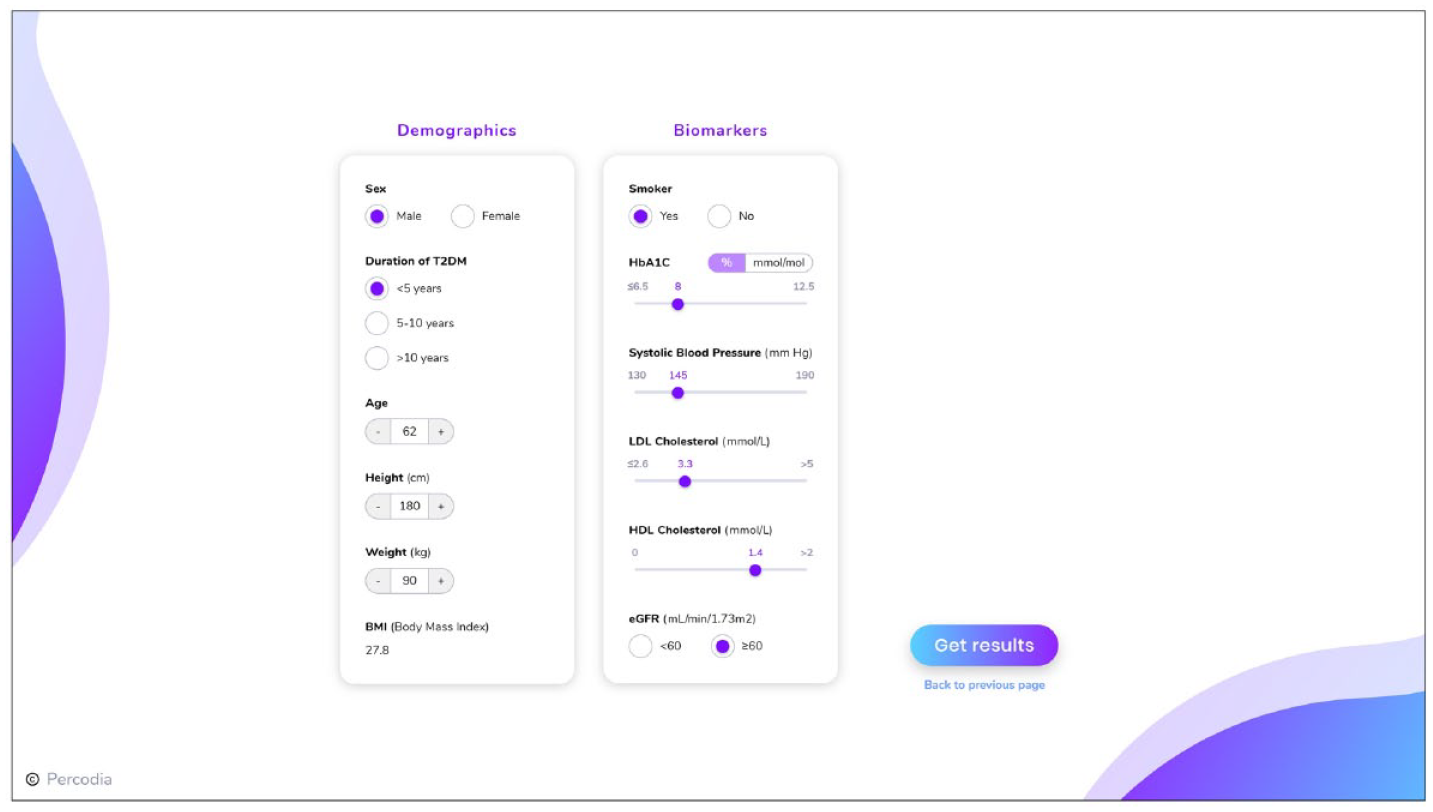
Data-entry page.
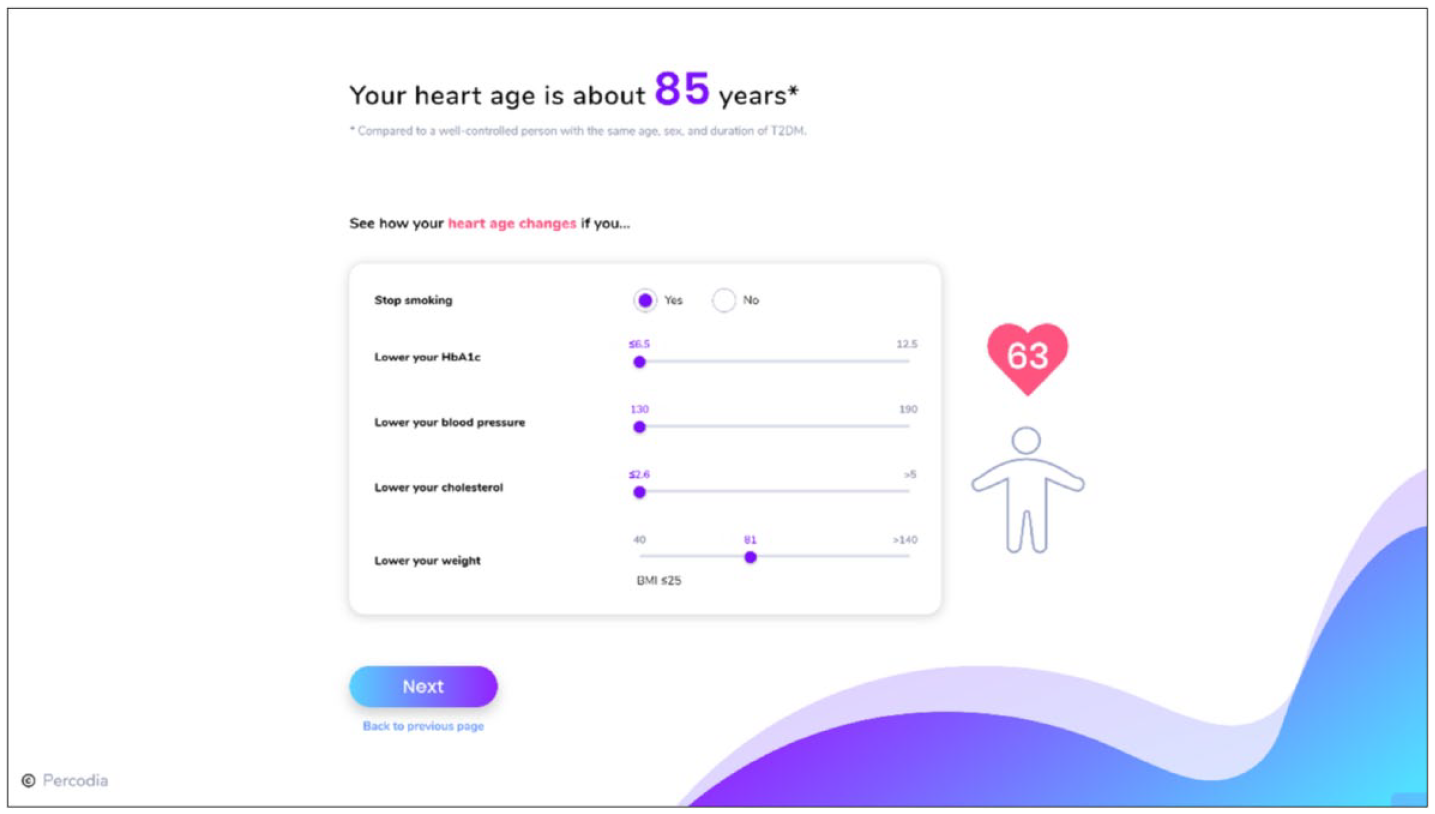
Heart age page.
Information Needed by Tool Users to Calculate Patients’ Personalized Risk Estimates.
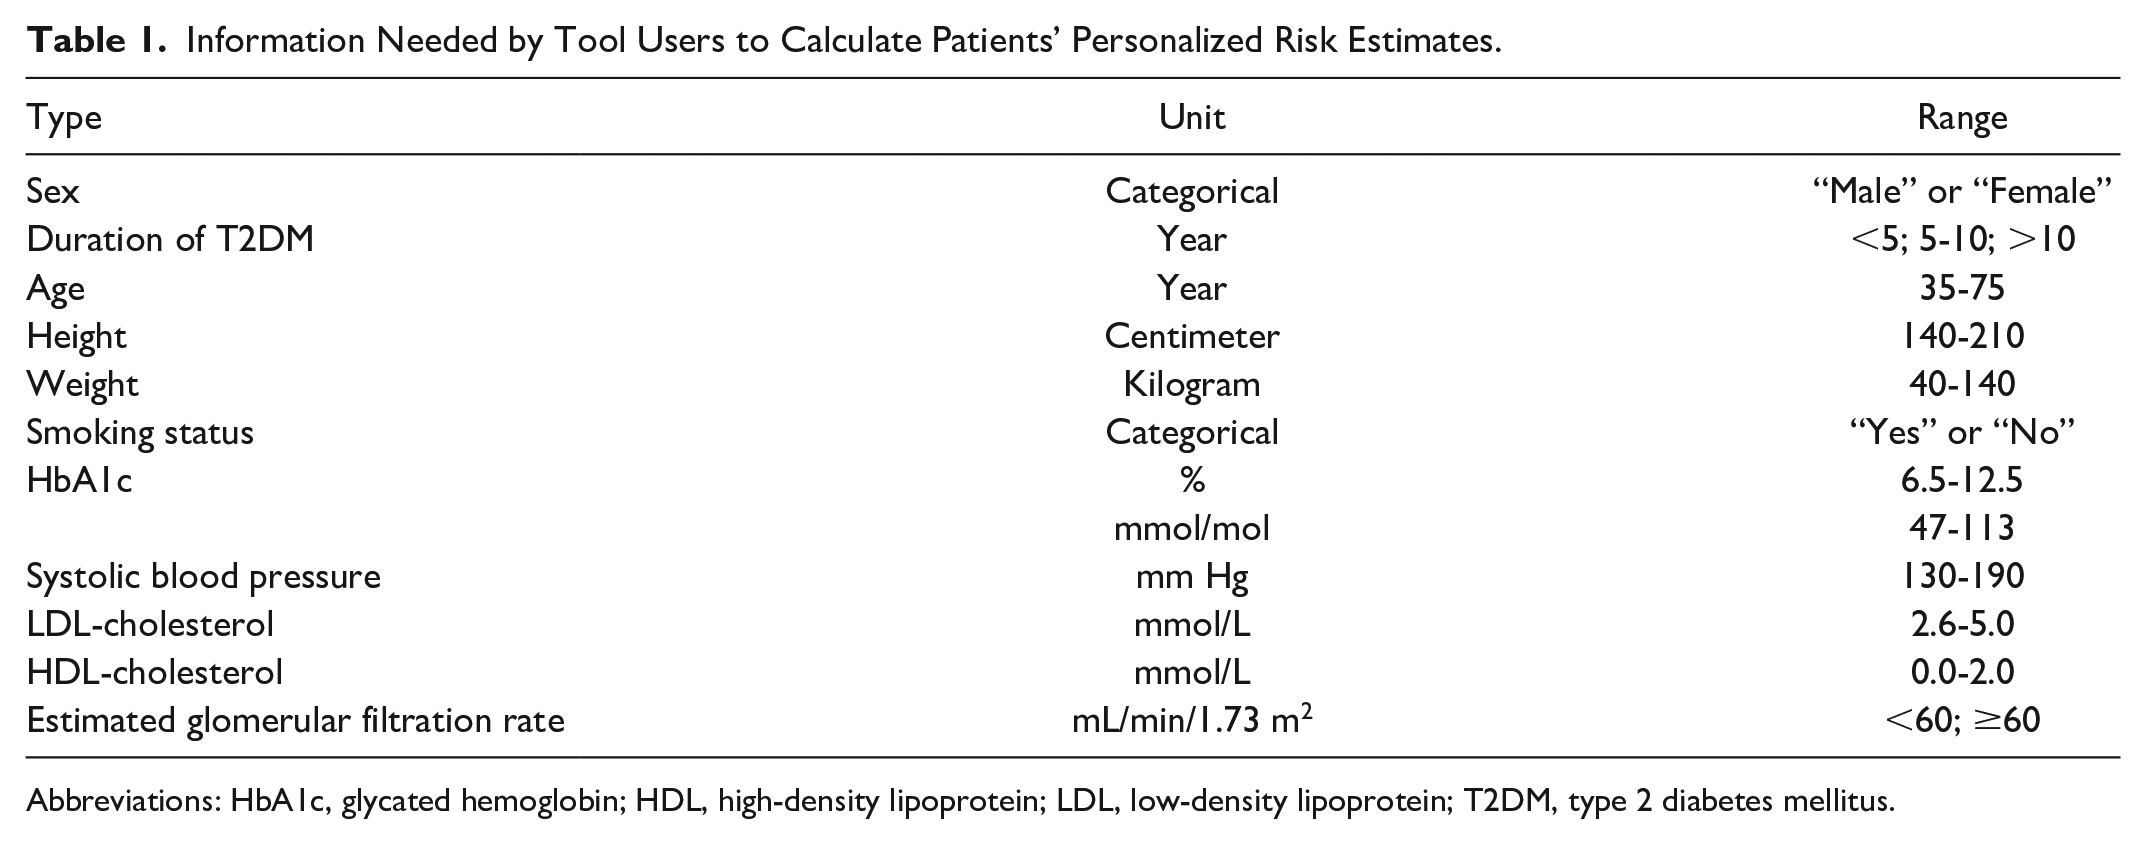
Abbreviations: HbA1c, glycated hemoglobin; HDL, high-density lipoprotein; LDL, low-density lipoprotein; T2DM, type 2 diabetes mellitus.
Modifiable Risk Factors that can be Targeted by Tool Users to Illustrate the Potential Improvement (or Degradation) in Patients’ Personalized Risk Estimates.
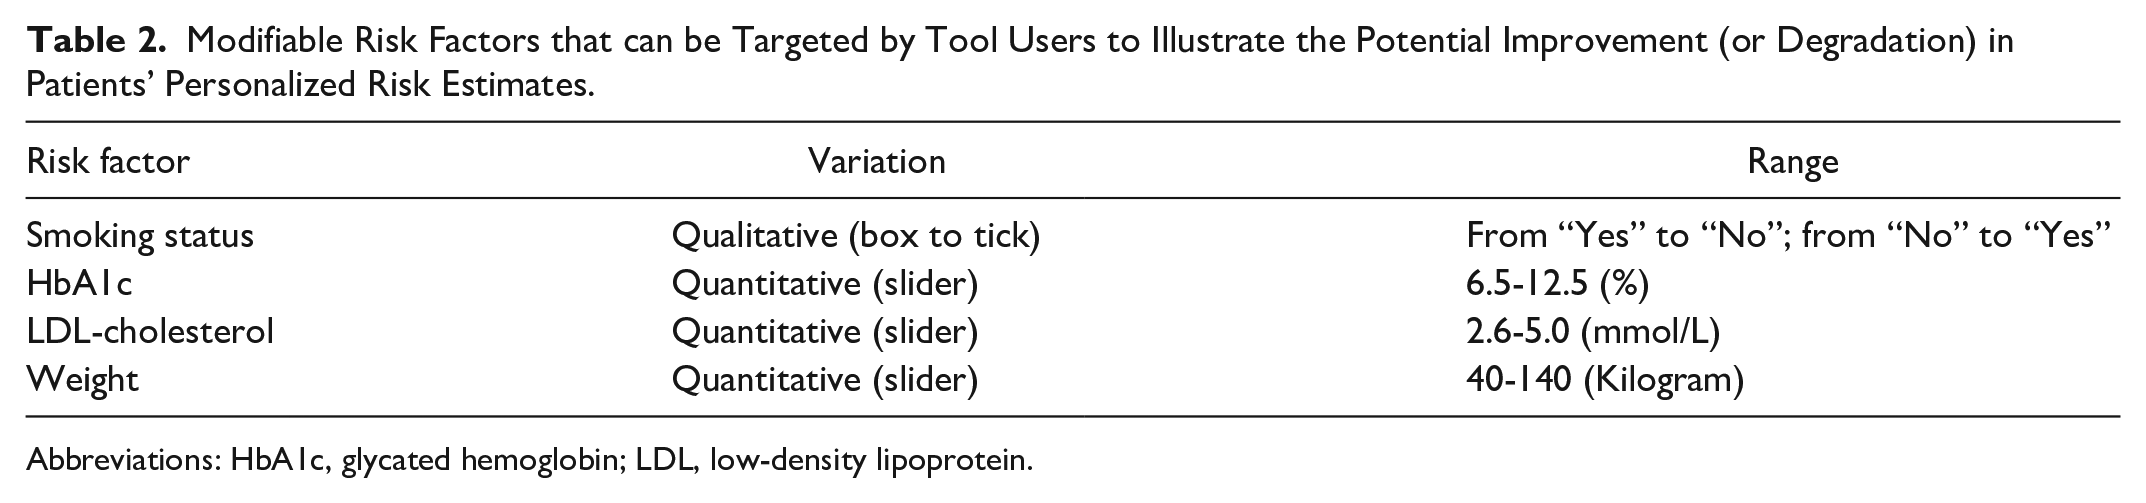
Abbreviations: HbA1c, glycated hemoglobin; LDL, low-density lipoprotein.
Usability Testing
We recruited 16 providers on a voluntary basis in Oxford, UK. Twelve were general practitioners and four were junior medical practitioners engaged in postgraduate training. Of those, 11 participated in Cycle 1 and 5 tested the revised version in Cycle 2. Seven modifiable usability issues were identified in Cycle 1 (see details in Supplementary Materials), whereas Cycle 2 did not reveal any new issue. All SUS- and TAM-based scores are reported in Table 3.
Usability Testing Results: SUS- and TAM-based Scores.
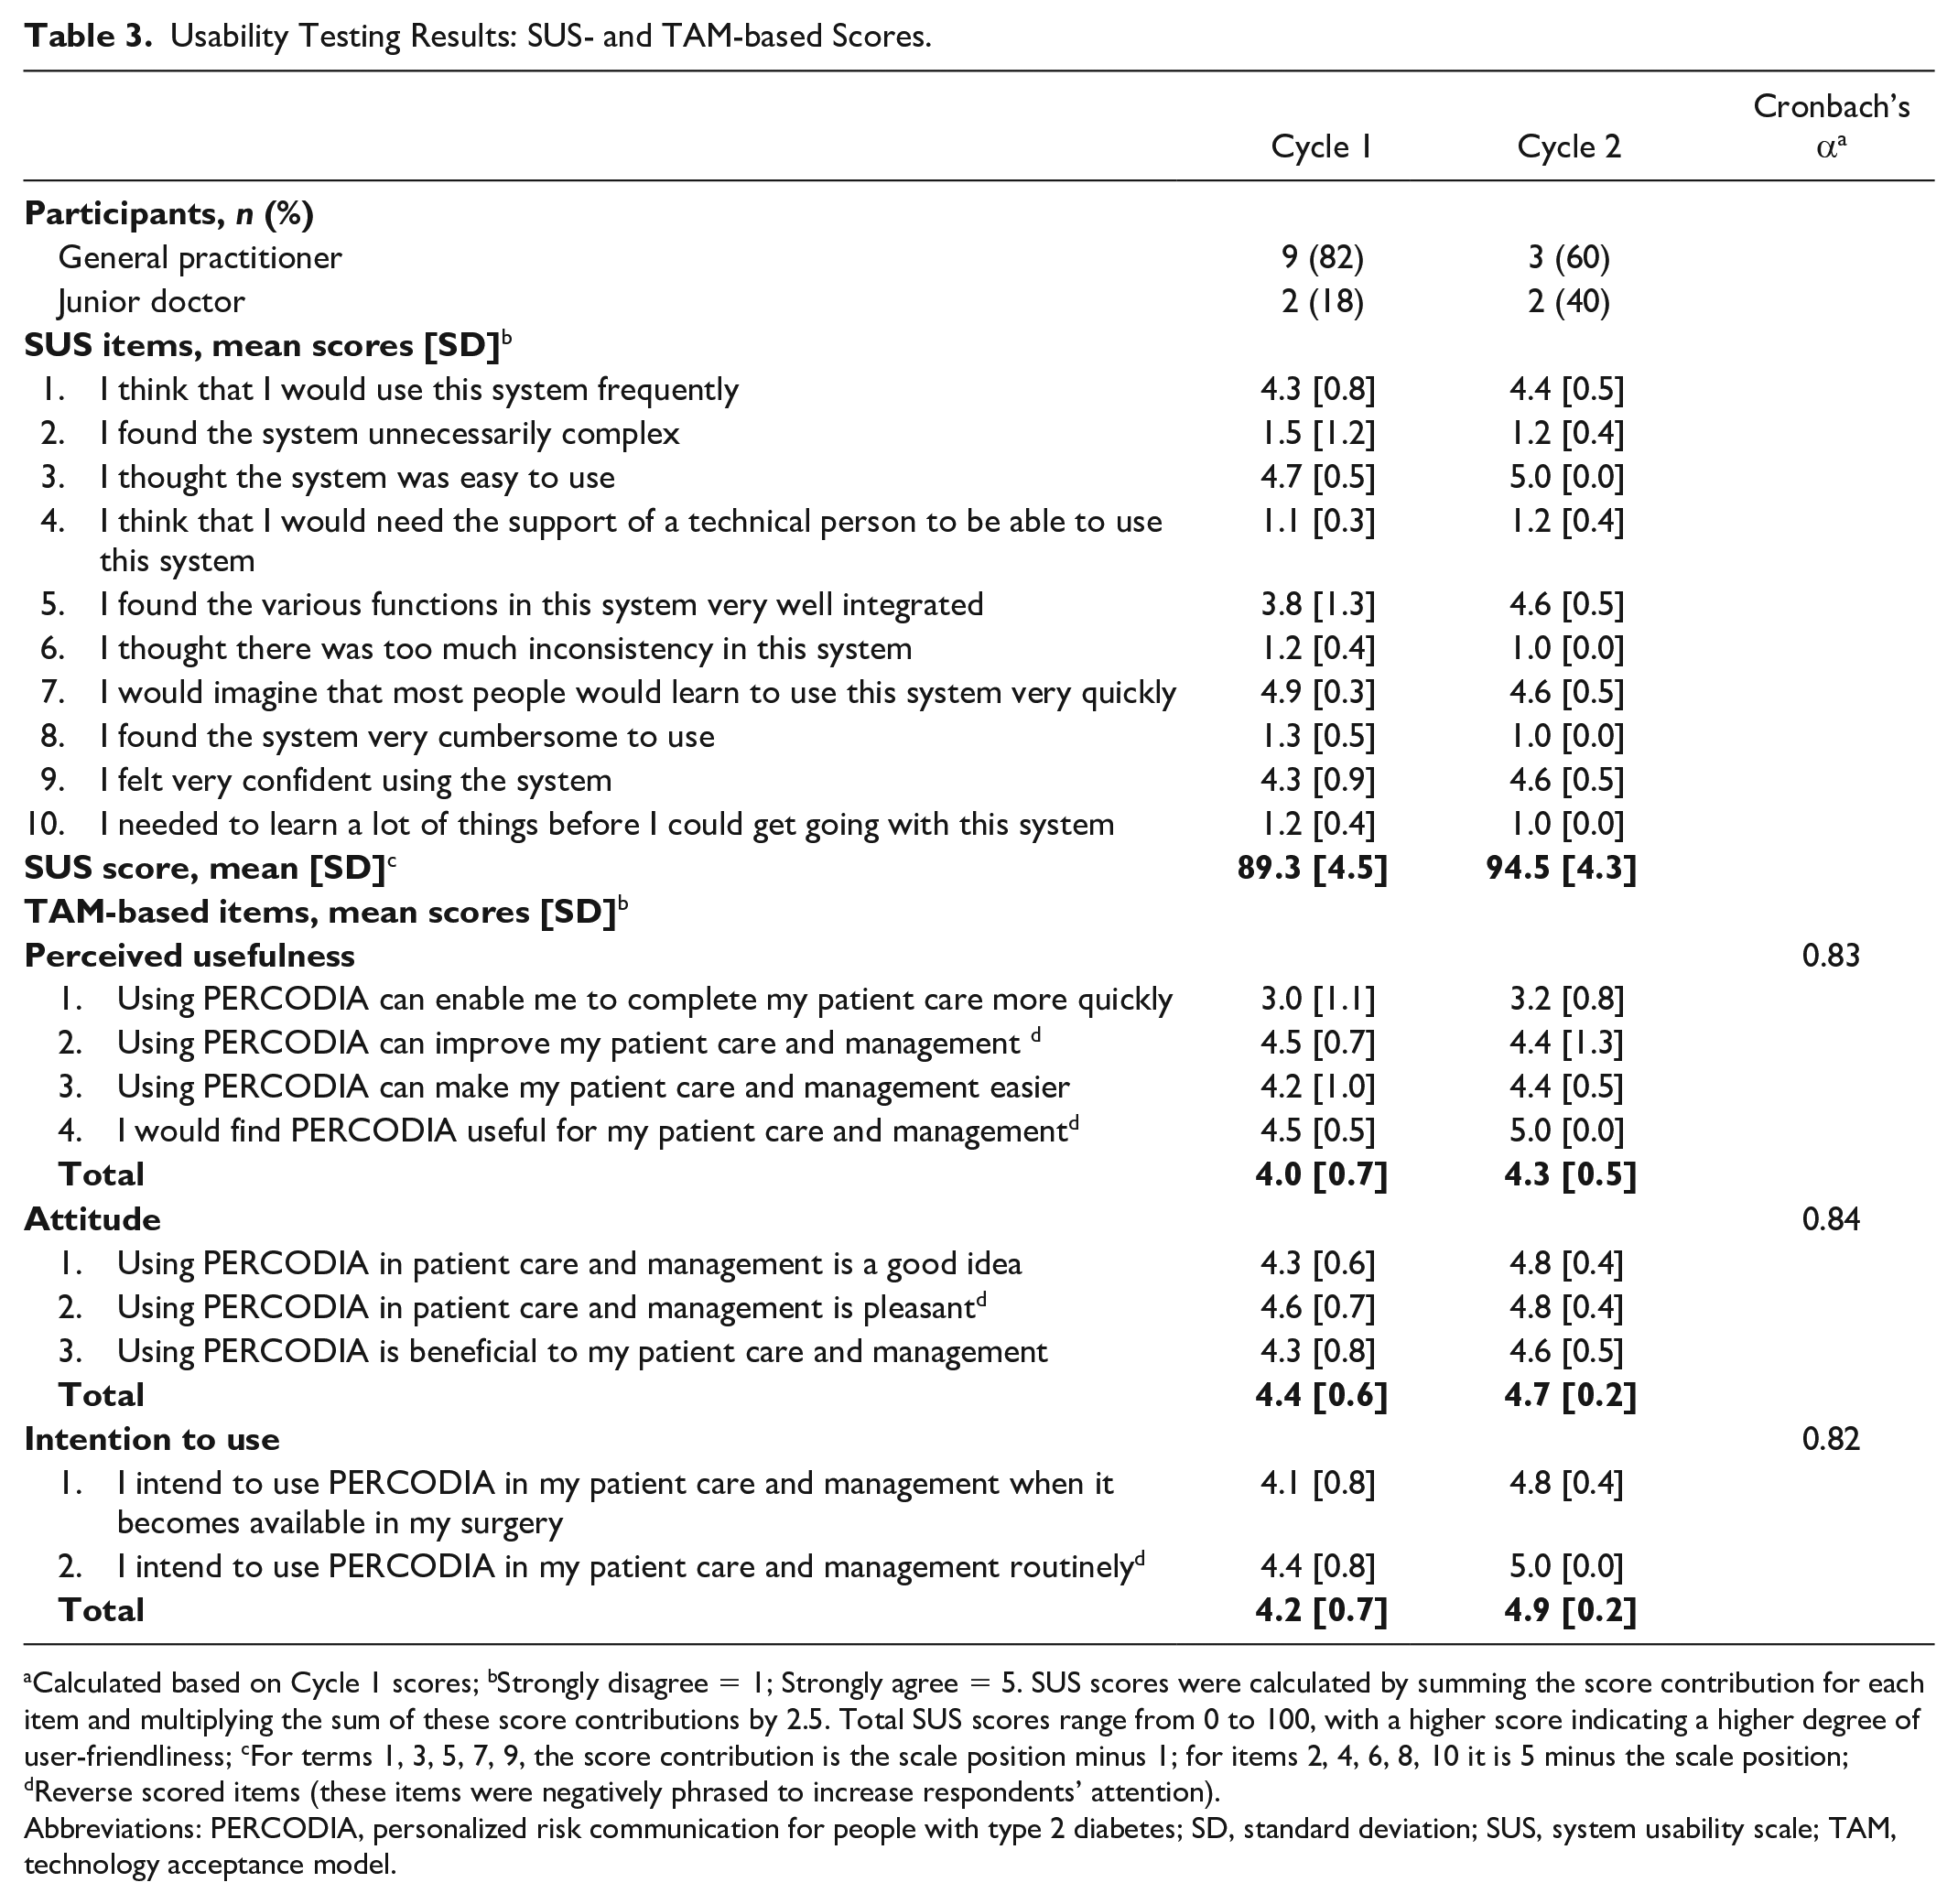
Calculated based on Cycle 1 scores; bStrongly disagree = 1; Strongly agree = 5. SUS scores were calculated by summing the score contribution for each item and multiplying the sum of these score contributions by 2.5. Total SUS scores range from 0 to 100, with a higher score indicating a higher degree of user-friendliness; cFor terms 1, 3, 5, 7, 9, the score contribution is the scale position minus 1; for items 2, 4, 6, 8, 10 it is 5 minus the scale position; dReverse scored items (these items were negatively phrased to increase respondents’ attention).
Abbreviations: PERCODIA, personalized risk communication for people with type 2 diabetes; SD, standard deviation; SUS, system usability scale; TAM, technology acceptance model.
Discussion
This research aimed to offer clinicians a practical tool to communicate diabetes-related risks more intuitively in routine care, so that shared decision making is made easier. Quoting Greenhalgh and colleagues, clinical tools that contain quantitative elements must be designed “to support conversations, not climb probability trees”, because real shared decision making involves introducing evidence “in a way that informs a dialogue about what best to do, how, and why”. 28 With PERCODIA, providers have the option to visually show patients how reducing a modifiable risk factor can improve heart age or slow down speed of aging, and how each of these two metrics can be used as an intuitive marker to set risk reduction goals.
Providers who tested the tool reported high scores for usability and usefulness, making its adoption in routine care promising. Nevertheless, the development process had a few limitations. There was a risk of selection bias due to the recruitment of participants on a voluntary basis, and budgetary constraints prevented us from integrating more sophisticated features into the interface. In practice, a function to auto-populate patient data through linkage to electronic health records would be beneficial to save additional time in consultation. Finally, although the tool calculates risks based on the estimates of a successfully validated model, 29 its own validation as a predictive model is still needed.
Provided that future studies investigating the effects of using PERCODIA show benefits on risk perception accuracy and shared decision making, there will be an opportunity to improve the management of people with T2DM by adding this tool to the clinician’s toolbox in routine care. Such risk assessment tools have shown promise in improving behavioral outcomes or risk factor levels in other disease areas, 30 and several clinical guidelines now recommend their use as part of the routine care pathway (eg, prevention of hypertension 31 or atherosclerotic disease 32 ). By contributing to the development of such tools in the diabetes area, we hope to support clinicians in helping patients with T2DM achieve significant risk factor changes and, eventually, improvements in health outcomes.
Conclusions
Despite increased use of risk calculators in clinical care, this is the first time that such a tool has been developed in the diabetes area. Future work will explore the effects of using this tool on patient and provider behavioral outcomes in routine care. If proven beneficial, positive effects on health outcomes in T2DM populations are to be expected.
Supplemental Material
sj-pdf-1-dst-10.1177_1932296821995800 – Supplemental material for An Intuitive Risk Communication Tool to Enhance Patient–Provider Partnership in Diabetes Consultation
Supplemental material, sj-pdf-1-dst-10.1177_1932296821995800 for An Intuitive Risk Communication Tool to Enhance Patient–Provider Partnership in Diabetes Consultation by Thomas Rouyard, José Leal, Dario Salvi, Richard Baskerville, Carmelo Velardo and Alastair Gray in Journal of Diabetes Science and Technology
Footnotes
Acknowledgements
The authors would like to thank Dr. James Groves at Oxford University Innovation Ltd, Mariana Morris at Fruto UX Design Studio, and all the volunteers who kindly participated in the development process.
Authors’ Note
Data included in this manuscript were presented in part at the 2020 BEST Conference on Human Behaviour & Decision Making (Brisbane, Australia) and at the 2020 CBC Online Conference “Behaviour Change for Health: New and Emerging Science and Technologies” (London, UK).
Abbreviations
CV, cardiovascular; SUS, system usability scale; T2DM, type 2 diabetes mellitus; TAM, technology acceptance model; UKPDS, United Kingdom Prospective Diabetes Study.
Declaration of Conflicting Interests
The author(s) declared the following potential conflicts of interest with respect to the research, authorship, and/or publication of this article: the working title of intellectual property (IP) associated with the technology presented in this report falls within a sharing agreement between the authors and Oxford University Innovation Ltd. Oxford University Innovation Ltd is a wholly owned subsidiary of the University of Oxford in charge of managing the University’s IP portfolio.
Funding
The author(s) disclosed receipt of the following financial support for the research, authorship, and/or publication of this article: Financial support for this research was provided entirely by grants from the European Institute of Innovation and Technology (EIT Health) and the UK National Institute for Health Research (NIHR), Collaboration for Leadership in Applied Health Research and Care (CLAHRC) at Oxford Health NHS Foundation Trust. The funding agreement ensured the authors’ independence in designing the study, interpreting the data, writing, and publishing the report.
Supplemental Material
Supplemental material for this article is available online.
References
Supplementary Material
Please find the following supplemental material available below.
For Open Access articles published under a Creative Commons License, all supplemental material carries the same license as the article it is associated with.
For non-Open Access articles published, all supplemental material carries a non-exclusive license, and permission requests for re-use of supplemental material or any part of supplemental material shall be sent directly to the copyright owner as specified in the copyright notice associated with the article.